


Cordycepin alleviates oxaliplatin-induced fatty liver disease
 0
0 
Abstract
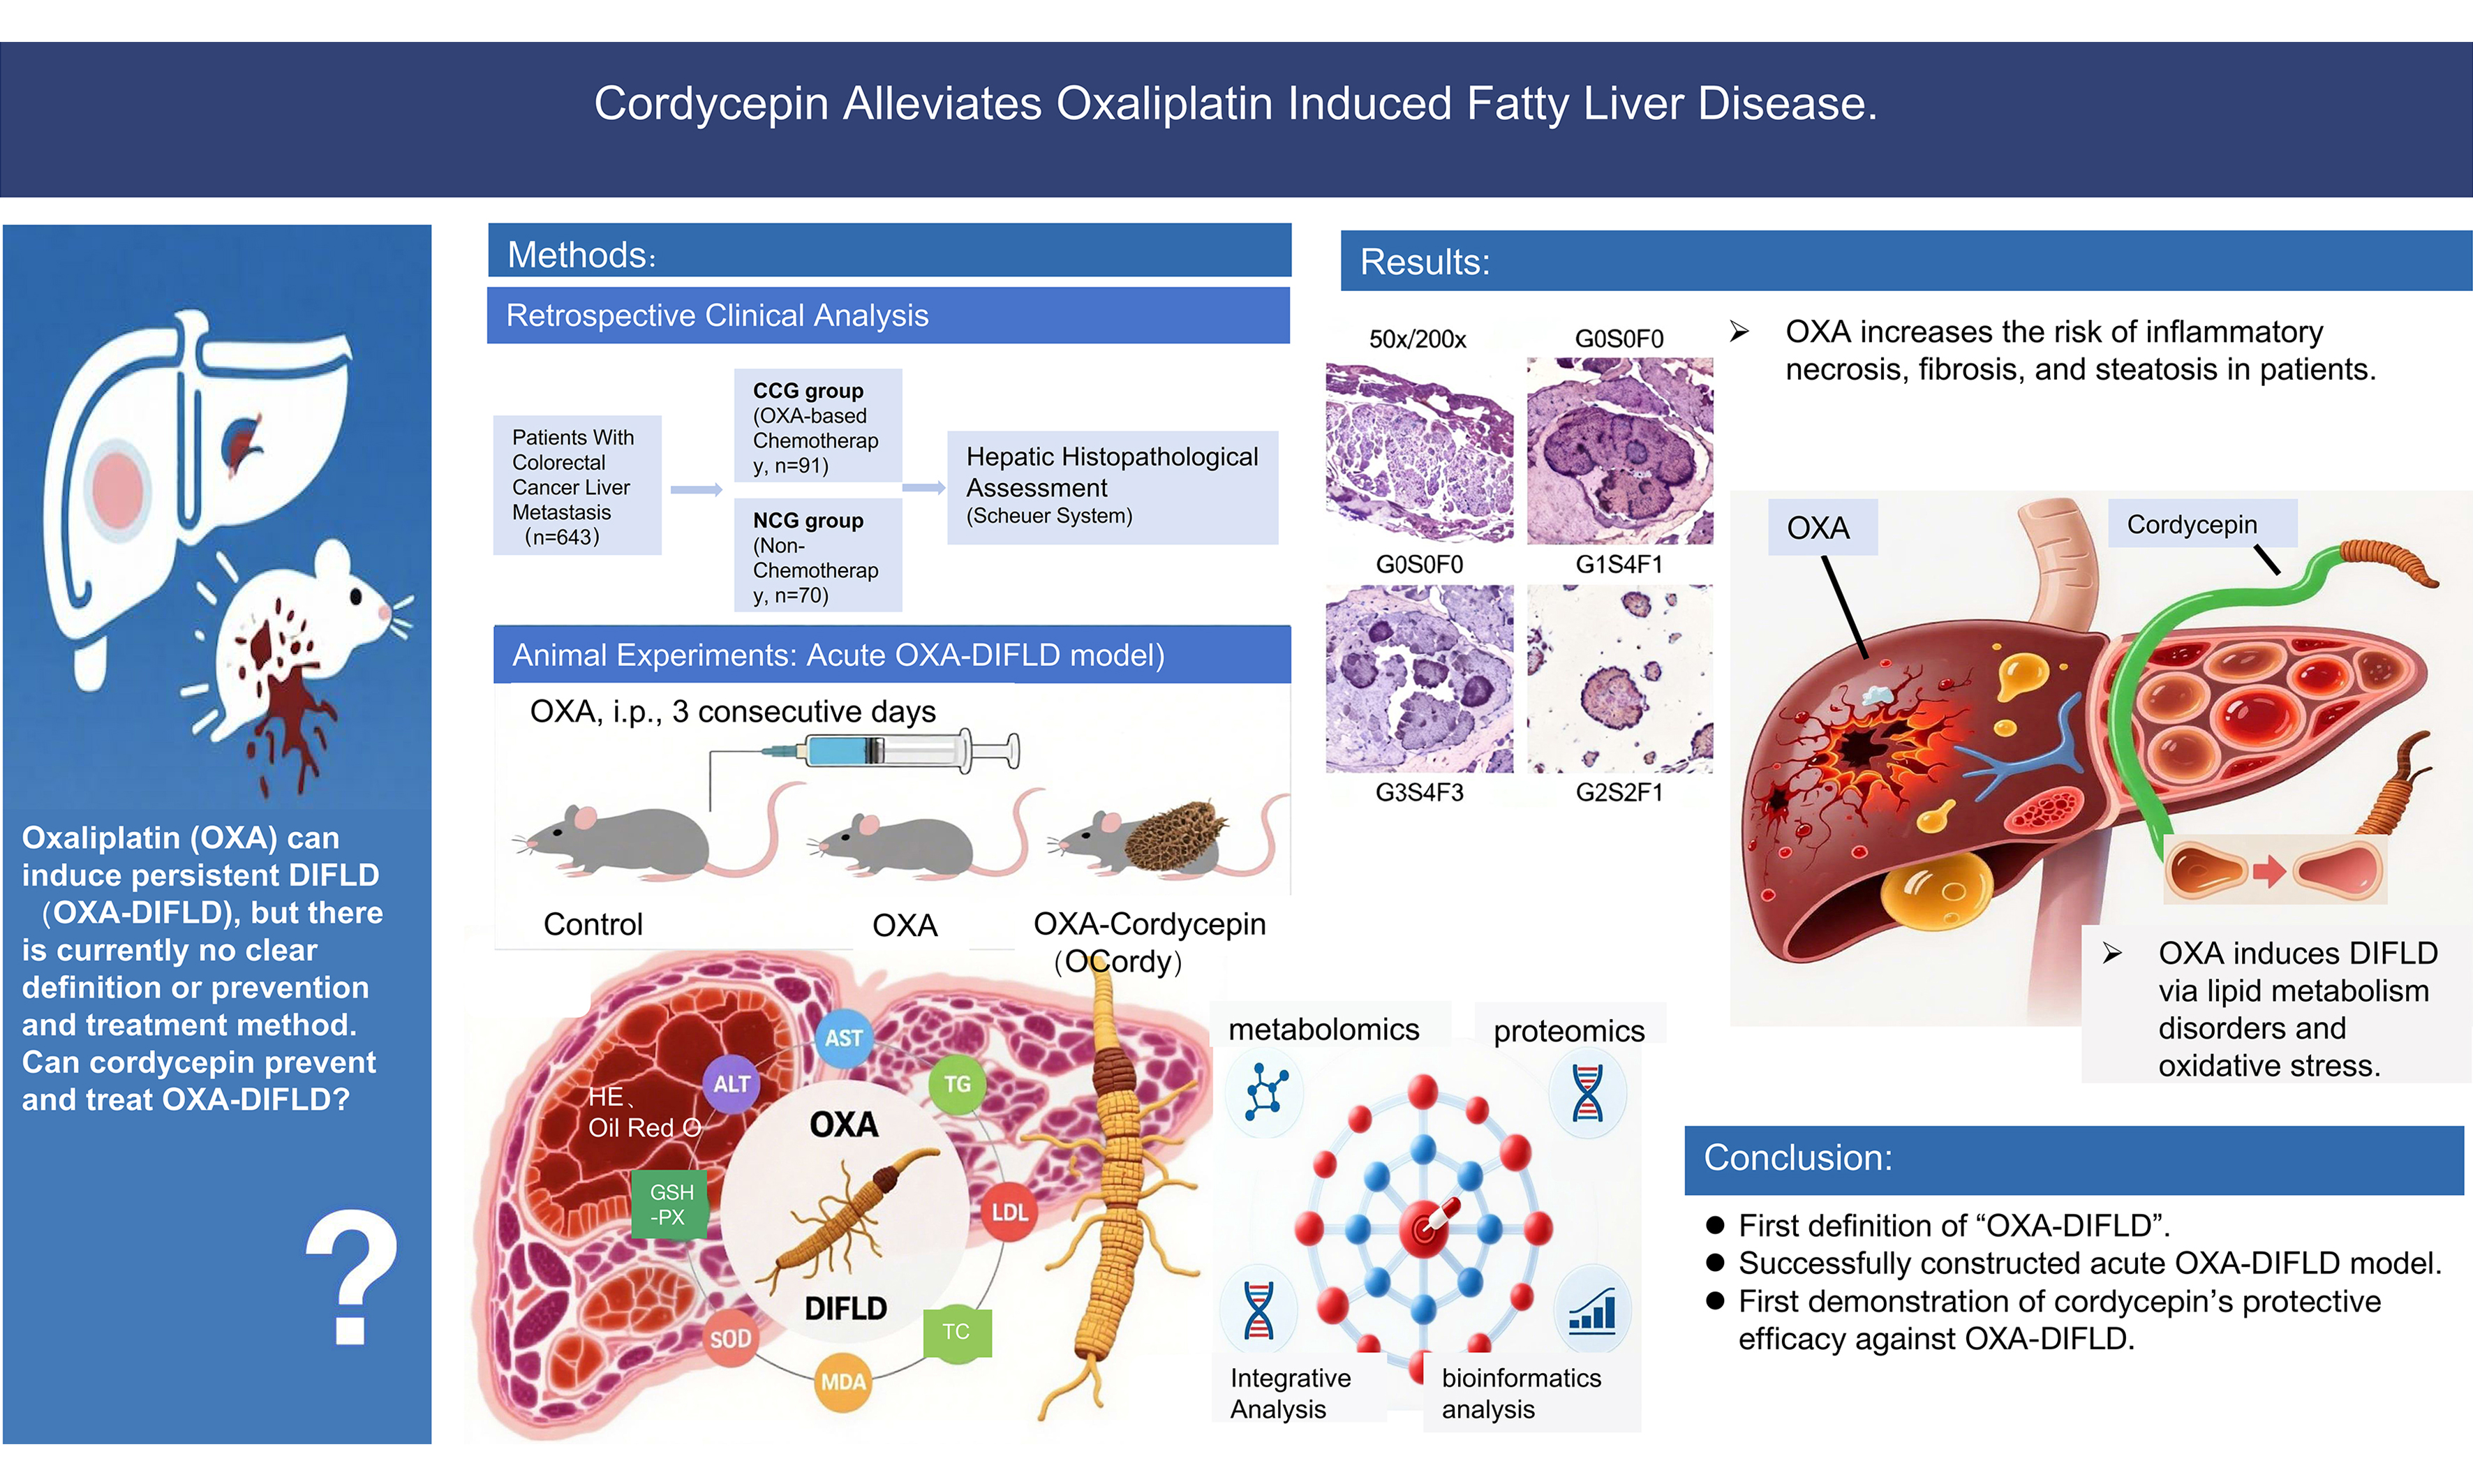
Aim: Oxaliplatin (OXA), a cornerstone chemotherapeutic agent for malignant tumors, can induce hepatic steatosis, inflammation, and fibrosis, meeting the criteria for drug-induced fatty liver disease (DIFLD). However, OXA-induced DIFLD lacks a clear definition and effective interventions. Therefore, our study aimed to verify the OXA-DIFLD link and explore cordycepin’s protective role in DIFLD.
Methods: (1) A retrospective analysis was conducted to compare the degrees of hepatic inflammation, fibrosis, and steatosis among 161 patients with colorectal cancer liver metastasis in the OXA chemotherapy (OCG) and non-chemotherapy (NCG) groups; (2) Fifteen mice were randomly allocated into Control, OXA, and OCordy (OXA + cordycepin) groups. The OXA and OCordy groups received OXA (8 mg/kg, 3 days) injections to induce acute DIFLD; the OCordy group additionally received oral cordycepin (100 mg/kg, 6 days). Liver injury across the three groups was assessed via hepatic pathology, serum biochemical indicators, and oxidative stress markers; (3) Untargeted metabolomics and Data-Independent Acquisition (DIA) proteomics were conducted across the three groups to clarify OXA-induced liver injury mechanisms and pinpoint targets for cordycepin intervention.
Results: (1) Clinical investigations demonstrated markedly elevated hepatic inflammation, fibrosis, and steatosis in the OCG group compared with the NCG group; (2) Animal experiments showed that OXA induced hepatic dysfunction, lipid accumulation, and oxidative stress, which were mitigated by cordycepin; (3) Multi-omics analyses revealed that OXA disrupted lipid metabolism and oxidative stress pathways, whereas cordycepin restored homeostasis by modulating arginine biosynthesis and bile secretion and suppressing α-ketoglutarate levels.
Conclusion: This study characterized OXA-induced DIFLD and validated cordycepin’s protective effects via the α-ketoglutarate-arginine/bile acid axis, offering a foundation for treating OXA-induced liver injury.
Keywords
INTRODUCTION
Drug-induced liver injury (DILI) represents a principal dose-limiting factor in the clinical application of antitumor agents, characterized by multifactorial pathogenesis involving intricate mechanisms and heterogeneous manifestations. Histopathological features may include inflammatory necrosis, cholestasis, hepatocyte steatosis with steatohepatitis-like alterations, vasculitis, and microvascular injury[1,2], whereas clinical phenotypes range from asymptomatic hepatic biochemical abnormalities to acute, subacute, or chronic liver failure[3]. Oxaliplatin (OXA), a key chemotherapeutic agent for diverse malignancies, has garnered increasing attention owing to its hepatotoxic potential. Historically, OXA-associated liver injury was conceptualized as sinusoidal obstruction syndrome (SOS), a vascular-centric pathology[4,5]. However, emerging evidence underscores the capacity of OXA to induce substantial nonvascular hepatic lesions, including hepatocyte steatosis and steatohepatitis[6-8], which persist long after treatment discontinuation[9].
As a distinct DILI subtype, drug-induced fatty liver disease (DIFLD) is defined by aberrant intrahepatocytic lipid accumulation, progressing through steatosis, steatohepatitis, fibrosis, and potential hepatic failure, with dysregulated lipid metabolism and oxidative stress imbalance as central mechanistic drivers[10]. Although OXA-induced steatotic lesions align with DIFLD’s pathological criteria and correlate significantly with increased postoperative complications and reduced survival[11-13], the formal recognition of “OXA-induced DIFLD” remains absent. Notably, the histopathological heterogeneity between OXA-mediated vascular injury and hepatocellular steatosis poses substantial challenges for precise clinical diagnosis and therapeutic stratification.
Our research group has long investigated the mechanisms underlying OXA-associated hepatotoxicity. Prior foundational studies elucidated oxidative-redox imbalance as central to acute OXA-induced liver injury. Subsequent experimentation revealed concomitant hepatocellular fatty degeneration alongside classical oxidative stress responses in acute injury models, suggesting concurrent activation of dual injury pathways (oxidative injury and lipid dysregulation)[14,15]. These findings align with clinical observations: multiple retrospective analyses by Makowiec et al. demonstrated OXA-induced lipid deposition, steatotic transformation, and steatohepatitis in patients with colorectal cancer liver metastasis undergoing neoadjuvant chemotherapy[16-18]. Furthermore, Fernandez et al. identified OXA-associated steatohepatitis as a potential contributor to postoperative morbidity and mortality[11,12]. Morawska et al. documented hepatic metastasis-associated lipid deposition in 30% of OXA-treated patients, with reduced median overall survival [32 months, 95% confidence intervals (CI): 24-60], vs. non-affected counterparts [48 months, 95%CI: 36-not available(NA)][13]. Collectively, OXA causes systemic hepatic lipid metabolic disruption, driving ectopic lipid deposition in hepatocytes and tumor microenvironments, thereby exacerbating clinical outcomes.
Current hepatoprotective agents (e.g., glutathione, bicyclol) primarily target anti-inflammatory, antioxidant, and cytochrome P450 induction pathways[19], lacking specific interventions for lipid dysregulation. This therapeutic gap underscores the urgency of exploring natural compounds with dual antioxidant-lipid-modulatory properties. Cordycepin, a bioactive constituent of Cordyceps sinensis, exhibits validated anti-inflammatory, antioxidant, hypolipidemic, and antifibrotic polypharmacological activities[20-22]. Nevertheless, its protective efficacy and mechanisms against OXA-associated DIFLD remain unexplored.
This study pioneers the systematic evaluation of DIFLD pathogenesis in OXA-induced acute liver injury models and cordycepin’s therapeutic potential, bridging critical knowledge gaps in targeted DIFLD management and informs novel hepatoprotective strategies.
METHODS
Ethical statement and patient consent
The study protocol was approved by the Science and Technology Ethical Review Committee of Guangxi Medical University Cancer Hospital (Approval No. KY2025683). This study was conducted in accordance with the Declaration of Helsinki and Regulations Governing Laboratory Animals. For the clinical retrospective study, all patients provided written informed consent for the collection and use of their clinical data and biological samples for scientific research purposes prior to treatment initiation (Informed Consent Form for the Collection of Human Genetic Resources of Guangxi Medical University Cancer Hospital). For animal experiments, all procedures were conducted in accordance with the guidelines for the care and use of laboratory animals and approved by the same ethics committee (Approval No. KY2025683).
Clinical retrospective study
Clinicopathological data and peritumoral hepatic histology were collected from 643 patients with colorectal cancer liver metastasis who underwent curative resection at Guangxi Medical University Cancer Hospital between November 1, 2017, and August 31, 2025. Following screening, 161 patients were enrolled [Figure 1A]. Participants were stratified into OXA chemotherapy (OCG) and non-chemotherapy (NCG) cohorts based on preoperative treatment history.
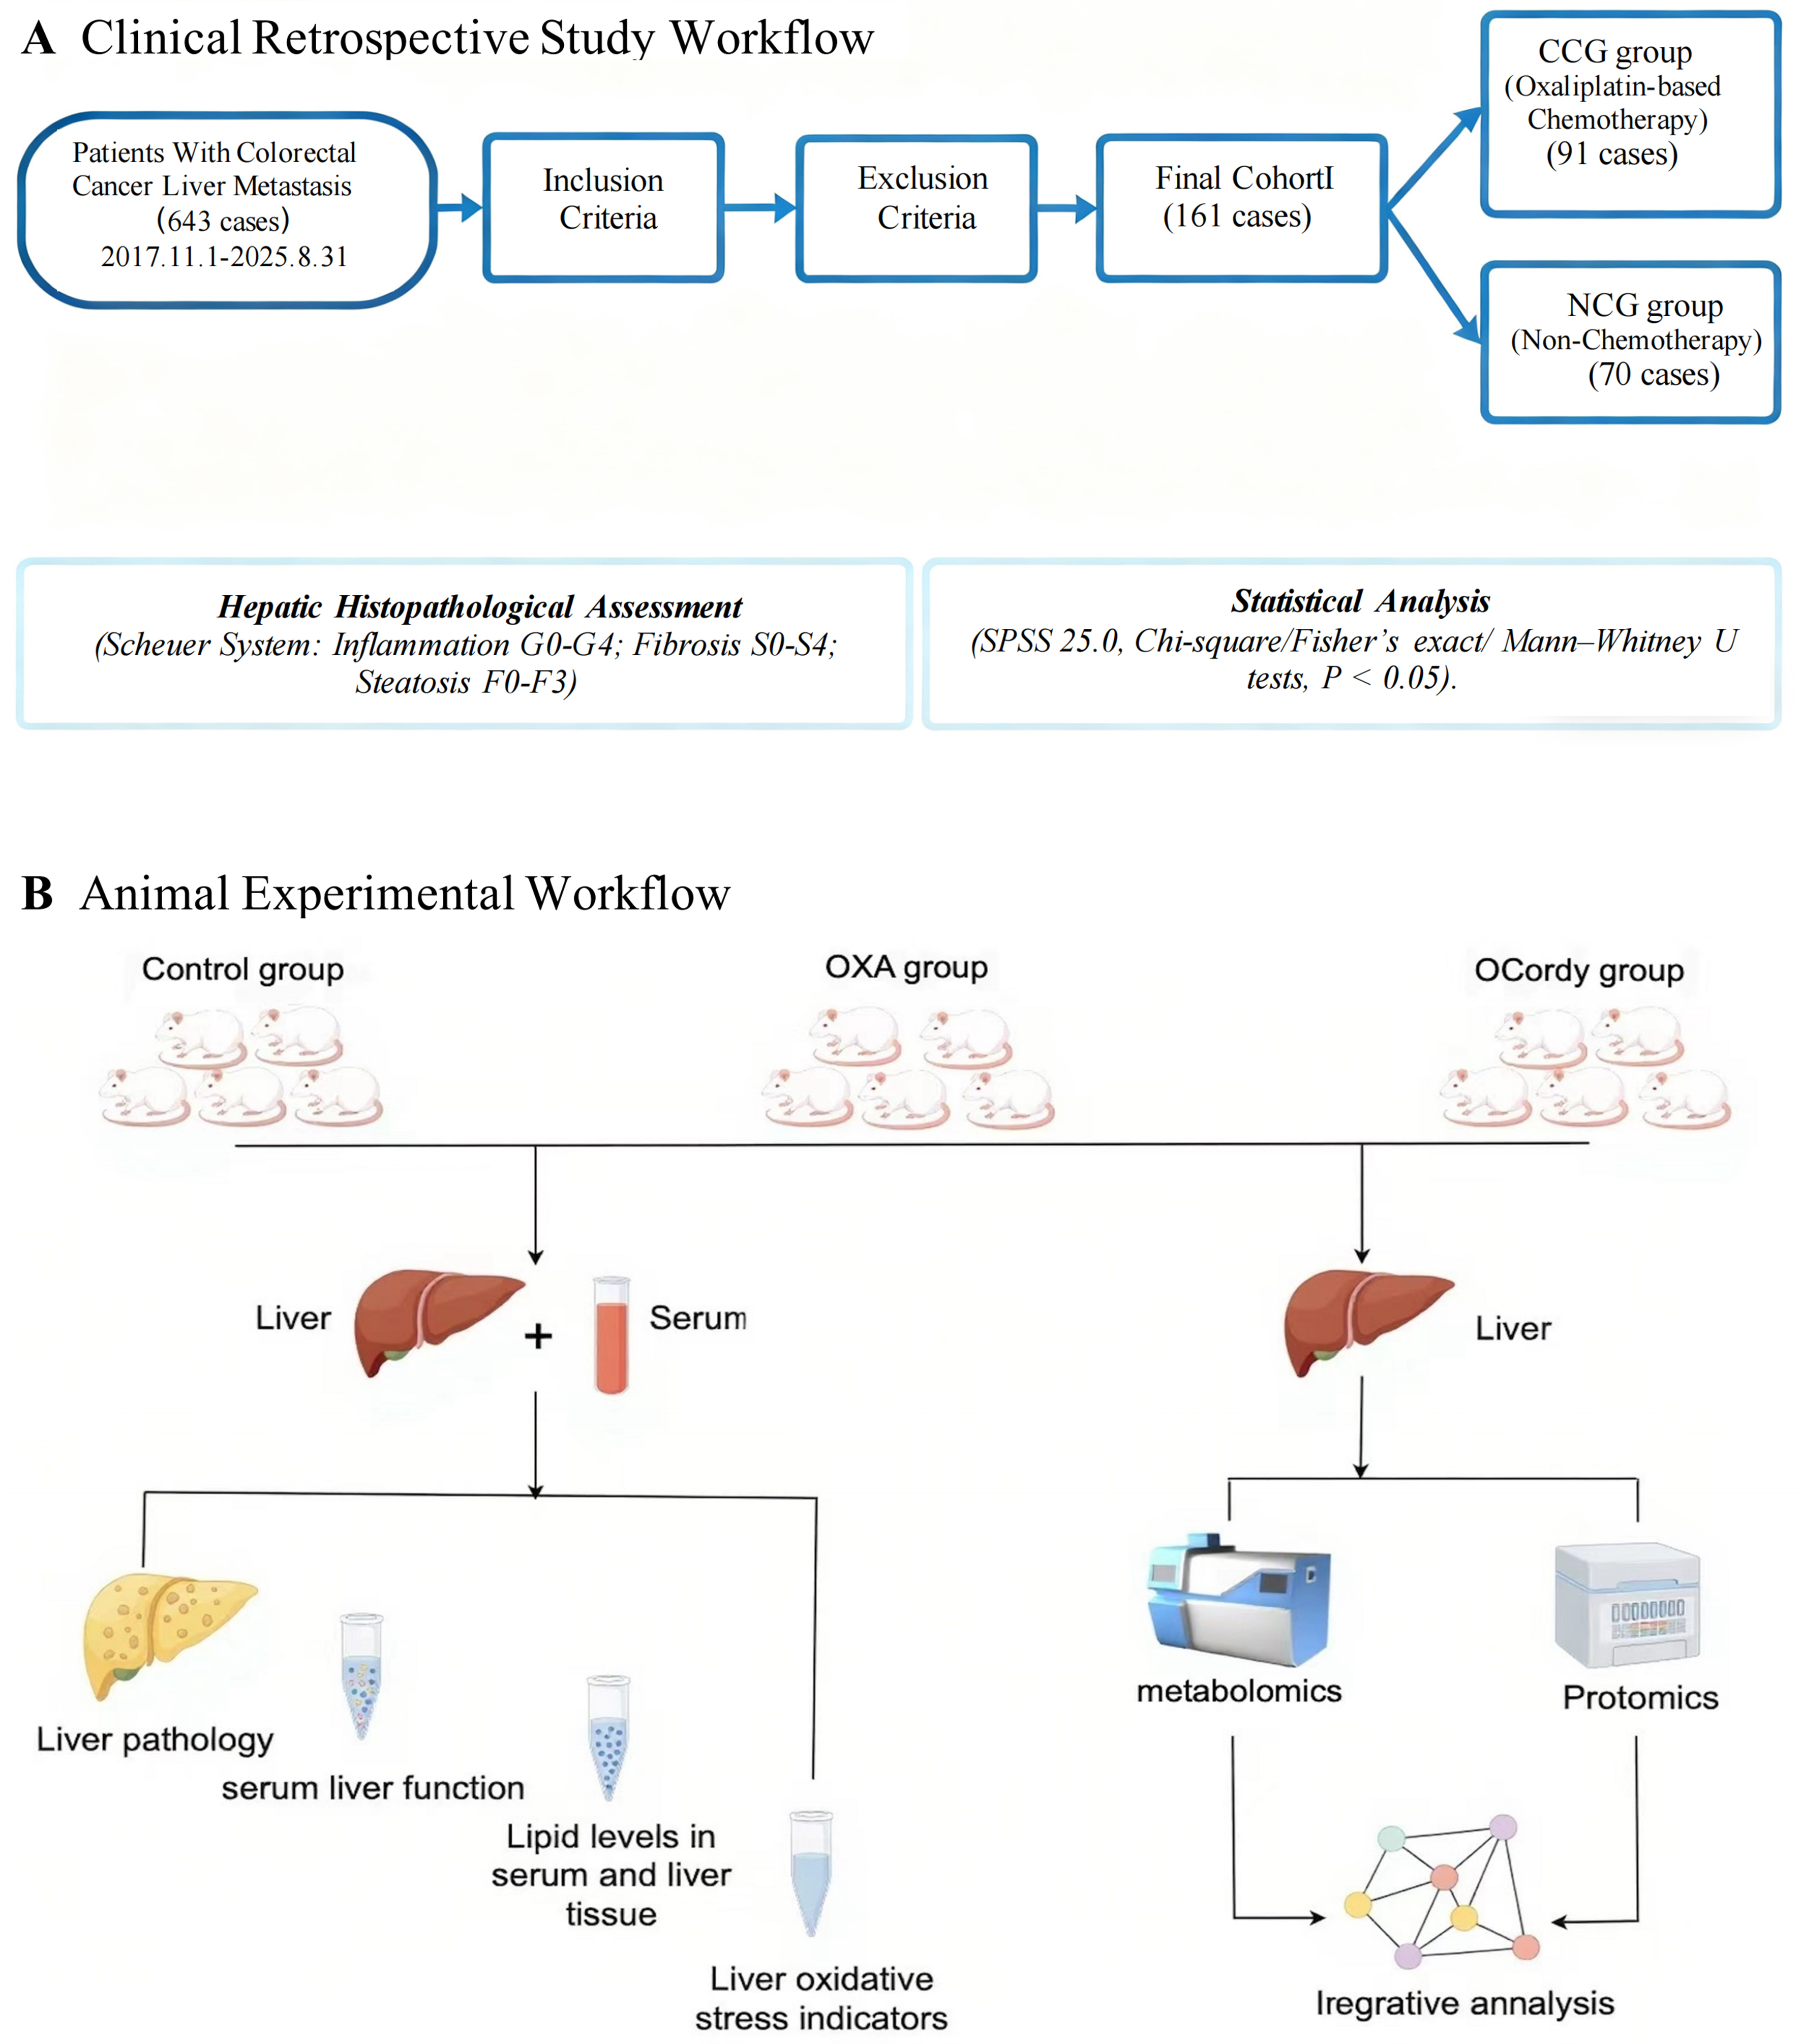
Figure 1. Detailed Experimental Procedure of this Study. (A) Clinical Retrospective Study Workflow. Clinical retrospective analysis comparing the degrees of hepatic inflammation, fibrosis, and steatosis among 161 colorectal cancer liver metastasis patients in the OCG and NCG groups; (B) Animal Experimental Workflow. Mice were randomized into Control, OXA, and OCordy groups. Acute DIFLD was induced by OXA injection, with cordycepin administered orally. Liver injury was evaluated via histopathology, serum biochemistry, oxidative stress markers, and integrated metabolomics and proteomics to elucidate therapeutic mechanisms. CCG: Chemotherapy group; OCG: Oxaliplatin chemotherapy group; NCG: Non-chemotherapy group; OXA: Oxaliplatin; OCordy: Oxaliplatin plus cordycepin; CRC: colorectal cancer; CRLM: colorectal cancer liver metastasis; DIFLD: drug-induced fatty liver disease; SPSS: Statistical Package for the Social Sciences.
Inclusion and exclusion criteria
Inclusion Criteria: Pathologically confirmed colorectal adenocarcinoma with radiologically and histologically verified liver metastases; complete preoperative records of OXA-based regimens or absence of antitumor therapy; no concurrent malignancy; sufficient non-neoplastic hepatic tissue for pathological evaluation; and absence of cardiopulmonary/vascular disorders or related medications.
Exclusion Criteria: Prior transarterial chemoembolization, radiofrequency ablation, radiotherapy, immune checkpoint inhibitors, or targeted therapy within 12 months; preexisting chronic hepatopathy (viral hepatitis, fatty liver, clonorchiasis); diabetes, hypertension, cardiovascular disease, metabolic syndrome, or related pharmacotherapy; alcohol/tobacco use or raw meat consumption; and irinotecan-containing or multiagent OXA-based regimens.
Hepatic histopathological grading
Liver injury was assessed using the Scheuer scoring system [Table 1], with necroinflammatory activity graded (G0-G4) and fibrosis staged (S0-S4)[23]. Steatosis was graded using a semiquantitative scale (F0-F3)[10].
Detailed scoring criteria for liver histopathology
| Scheuer system | ||
| Simple system for scoring necroinflammatory activity in chronic hepatitis | ||
| Grade | Portal/periportal activity | Lobular activity |
| Grade 0 (G0) | None or minimal | None |
| Grade 1 (G1) | Portal inflammation (CPH) | Inflammation but no necrosis |
| Grade 2 (G2) | Mild piecemeal necrosis (mild САН) | Focal necrosis or acidophil bodies |
| Grade 3 (G3) | Moderate piecemeal necrosis (moderate CAH) | Severe focal cell damage |
| Grade 4 (G4) | Severe piecemeal necrosis (severe CAH) | Damage includes bridging necrosis |
| A scoring system for fibrosis and cirrhosist grade | ||
| Grade | Fibrosis | |
| Grade 0 (S0) | None | |
| Grade 1 (S1) | Enlarged, fibrotic portal tracts | |
| Grade 2 (S2) | Periportal or portal-portal septa but intact architecture | |
| Grade 3 (S3) | Fibrosis with architectural distortion but no obvious cirrhosis | |
| Grade 4 (S4) | Probable or definite cirrhosis | |
| Scoring of the degree of steatosis in human liver biopsies | ||
| Grade 0 (F0) | The appearance of the liver is normal, with no steatosis and no obvious fat accumulation within the liver cells | |
| Grade 1 (F1) | Mild steatosis, with a small amount of fat accumulation, affecting between 5%-33% of hepatocytes typically | |
| Grade 2 (F2) | Moderate steatosis, with a moderate amount of fat accumulation, affecting 34%-66% of hepatocytes typically | |
| Grade 3 (F3) | Severe steatosis, with a significant amount of fat accumulation within the hepatocytes, and > 66% of them affected | |
Statistical analysis
Data were analyzed using SPSS 25.0. Intergroup histopathological differences were assessed via chi-square, Fisher’s exact, and Mann-Whitney U tests (significance P < 0.05).
Animal experiments
Materials
Cordycepin (CAS 73-03-0; C10H13N5O3; MW 251.24) was purchased from Sichuan Weikeqi Biotechnology Co., Ltd. (Sichuan, China; batch No. WP24040313). Fifteen 8-week-old female BALB/c mice (20 ± 2 g) were obtained from Spelford Biotechnology Co., Ltd. [Beijing, China, license SCXK (Jing 2024-0001)].
Solution preparation
OXA Solution: OXA solution was prepared immediately before use by mixing OXA with 5% glucose solution, having a final total concentration of 0.8 mg/mL.
Carboxymethyl Cellulose Sodium Solution: Carboxymethyl cellulose sodium (CMC-Na) powder (0.5 g) was dissolved in 100 mL of ultrapure water to produce a 0.5% CMC-Na solution.
Cordycepin Solution: Cordycepin powder was dissolved in 0.5% CMC-Na solution to prepare a 100 mg/mL suspension.
In vivo experiments
Fifteen mice were randomly allocated into three groups (five per group): control, OXA (acute DIFLD mouse model), and OCordy (OXA + cordycepin). The OXA and OCordy groups received a daily intraperitoneal injection of 8 mg/kg OXA for three consecutive days (1-3 days), whereas the control group was administered an equivalent volume of 5% glucose solution over the same period. Concurrently, the OCordy group was orally administered 100 mg/kg cordycepin for 6 days (0-5 days), whereas the other two groups received an equivalent volume of CMC-Na solution via gavage during the same timeframe. Throughout the experimental period, the fur luster, activity levels, food intake, and defecation patterns of the mice were monitored daily, and their body weights were recorded. On day 6, blood samples (0.5 mL) were collected via retro-orbital sinus puncture, the liver weights of the mice were measured, and the liver index was calculated (liver index = liver weight/body weight × 100%). Hepatic pathological alterations were examined through hematoxylin and eosin (HE) and Oil Red O staining. The serum levels of alanine aminotransferase (ALT), aspartate aminotransferase (AST), hepatic and serum lipid profiles [triglycerides (TG), total cholesterol (TC), and low-density lipoprotein (LDL)], and oxidative stress markers [superoxide dismutase (SOD), malondialdehyde (MDA), and glutathione peroxidase (GSH-PX)] were assessed.
Data are expressed as mean ± standard deviation. An independent samples t-test was used to compare two groups (Control vs. OXA, OXA vs. OCordy, Control vs. OCordy), and one-way Analysis of Variance was applied for multiple groups. Statistical significance was set at P < 0.05. GraphPad Prism 8.0 was used for data visualization.
Non-targeted metabolomics
Liver tissues from the three mouse groups were homogenized in 50% methanol/water containing internal standards via freeze-grinding and ultrasonic extraction. Quality control (QC) samples were prepared by pooling equal volumes of each extract. Metabolite profiling was performed using a Ultra-High Performance Liquid Chromatography-Q Exactive HF-X system (Thermo Fisher Scientific, Waltham, MA, USA). Raw Liquid Chromatography-Mass Spectrometry data were processed with Progenesis Quantitative Insights to generate a data matrix, which was matched against the Human Metabolome Database and the METLIN metabolite database. The resulting data were uploaded to the Majorbio Cloud Platform for analysis. Partial least squares discriminant analysis (PLS-DA) was performed using the ropls package in R. Differential metabolites (DMs) were identified using Student’s t-test [fold change (FC) > 1.5 or < 0.67, P < 0.05] and variable importance in projection (VIP) scores > 1 from PLS-DA. Mfuzz clustering revealed DM expression patterns across groups. Pathway enrichment analysis was performed using Kyoto Encyclopedia of Genes and Genomes (KEGG) pathway annotations and Fisher’s exact test (P < 0.05).
DIA-based proteomics
Liver tissues from three mouse groups were lysed and centrifuged, with protein concentrations determined using the bicinchoninic acid assay. Following tryptic digestion, peptides were desalted and quantified. DIA mass spectrometry was performed using a Vanquish Neo coupled with an Orbitrap Astral system (Thermo Fisher Scientific). Data were processed with Spectronaut 19 and uploaded to the Majorbio Cloud Platform. Sample correlations were visualized as heatmaps using R, and intergroup differences were assessed using principal component analysis (PCA). Differentially expressed proteins (DEPs) were identified using t-test (FC > 1.5 or < 1/1.5, P < 0.05) and visualized via volcano plots, Venn diagrams, and cluster heatmaps. Temporal expression patterns were analyzed using Mfuzz, followed by Gene Ontology (GO) and KEGG pathway enrichment. A protein-protein interaction network was constructed to identify key proteins.
Integrative analysis of DIA proteomics and non-targeted metabolomics data
To integrate DEPs and DMs, we performed KEGG enrichment and network analyses. A two-way orthogonal partial least squares (O2PLS) model was applied to assess proteomic-metabolomic correlations, generating joint score and loading plots to identify core molecules. Analyses were conducted using OmicsPLS and visualized with ggplot2. Venn diagrams were constructed to identify overlapping KEGG pathways between the OCordy and OXA groups. The top ten enriched pathways were visualized, and Fisher’s exact test was used to evaluate joint pathway enrichment. Pathway maps were annotated with relevant DEPs and DMs. Finally, a correlation network was constructed based on Pearson correlation coefficients. The animal experimental workflow is illustrated in Figure 1B.
RESULTS
Retrospective clinical analysis
Cohort characteristics
Among the 161 analyzed patients, 91 and 70 were in the OCG and NCG groups, respectively. Significant differences in sex and body mass index (BMI) were observed between the groups (P < 0.05), with the NCG showing a higher BMI [Table 2].
General information of patients in the non-chemotherapy group (NCG group) and oxaliplatin chemotherapy group (OCG group)
| OCG group | NCG group | P value | ||
| Gender | Male | 41 | 26 | < 0.001 |
| Female | 50 | 44 | ||
| Age (years) | 59.2 ± 12.6 | 57.0 ± 9.6 | 0.185 | |
| BMI (kg/m2) | 22.35 ± 3.17 | 23.30 ± 2.85 | 0.013 | |
Histopathological features in OCG
Among 91 OCG patients, 75 (82.42%) demonstrated ≥ 1 hepatic alteration(s) (inflammatory necrosis, fibrosis, and steatosis). These included inflammatory necrosis (63.7%; G1:29, G2:29), fibrosis (25.3%; S1:9, S2:9, S3:2, S4:3), and steatosis (35.2%; F1:23, F2:8, F3:1; Figure 2).
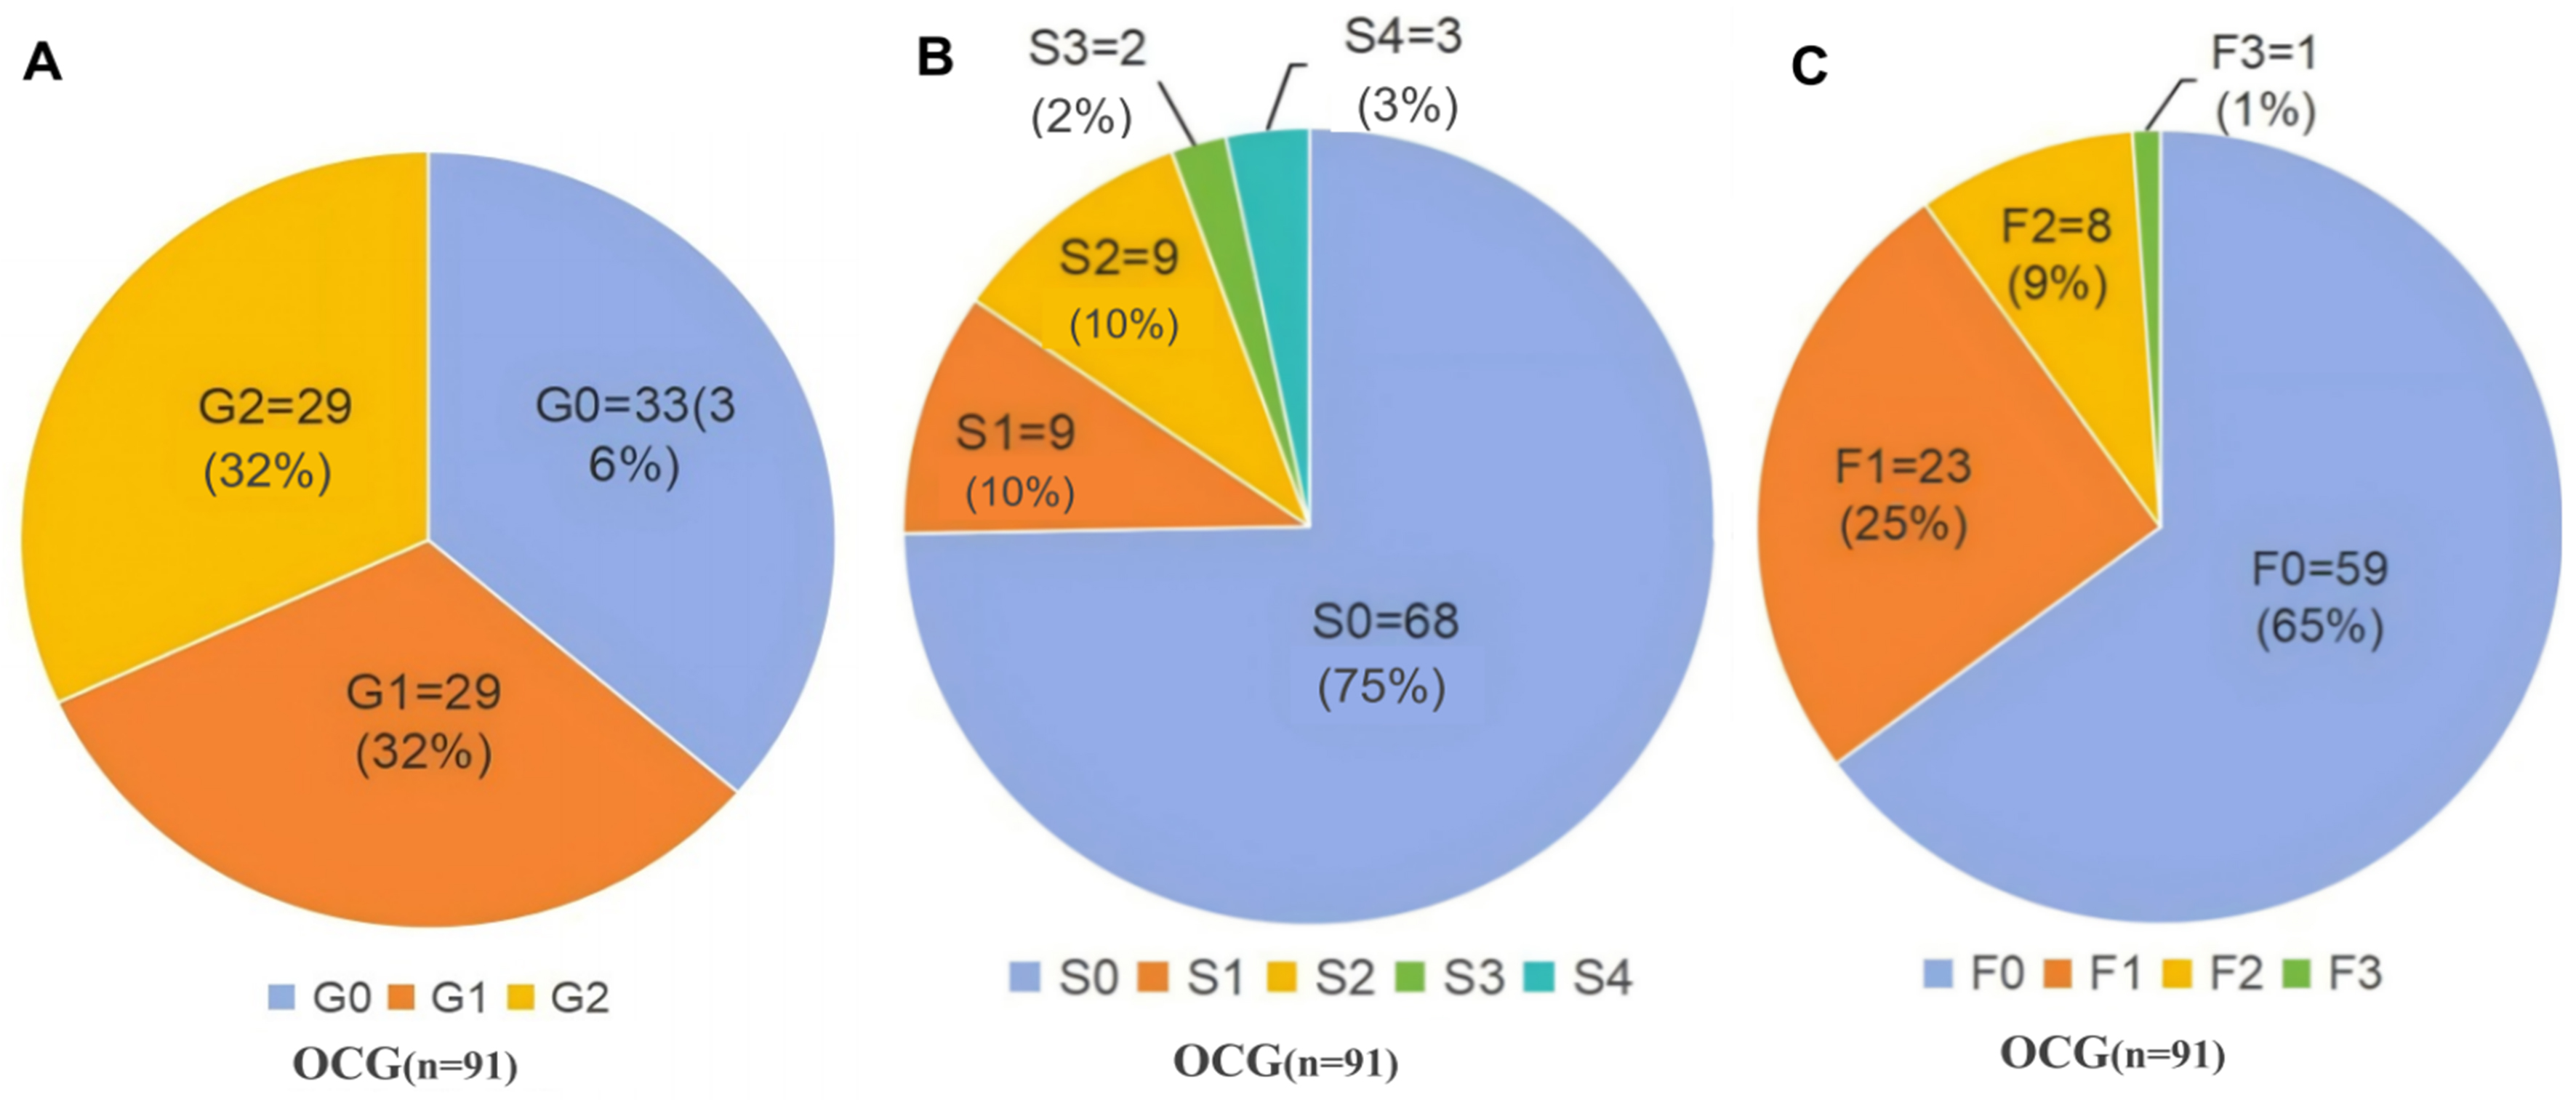
Figure 2. Pathological Changes in the Non-Tumor Liver Tissues of 91 Patients Undergoing OCG. (A) Grading of hepatitis necrosis severity; (B) Staging of hepatic fibrosis; (C) Classification of hepatic steatosis. OCG: Oxaliplatin-based chemotherapy group; G: grade of hepatic inflammation (G0-G2); S: stage of hepatic fibrosis (S0-S4); F: grade of hepatic steatosis (F0-F3); n: number of patients.
Comparative histopathological scoring between NCG and OCG
Inflammatory Necrosis (Grading): The NCG predominantly exhibited G0 (78.57%), compared with a significantly lower G0 prevalence in the OCG (36.27%; P < 0.001). The OCG showed higher incidences of G1 (31.87% vs. 5.71%; P < 0.001) and G2 (31.87% vs. 14.29%; P = 0.01) [Figure 3 and Supplementary Table 1].
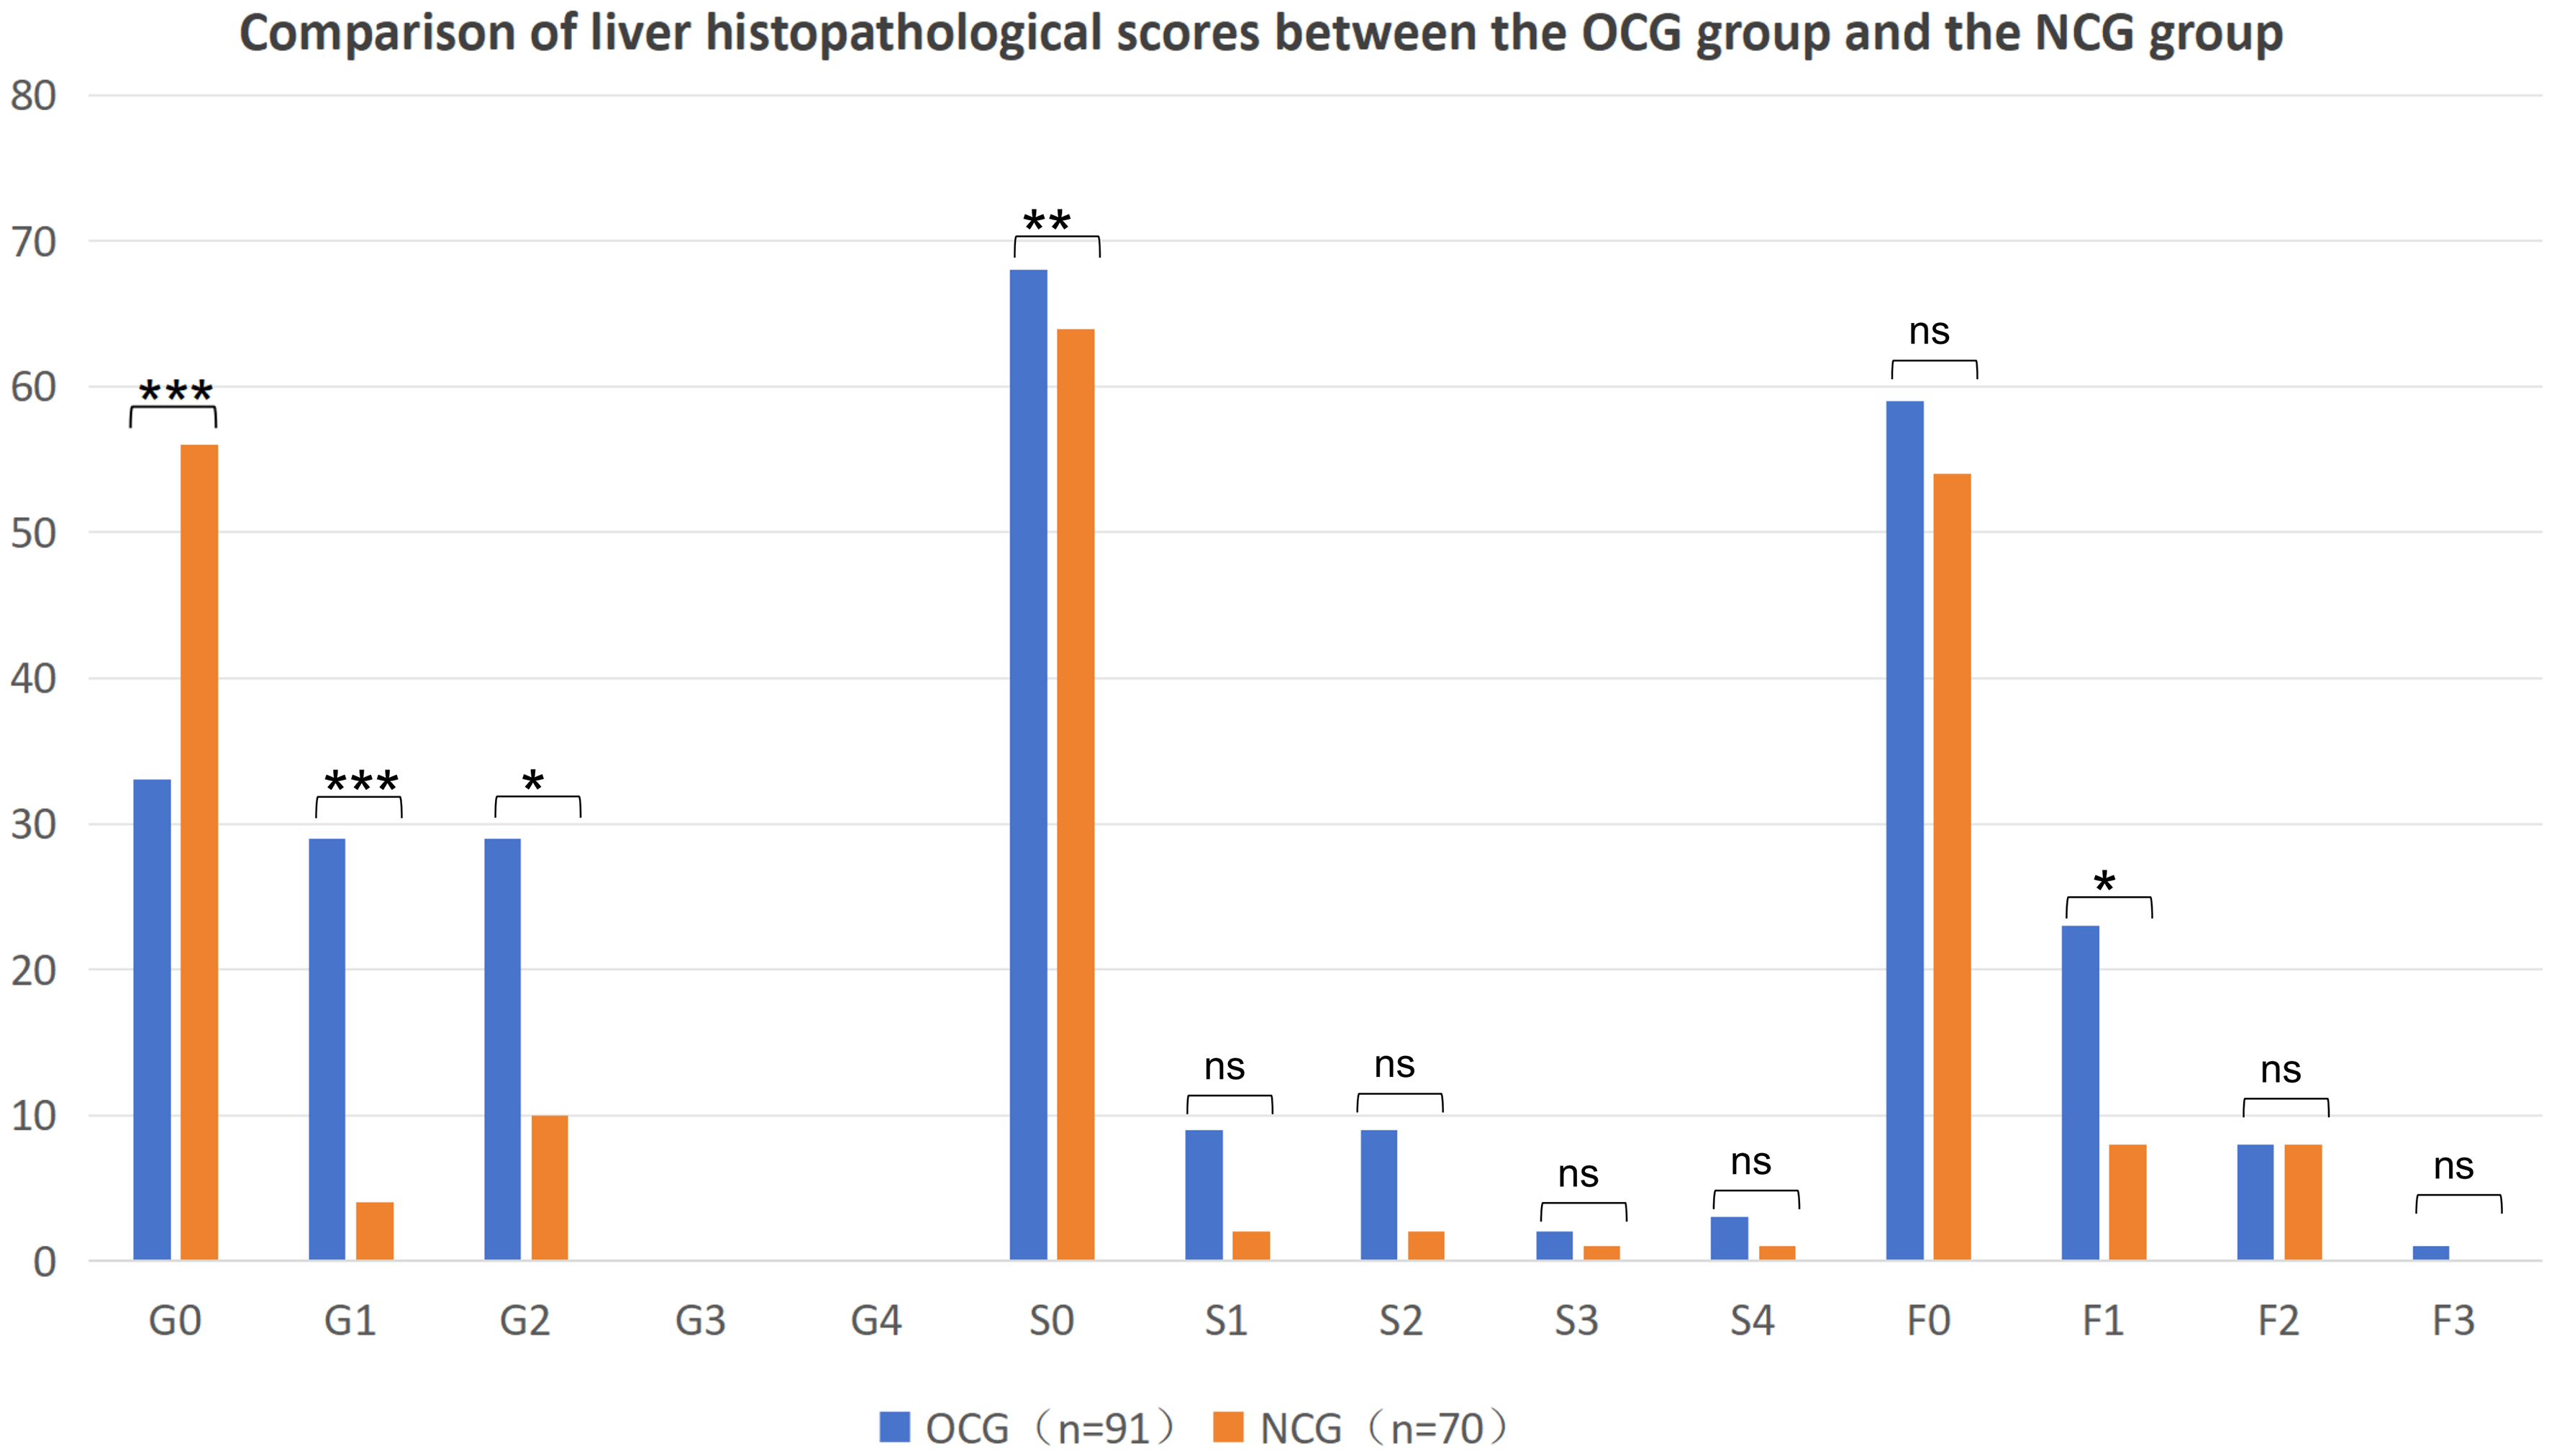
Figure 3. Comparison of Histopathological Changes in the Non-Tumor Liver Tissues between the OCG (n = 91) and NCG (n = 70) Groups. (Note: Statistical methods: Chi-squared test. *P < 0.05; **P < 0.01; ***P < 0.001). OCG: Oxaliplatin-based chemotherapy group; NCG: Non-chemotherapy group; G: grade of hepatic inflammation (G0-G4); S: stage of hepatic fibrosis (S0-S4); F: grade of hepatic steatosis (F0-F2); n: number of patients; ns: not significant.
Fibrosis Staging: S0 predominated in the NCG (91.43%) vs. the OCG (74.73%; P = 0.006). Higher S1-S4 frequencies in the OCG lacked statistical significance (S1: 9.89% vs. 2.86%, P = 0.15; S2: 9.89% vs. 2.86%, P = 0.15; S3: 2.20% vs. 1.43%, P = 1; S4: 3.30% vs. 1.43%, P = 0.807; Figure 3 and Supplementary Table 1).
Steatosis Grading: F0 prevalence decreased in OCG (64.84% vs. 87.14%; P = 0.091), with significantly higher F1 (25.27% vs. 11.43%; P = 0.027) and marginal F3 elevation (1.10% vs. 0%; P = 0.565) [Figure 3 and Supplementary Table 1]. HE-stained hepatic histology is illustrated in Figure 4.
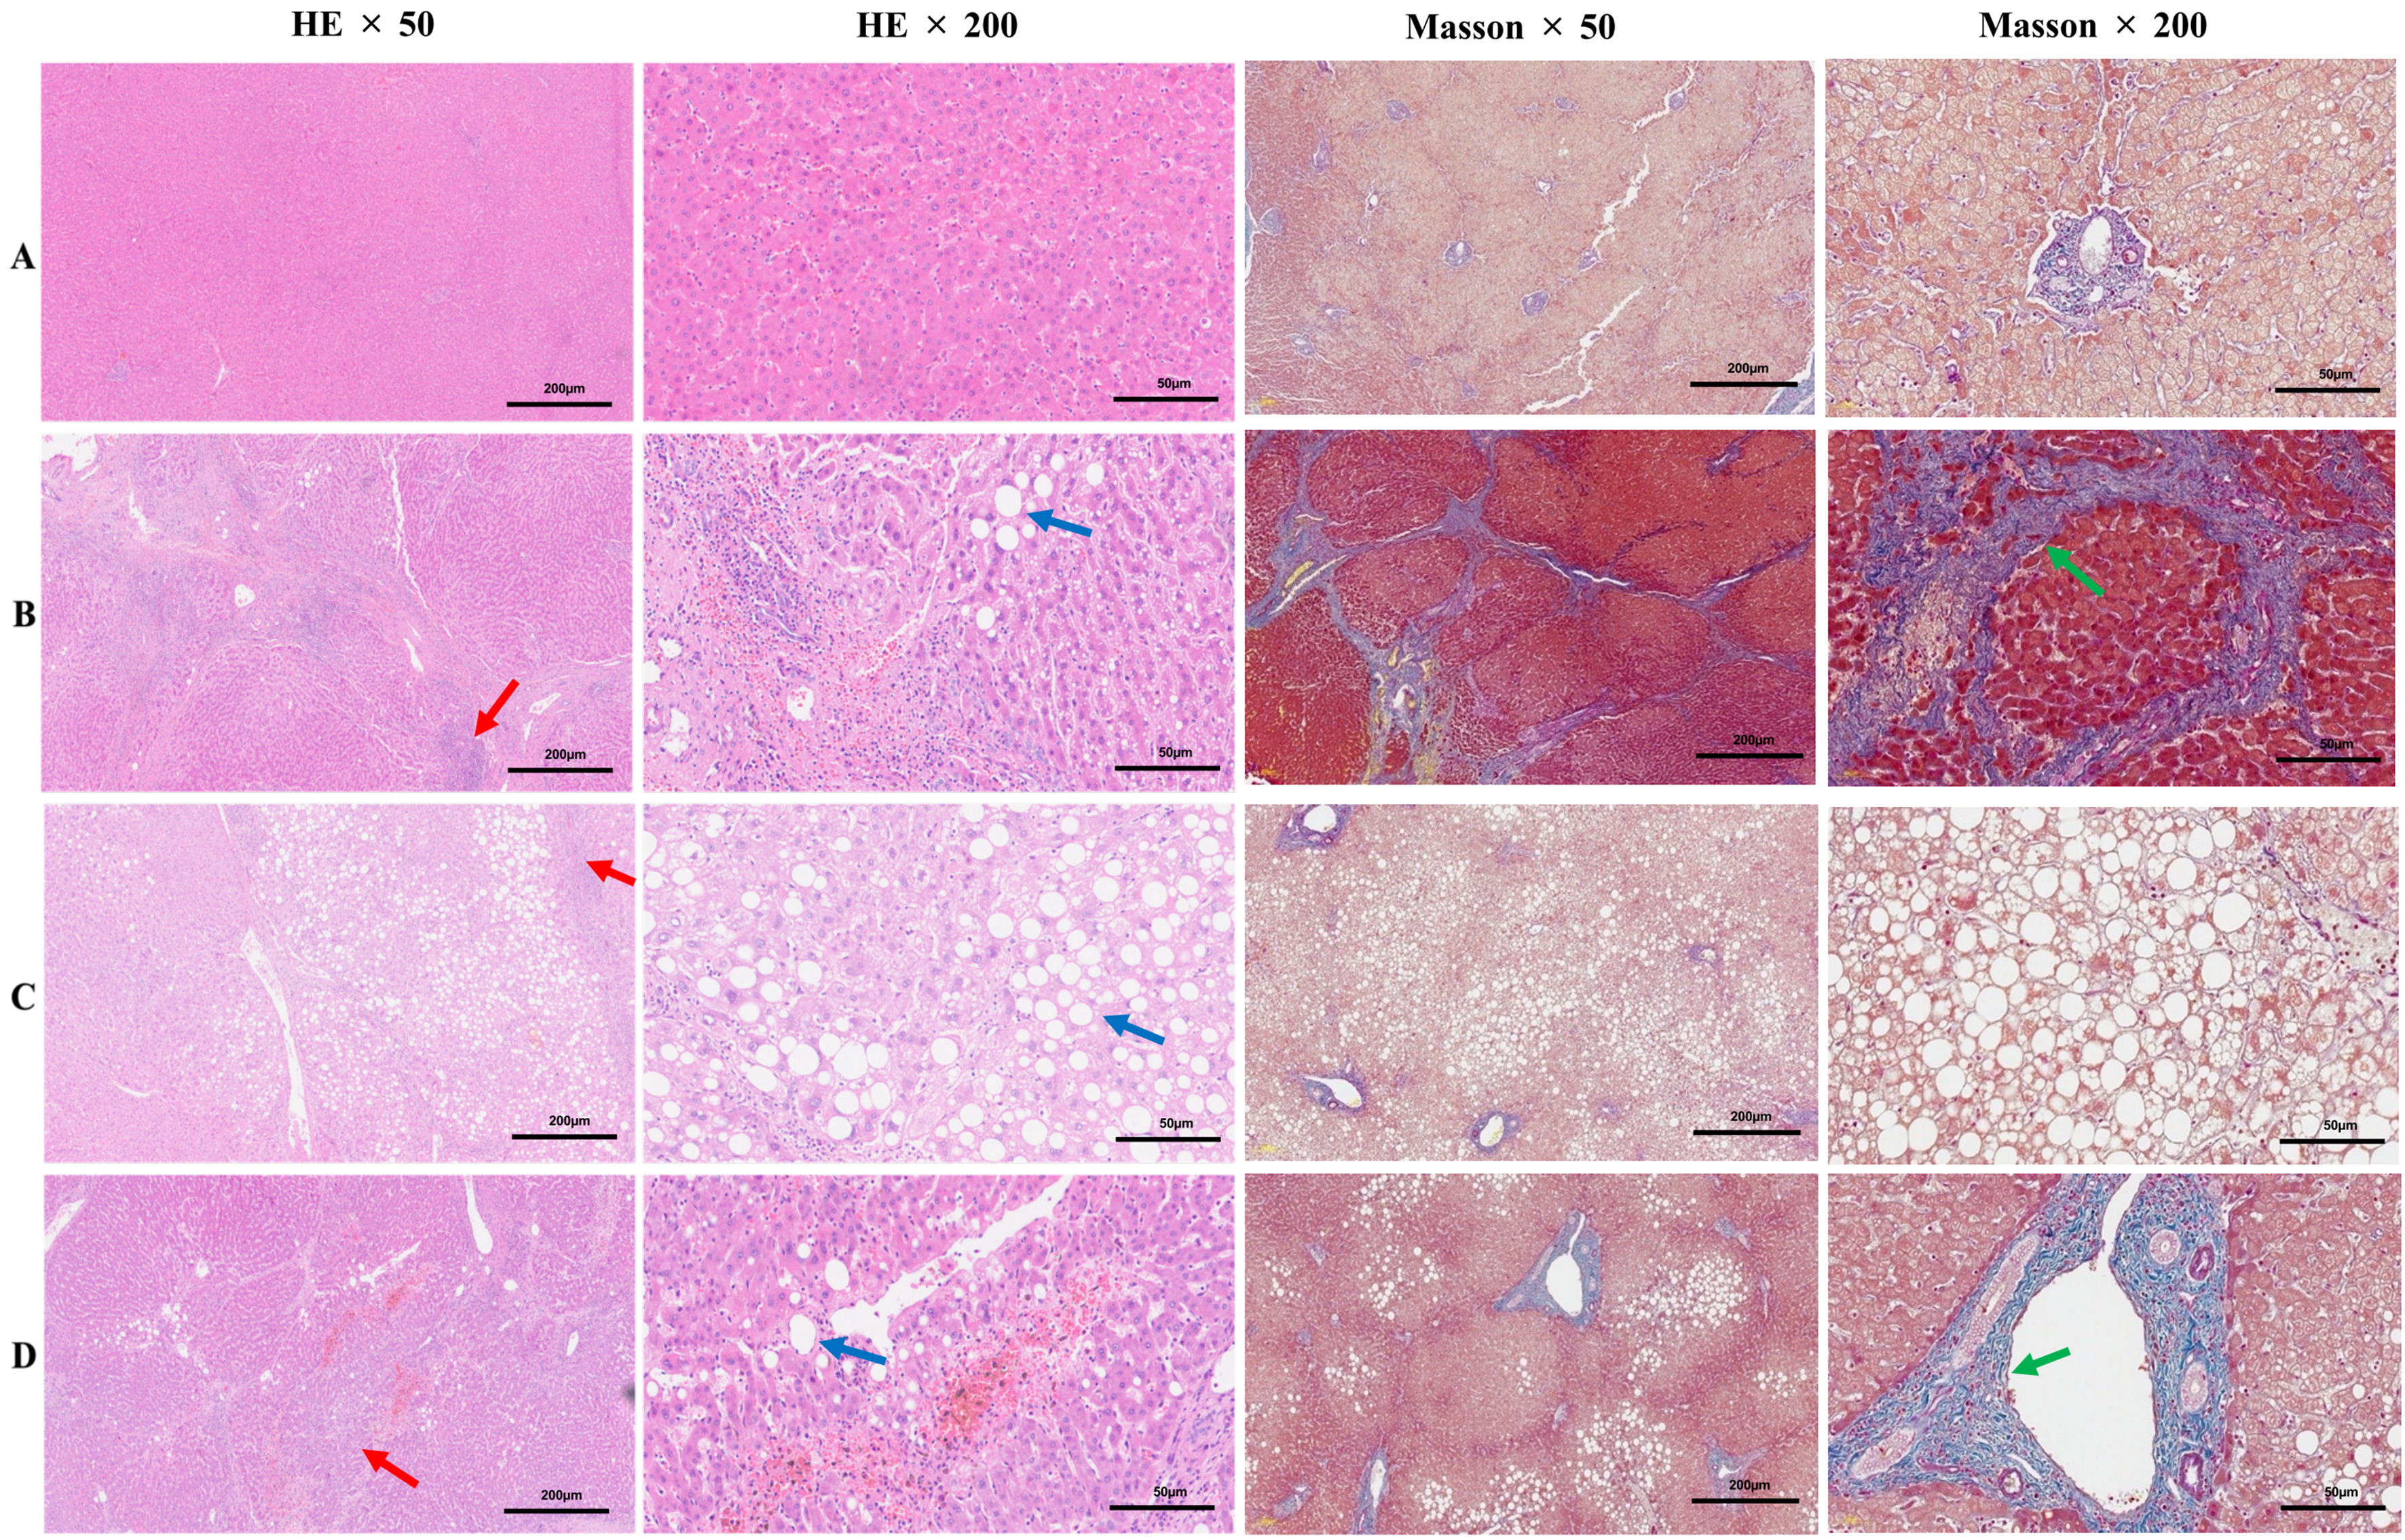
Figure 4. Representative hepatic histopathological stained with HE and Masson’s trichrome. (A) (NCG group): Normal hepatic tissue showing no evidence of inflammation, fibrosis, or steatosis (G0S0F0); (B) (OCG group): Severe inflammatory infiltration and extensive fibrosis (G3S4), with mild steatosis (F1); (C) (OCG group): Marked macrovesicular steatosis (F3), with minimal inflammatory changes (G1S0); (D) (OCG group): Moderate inflammatory activity and fibrosis (G2S2), with mild steatosis (F1). (Note: The first and third panels on the left: ×50 magnification; the second and fourth panels on the left: ×200 magnification; red arrow: inflammatory changes; blue arrow: steatosis; green arrow: fibrosis). HE: Hematoxylin and eosin; NCG: Non-chemotherapy group; OCG: Oxaliplatin-based chemotherapy group; G: grade of hepatic inflammation (G0-G3); S: stage of hepatic fibrosis (S0-S4); F: grade of hepatic steatosis (F0-F3).
Animal experiments
General conditions and liver index of mice
During the experimental process, mice in the control group remained in good condition, with normal activity and food intake, a glossy coat, and relatively stable body weight. Mice in the OXA group began to show deterioration 2 days after OXA administration, including disheveled fur, decreased activity, reduced appetite, and weight loss; these symptoms gradually worsened over time. Similarly, mice in the OCordy group exhibited these symptoms 2 days after OXA administration, but to a lesser extent than those in the OXA group [Figure 5A]. The liver index in the OXA group was significantly higher than that in the control group (P < 0.01; Figure 5B), whereas it was significantly lower in the OCordy group than in the OXA group (P < 0.01; Figure 5B).
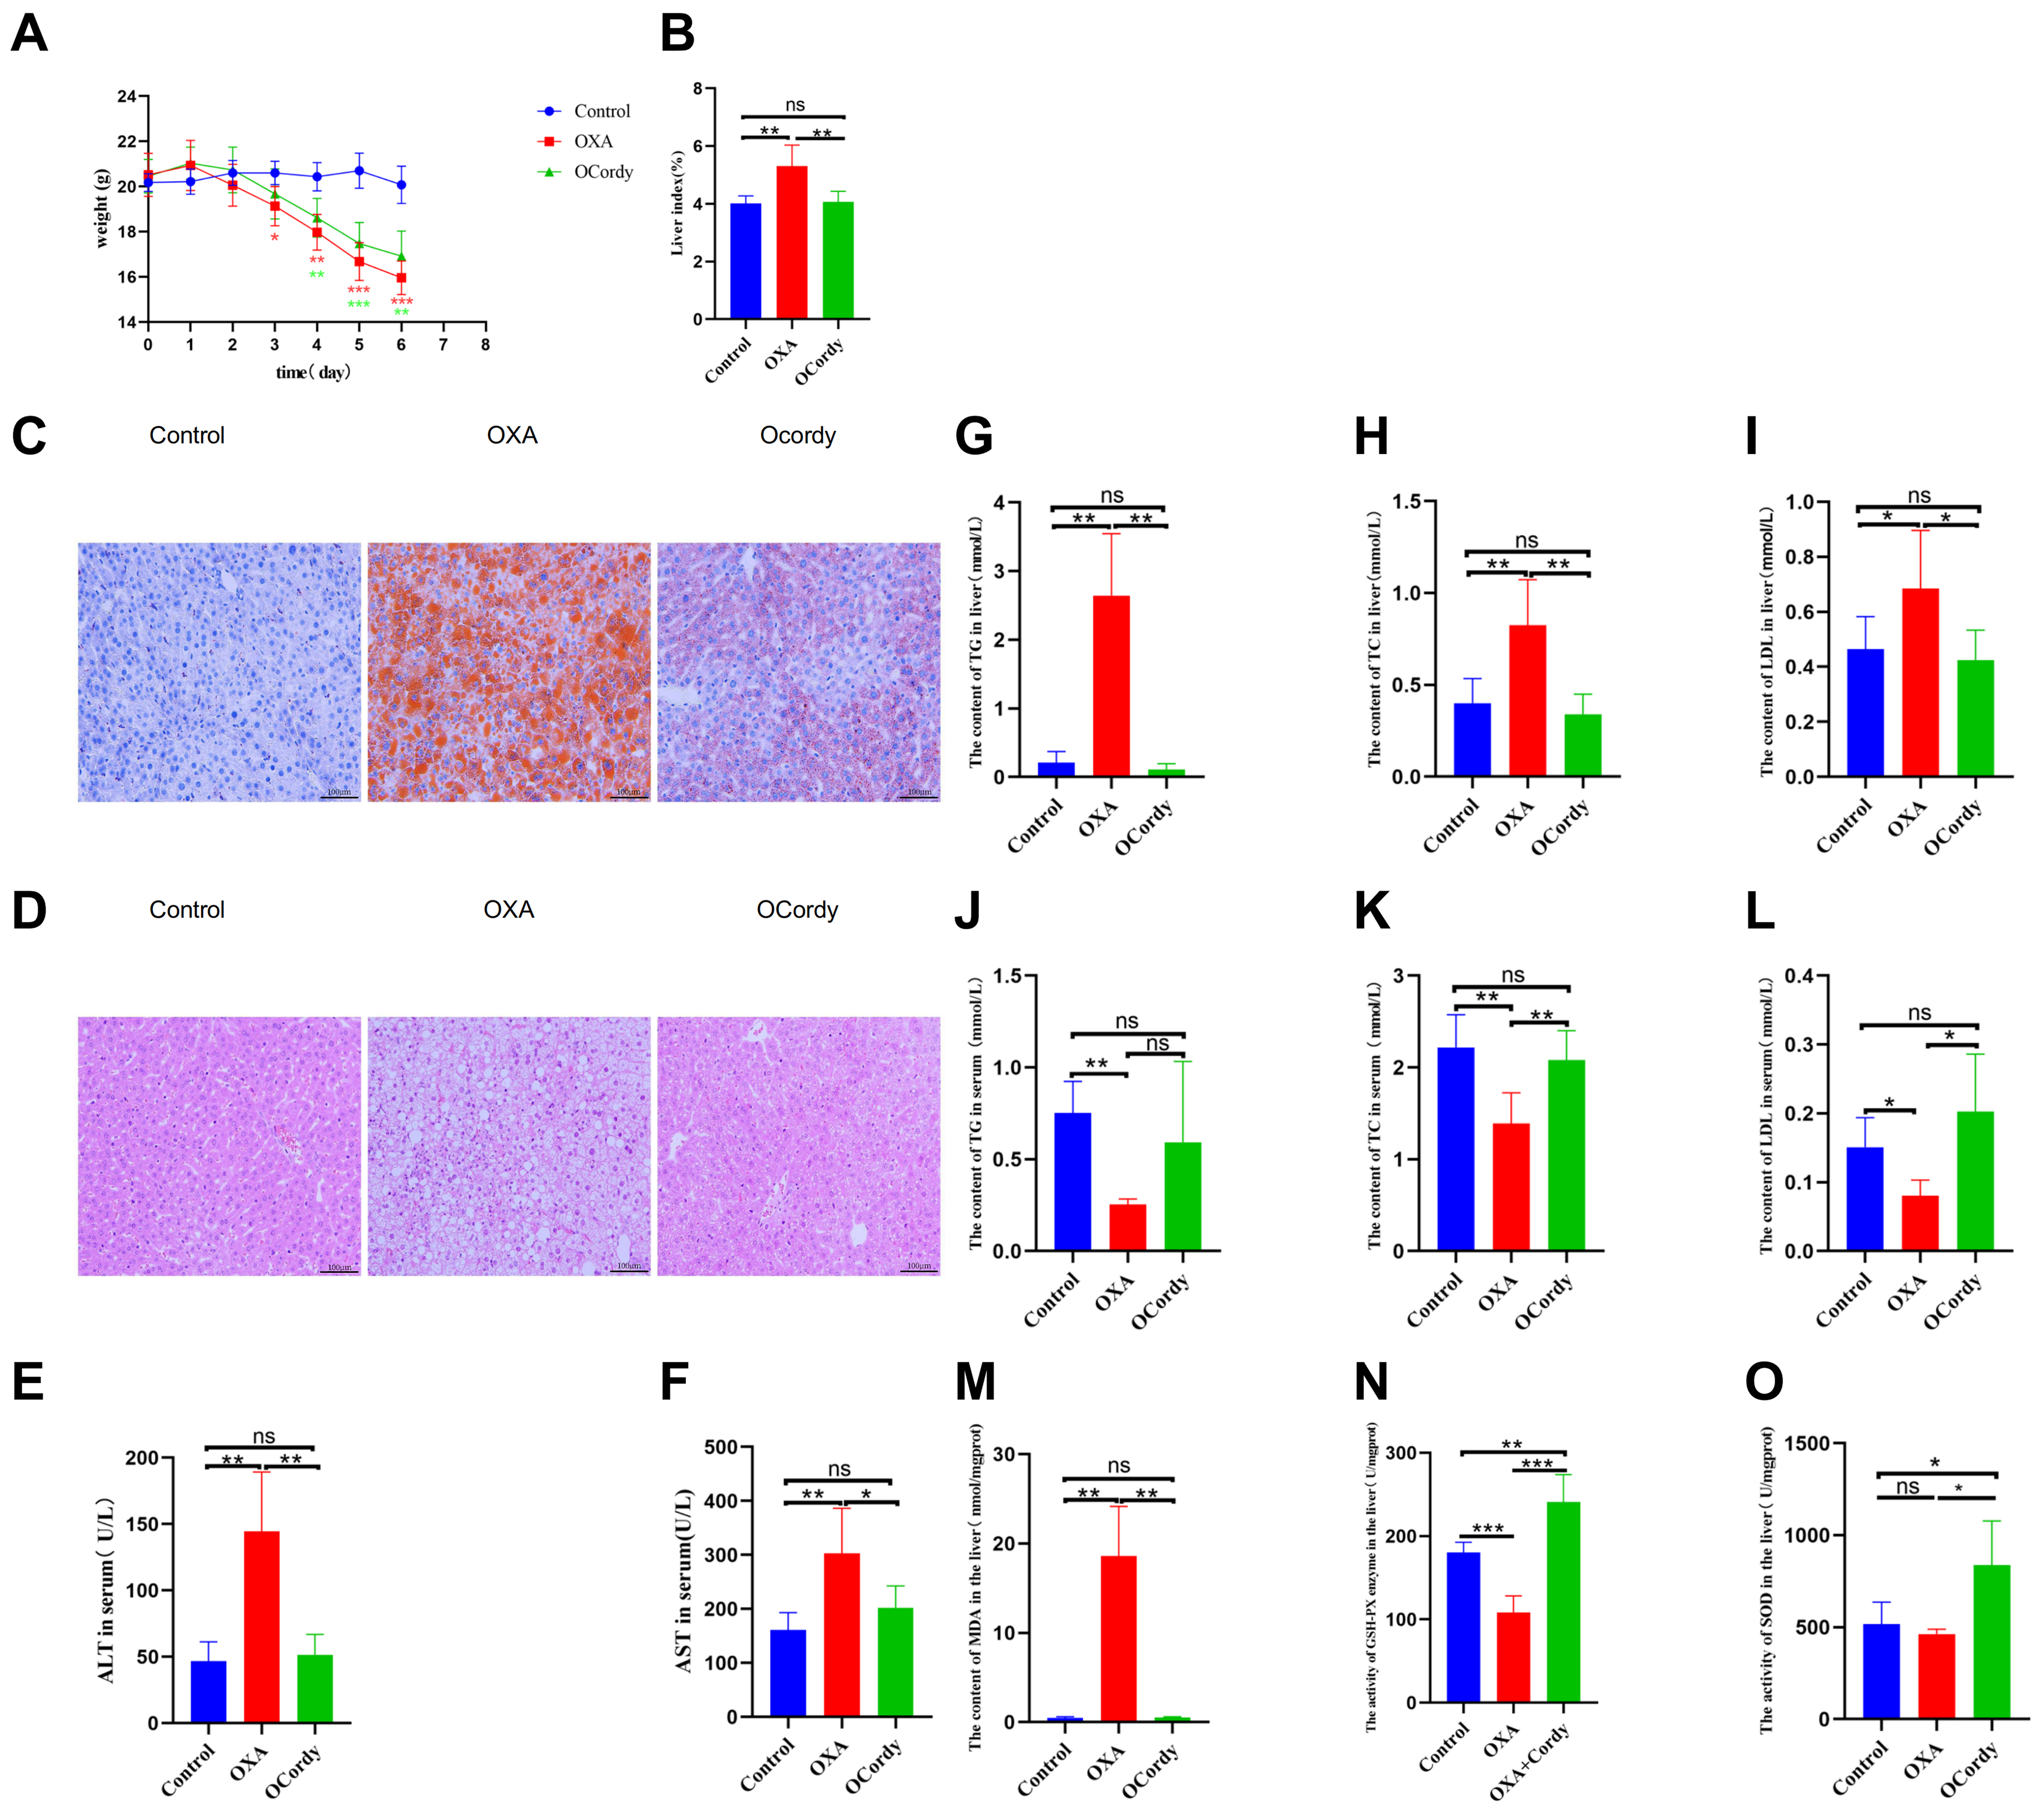
Figure 5. In vivo Experimental Results in Control, OXA, and OCordy Mouse Groups. (A) Body weight changes. Control mice remained stable. OXA induced progressive weight loss (P < 0.05), which was alleviated by cordycepin; (B) Liver index. The index was significantly higher in the OXA group than in the Control group (P < 0.01); cordycepin intervention significantly reduced this index (P < 0.01); (C) Liver Oil Red O staining (200×). OXA caused diffuse lipid droplet accumulation, which was markedly reduced by cordycepin; (D) Liver HE staining (200×). OXA resulted in hepatocyte swelling and disordered arrangement; these pathological changes were ameliorated by cordycepin; (E and F) Serum ALT and AST levels. OXA significantly elevated levels compared to Control (P < 0.01); cordycepin significantly reduced levels (P < 0.01 and P < 0.05, respectively); (G-I) Liver TG, TC, and LDL levels. OXA significantly elevated levels (P < 0.01, P < 0.01, and P < 0.05, respectively); cordycepin treatment significantly reduced levels (P < 0.01, P < 0.01, and P < 0.05, respectively); (J-L) Serum TG, TC, and LDL levels. OXA significantly lowered levels (P < 0.01, P < 0.01, and P < 0.05, respectively); cordycepin intervention increased serum TC and LDL (P < 0.01 and P < 0.05, respectively); (M-O) Liver MDA content, GSH-PX activity, and SOD activity. OXA increased MDA (P < 0.01) and decreased GSH-PX (P < 0.001). Cordycepin treatment reduced MDA (P < 0.01) and increased SOD (P < 0.05) and GSH-PX activities (P < 0.001 and P < 0.01). (Note: Statistical methods: Independent Samples t-test. *P < 0.05, P < 0.01, *P < 0.001). OXA: Oxaliplatin; OCordy: Oxaliplatin plus cordycepin; HE: hematoxylin and eosin; ALT: alanine aminotransferase; AST: aspartate aminotransferase; TG: triglycerides; TC: total cholesterol; LDL: low-density lipoprotein; MDA: malondialdehyde; GSH-PX: glutathione peroxidase; SOD: superoxide dismutase.
Pathological changes in mouse liver
The results of Oil Red O staining under light microscopy revealed that hepatocytes in the control group exhibited a typical blue color, with no red lipid droplets observed in the cytoplasm. In the OXA group, red lipid droplets of varying sizes were diffusely distributed within the cytoplasm of hepatocytes, indicating significant fatty degeneration induced by OXA in the mouse liver. An OXA-induced acute DIFLD mouse model was successfully established. Compared to the OXA group, mice in the OCordy group exhibited a significant reduction in red lipid droplets within hepatocytes, suggesting a decrease in lipid accumulation in OXA-induced DIFLD mice after cordycepin administration [Figure 5C].
The results of HE staining under light microscopy revealed that the liver tissue structure of mice in the control group was normal, with clear demarcation of liver lobules and hepatocytes arranged in a cord-like pattern. The nuclei were of normal size. In the OXA group, hepatocytes were swollen, with unclear intercellular boundaries, disordered arrangement, and numerous lipid droplet vacuoles of varying sizes in the cytoplasm. The boundaries were unclear, and the nuclei were pushed to one side. Compared to the OXA group, the OCordy group showed improvement in liver cell damage, with hepatocytes tending to be more regularly arranged and a decrease in lipid droplet vacuoles [Figure 5D].
Serum liver function levels, serum and liver tissue lipid levels, and liver tissue oxidative stress indicators in mice
Compared to the control group mice, the OXA group mice exhibited significantly elevated serum levels of ALT and AST (all P < 0.01, Figure 5E and F), as well as significantly increased levels of TG, TC, and LDL in the liver tissue (all P < 0.05, Figure 5G-I). Conversely, the serum levels of TG, TC, and LDL were significantly decreased (all P < 0.05, Figure 5J-L), whereas the MDA content in the liver tissue was significantly increased (P < 0.01, Figure 5M). GSH-PX activity was decreased (P < 0.001, Figure 5N), and SOD enzyme activity was decreased without significance (P > 0.05, Figure 5O). Compared to the OXA group mice, the OCordy group mice exhibited significantly decreased levels of ALT and AST in the serum (all P < 0.05, Figure 5E and F), as well as significantly decreased levels of TG, TC, and LDL in the liver tissue (all P < 0.05, Figures 5G-I). Conversely, the serum levels of TC and LDL were significantly increased (all P < 0.05, Figure 5K and L), whereas the MDA content in the liver tissue was significantly decreased (P < 0.01, Figure 5M). GSH-PX (P < 0.001, Figure 5N) and SOD (P < 0.05, Figure 5O) enzyme activities were significantly increased.
Non-targeted metabolomics analysis
In this study, QC samples were used as a reference, and the response intensity of the mass spectrometry peaks of the samples was normalized using the sum normalization method. The results showed that the cumulative proportion of peaks obtained after normalization exceeded 70% [Supplementary Figure 1], indicating that the data quality met the requirements. PLS-DA [Figure 6A] revealed good clustering characteristics within the same group, with clear separation between groups, confirming good experimental reproducibility. The volcano plot showed that 1,061 DMs were detected in the liver tissues of mice in OXA group compared to that of control group, with 292 upregulated and 769 downregulated [Figure 6B]. Between the OCordy and OXA groups, 481 DMs were detected, with 309 upregulated and 172 downregulated [Figure 6C]. The Venn diagram revealed 197 common DMs between the two groups [Figure 6D]. The chemical classification results of the DMs showed that in the OXA vs. control group, organic acids and their derivatives accounted for the highest proportion (36.30%), followed by lipids and lipid-like molecules (19.98%; Figure 6E). In the OCordy vs. OXA group, lipids and lipid-like molecules accounted for the highest proportion (27.04%), followed by organic acids and their derivatives (25.51%; Figure 6F).
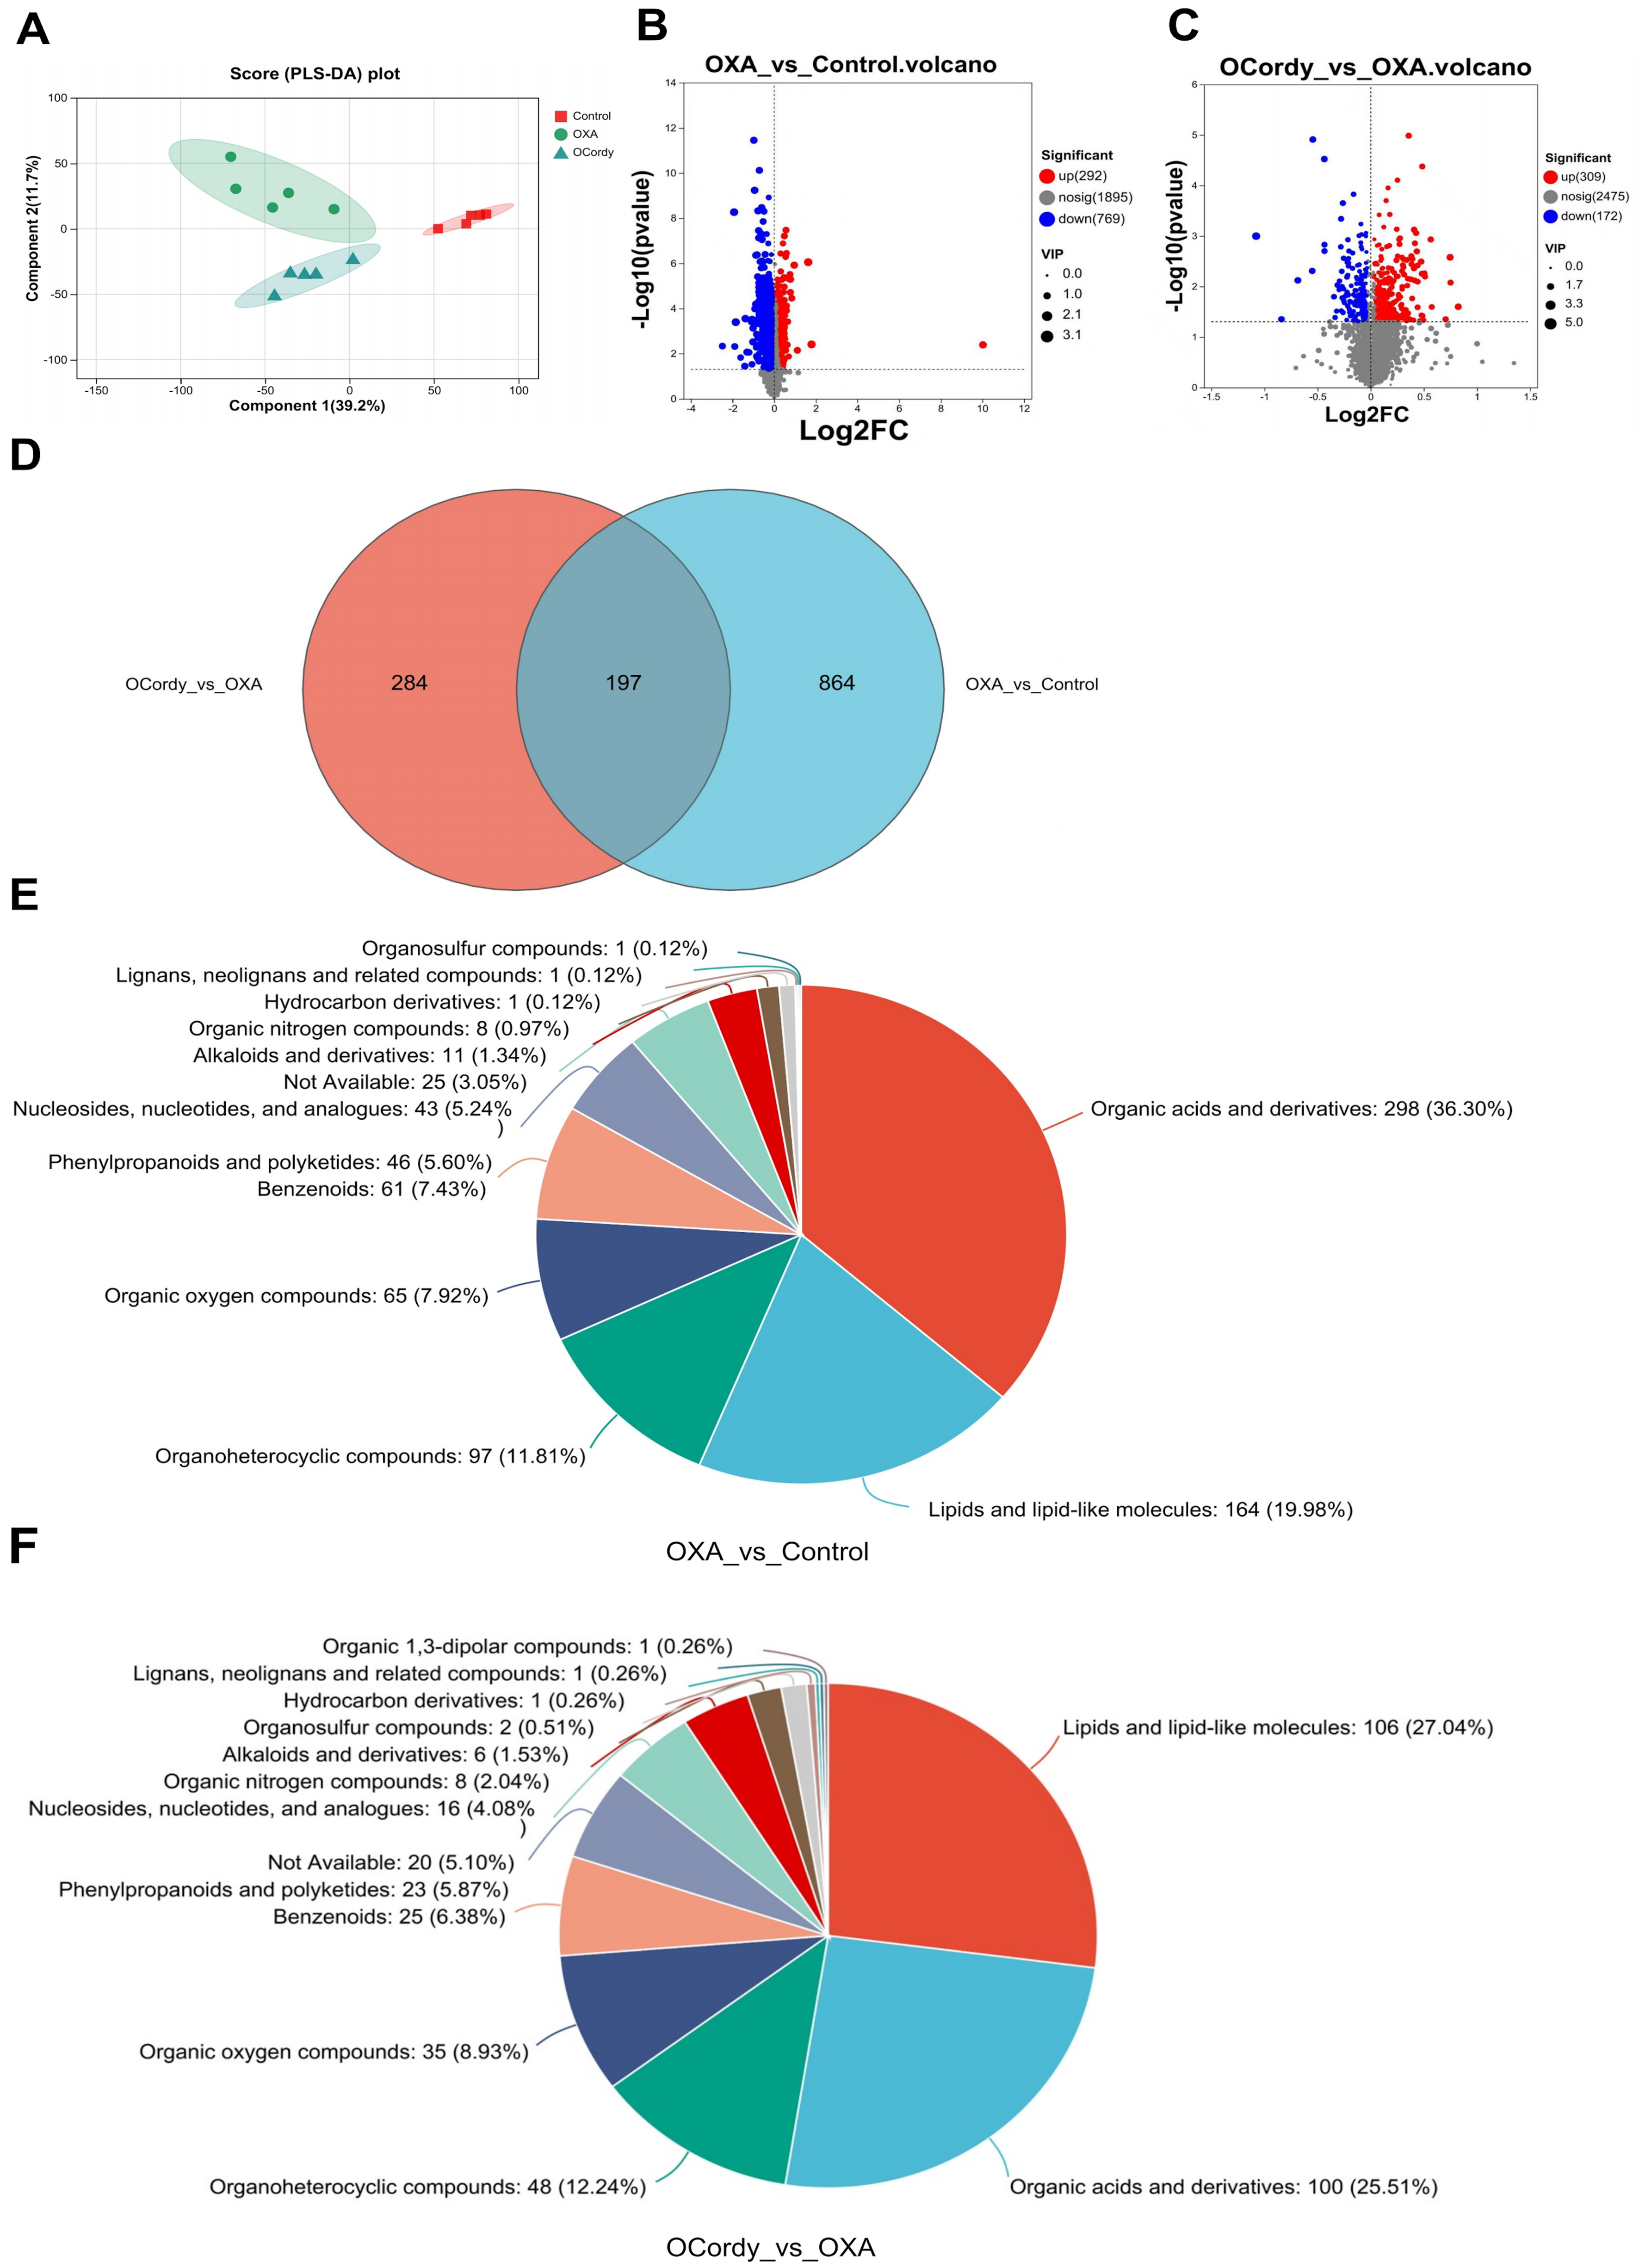
Figure 6. Non-targeted Metabolomic Analysis of Hepatic Tissues from Control, OXA, and OCordy Mouse Groups. (A) PLS-DA score plot showing distinct clustering among Control, OXA, and OCordy groups; (B and C) Volcano plots of differentially expressed metabolites in OXA-Control (B) and OCordy-OXA (C) comparisons (red: upregulated; blue: downregulated); (D) Venn diagram identifying 197 common differential metabolites between the two comparisons; (E and F) Pie charts illustrating the distribution of metabolite classes in OXA-Control (E) and OCordy-OXA (F) groups. OXA: Oxaliplatin; OCordy: Oxaliplatin plus cordycepin; PLS-DA: partial least squares discriminant analysis.
Furthermore, clustering heatmap analysis was performed on the top 30 DMs in terms of abundance in the OXA vs. control group and OCordy vs. OXA group. The results showed that the two groups showed significant differences in metabolites and exhibited clustering correlation (Figure 7A and B). The VIP bar chart revealed that among the top 30 DMs with VIP values and P < 0.05 in the OXA vs. control group and OCordy vs. OXA group, the expression of metabolites related to lipid metabolism was significant. Additionally, some metabolites related to oxidative stress were upregulated [Figure 7C and D].
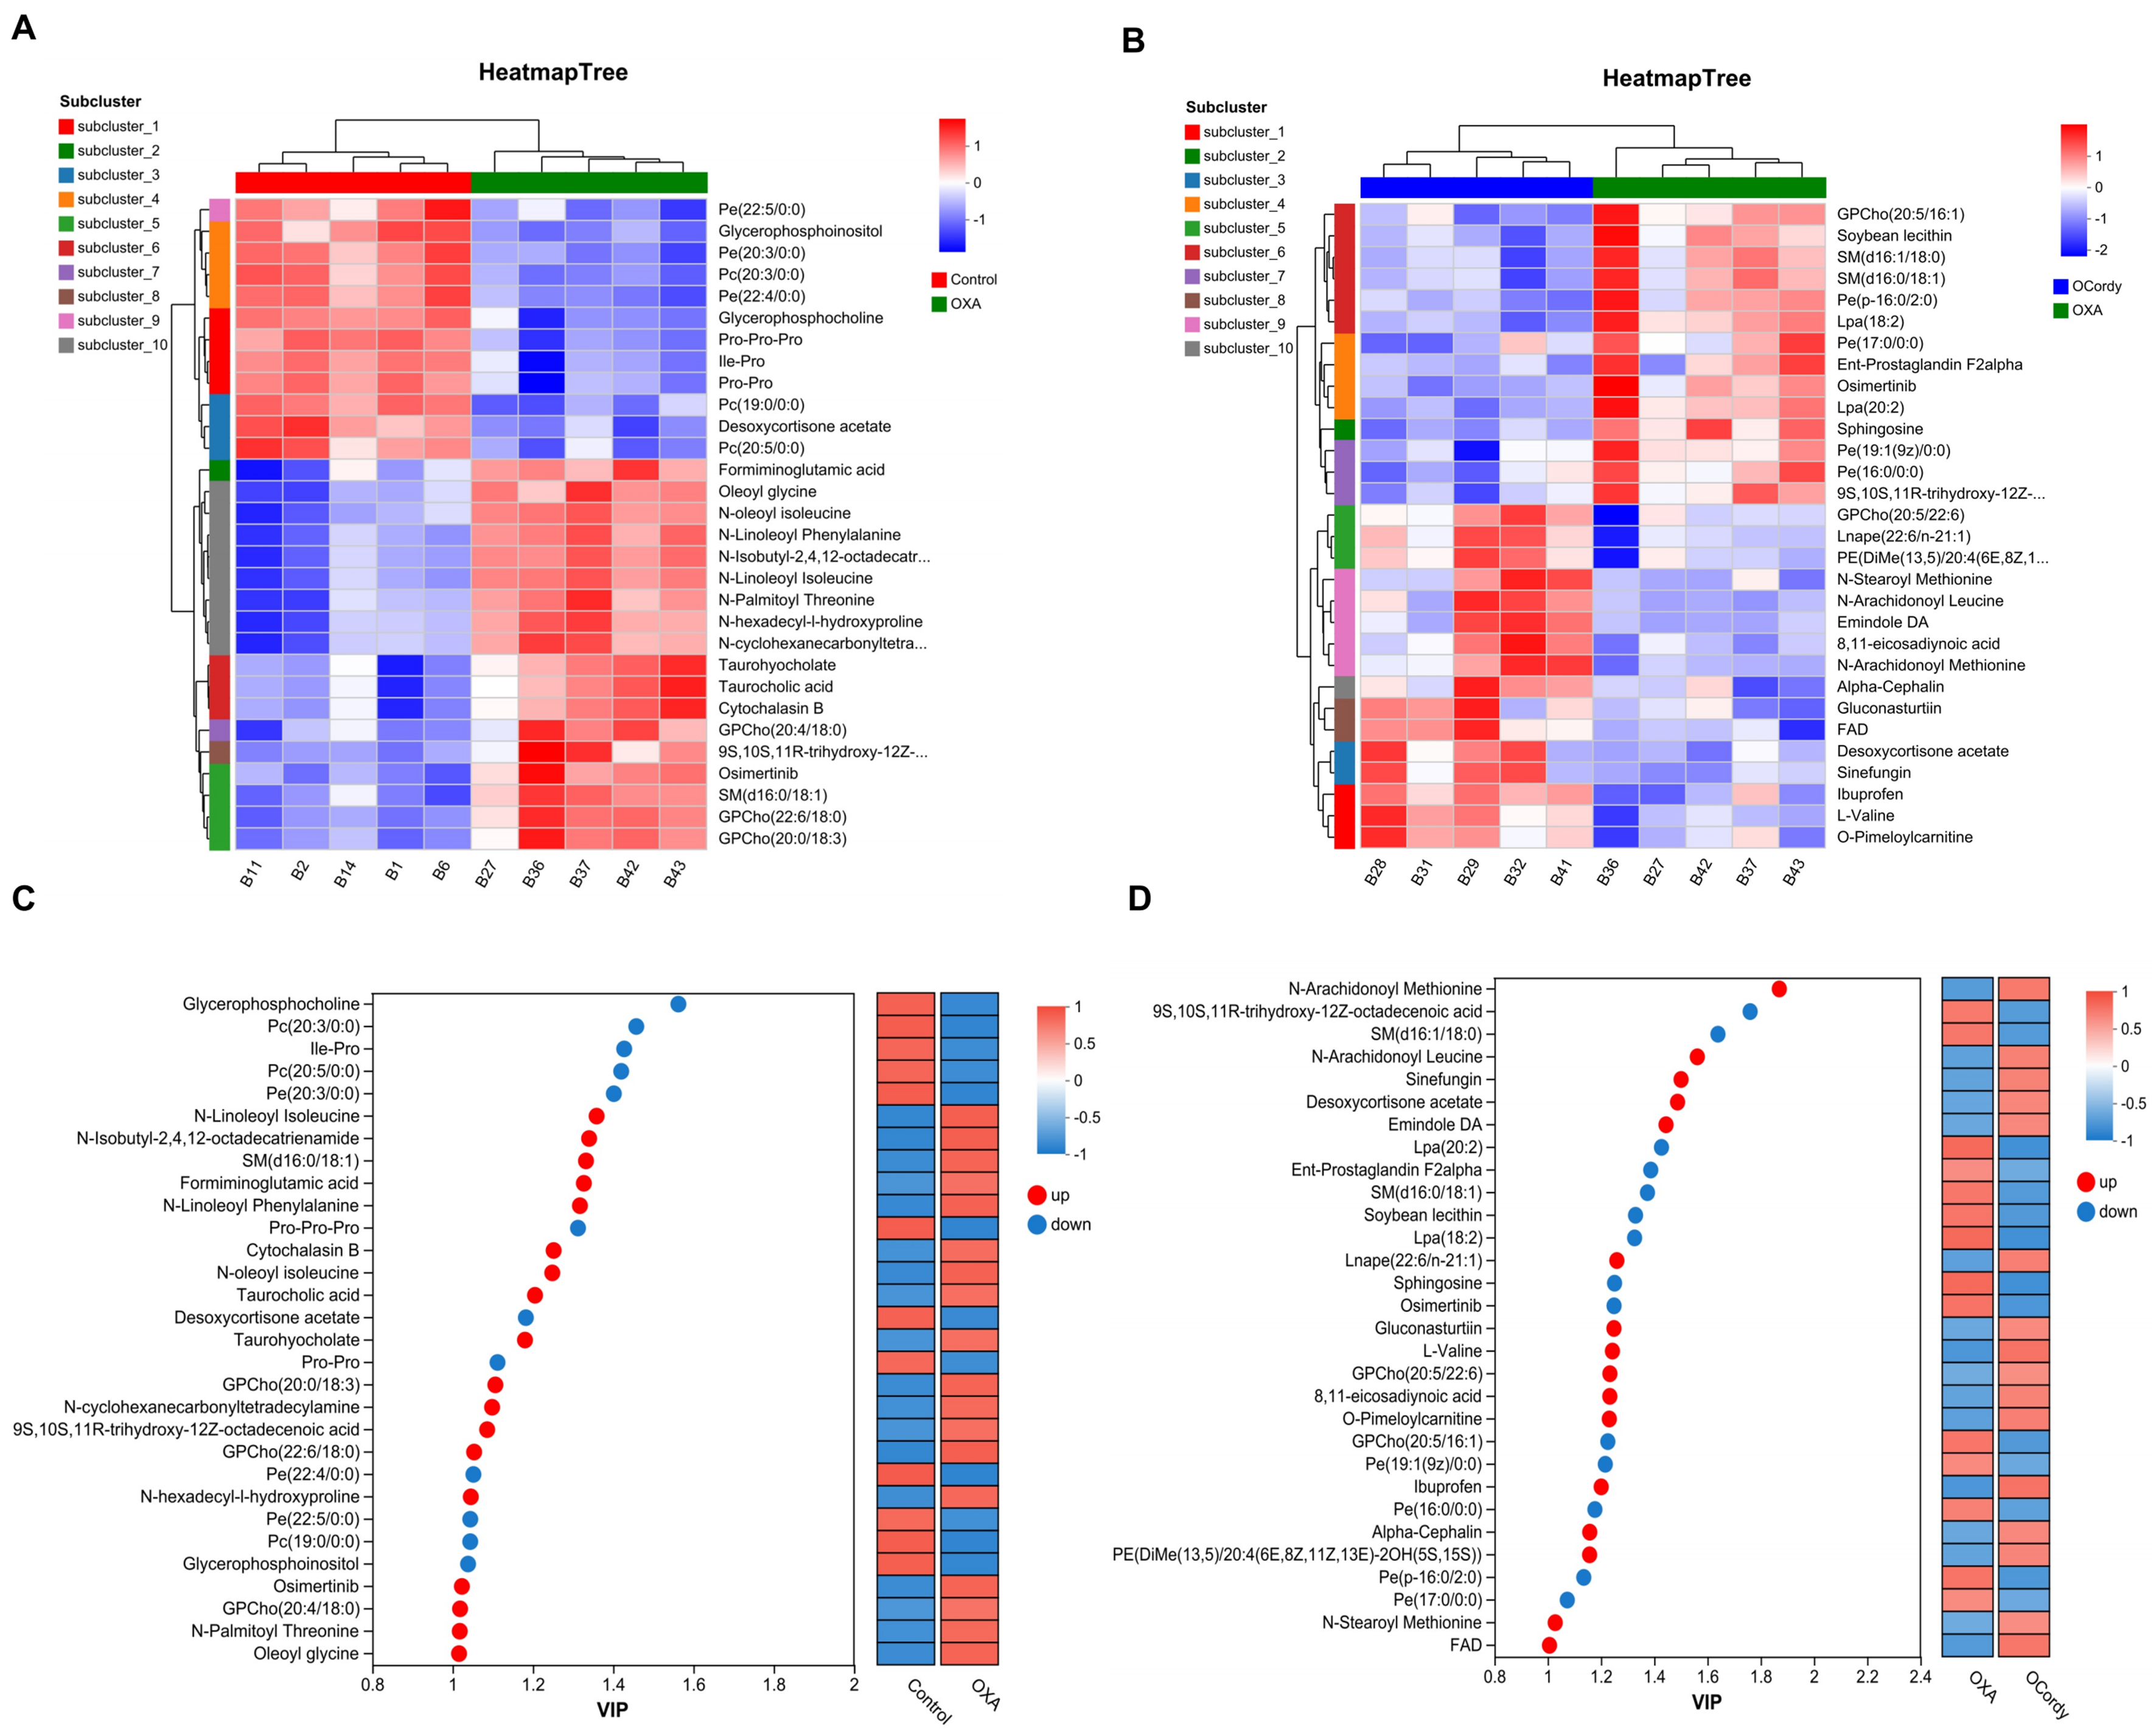
Figure 7. Non-targeted Metabolomics Analysis of Hepatic Tissues from Control, OXA, and OCordy Mouse Groups. (A and B) Heatmaps showing clustering analysis of the top 30 DMs in liver tissues from OXA-control (A) and OCordy-OXA (B) comparisons. Color intensity represents metabolite abundance (red: upregulated; blue: downregulated), revealing significant metabolic alterations and distinct clustering patterns. (C and D) VIP bar plots displaying expression levels of the top 30 differentially expressed metabolites in OXA-Control (C) and OCordy-OXA (D) comparisons in liver tissues. X-axis: VIP values; Y-axis: metabolites (red: upregulated; blue: downregulated). OXA: Oxaliplatin; OCordy: Oxaliplatin plus cordycepin; DMs: differential metabolites.
Mfuzz trend analysis was performed on the 197 common DMs between the OXA vs. control group and OCordy vs. OXA group. Excluding Cluster 7, the remaining Clusters exhibited opposite trends among the OXA, control, and OCordy groups [Figure 8A]. Among them, Cluster 1, 3, 5, and 8 were significantly enriched in pathways related to oxidative stress and lipid metabolism (Supplementary Figure 2, all P < 0.05).
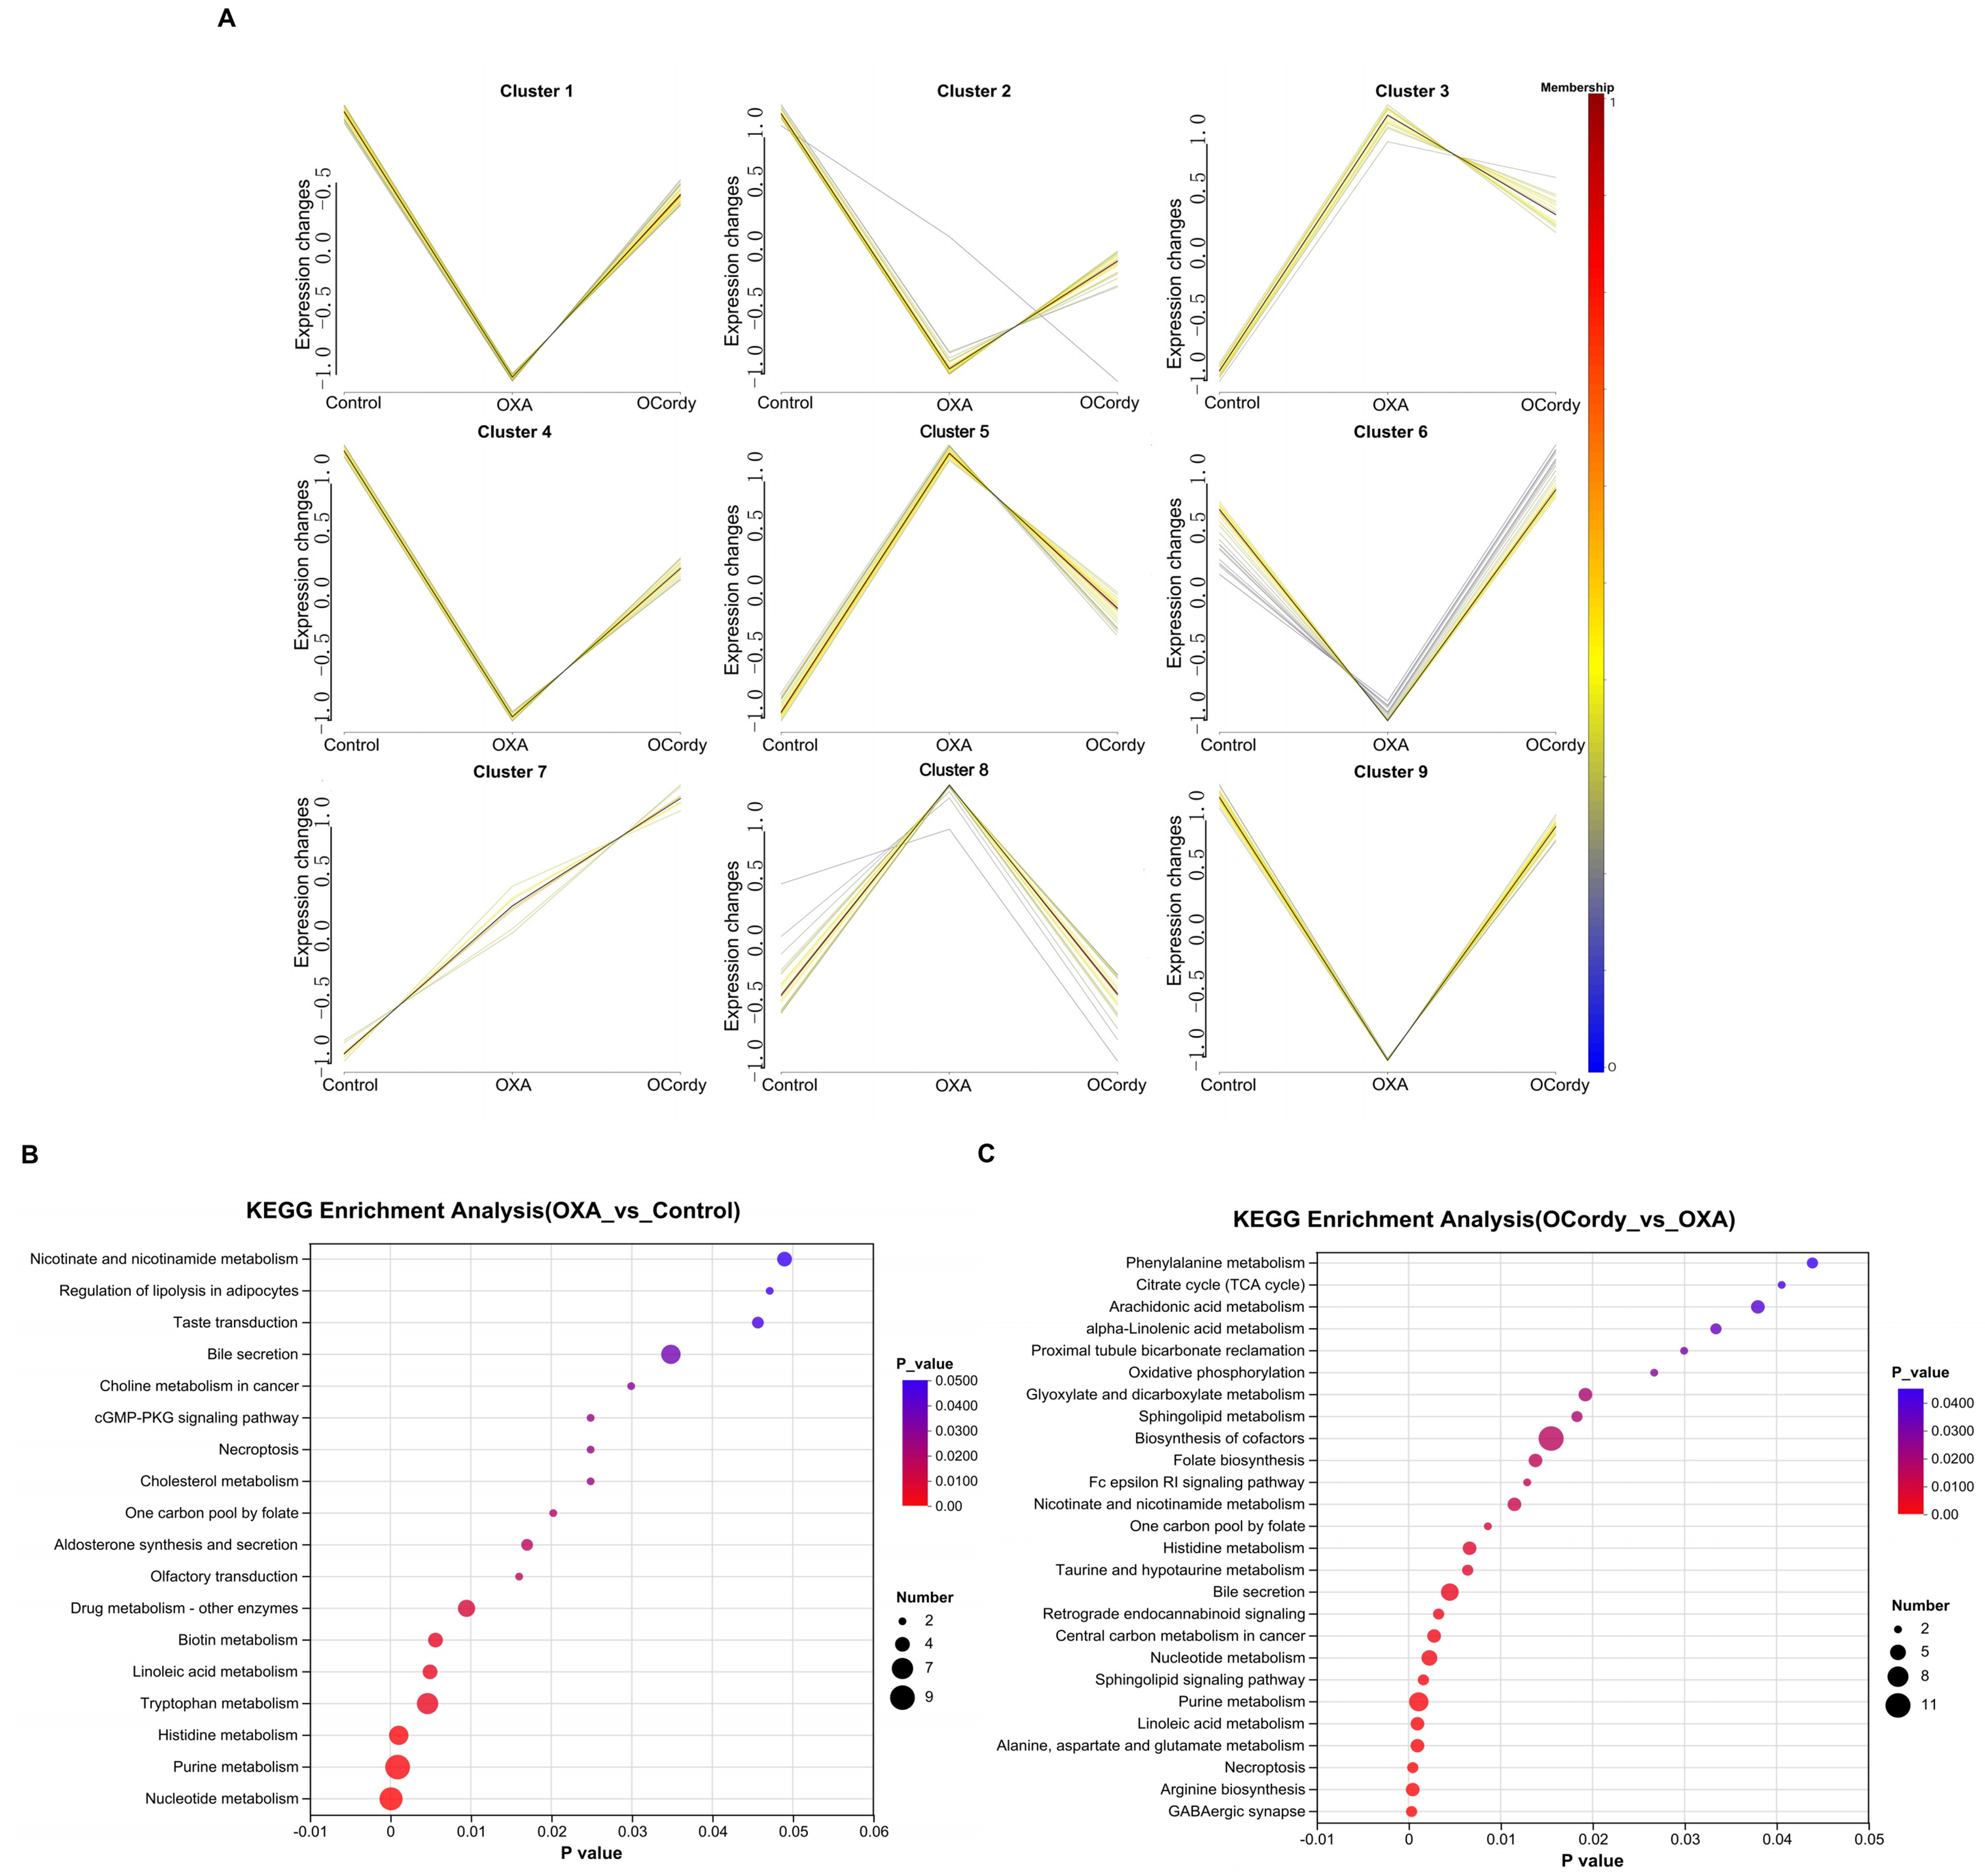
Figure 8. Non-targeted Metabolomic Analysis of Hepatic Tissues from Control, OXA, and OCordy Mouse Groups. (A) Mfuzz analysis illustrating the relationships among metabolite clusters across the Control, OXA, and OCordy groups. The diagram is divided into nine clusters, with lines connecting metabolites between groups. The color gradient (from blue to red) represents metabolite expression intensity, highlighting differential metabolic patterns induced by OXA and the OCordy modulatory effects; (B and C) KEGG enrichment analysis for differentially expressed metabolites in OXA-Control (B) and OCordy-OXA (C) comparisons. The x-axis represents the P-value (-log10 transformed), and the y-axis lists enriched metabolic pathways. The size of each dot corresponds to the number of metabolites involved in each pathway, with color intensity indicating the significance level (P-value). OXA: Oxaliplatin; OCordy: Oxaliplatin plus cordycepin; KEGG: Kyoto Encyclopedia of Genes and Genomes.
Pathway enrichment analysis was performed by importing the DMs of the OXA vs. control group into the KEGG database. We determined that certain pathways, primarily related to lipid metabolism and oxidative stress, exhibited significant enrichment such as oleic acid metabolism, cholesterol metabolism, bile secretion, regulation of lipolysis in adipocytes, and necroptosis (all P < 0.05, Figure 8B). KEGG pathway enrichment analysis of the DMs in the OCordy vs. OXA group revealed significant enrichment in pathways related to lipid metabolism and oxidative stress, such as linoleic acid metabolism, sphingolipid signaling, retrograde endocannabinoid signaling, bile secretion, sphingolipid metabolism, taurine and hypotaurine metabolism, arachidonic acid metabolism, and alpha-linolenic acid metabolism (all P < 0.05, Figure 8C).
Proteomics analysis
The PCA plot showed that the samples within the same group were concentrated, while significant separation was observed between different groups, indicating significant differences among the groups [Figure 9A]. The volcano plot revealed that 821 DEPs were identified between the OXA and control groups, with 479 significantly upregulated and 342 significantly downregulated [Figure 9B]. Between the OCordy and OXA groups, 296 DEPs were identified, with 115 and 181 significantly upregulated and downregulated, respectively [Figure 9C]. The Venn diagram showed 199 DEPs commonly regulated between the OXA and control groups, as well as between the OCordy and OXA groups [Figure 9D]. Mfuzz analysis of these 199 common DEPs revealed that, excluding a small portion in Cluster 1, the trends of OXA group were opposite to those of the control and OCordy groups in the remaining Clusters [Figure 9E].
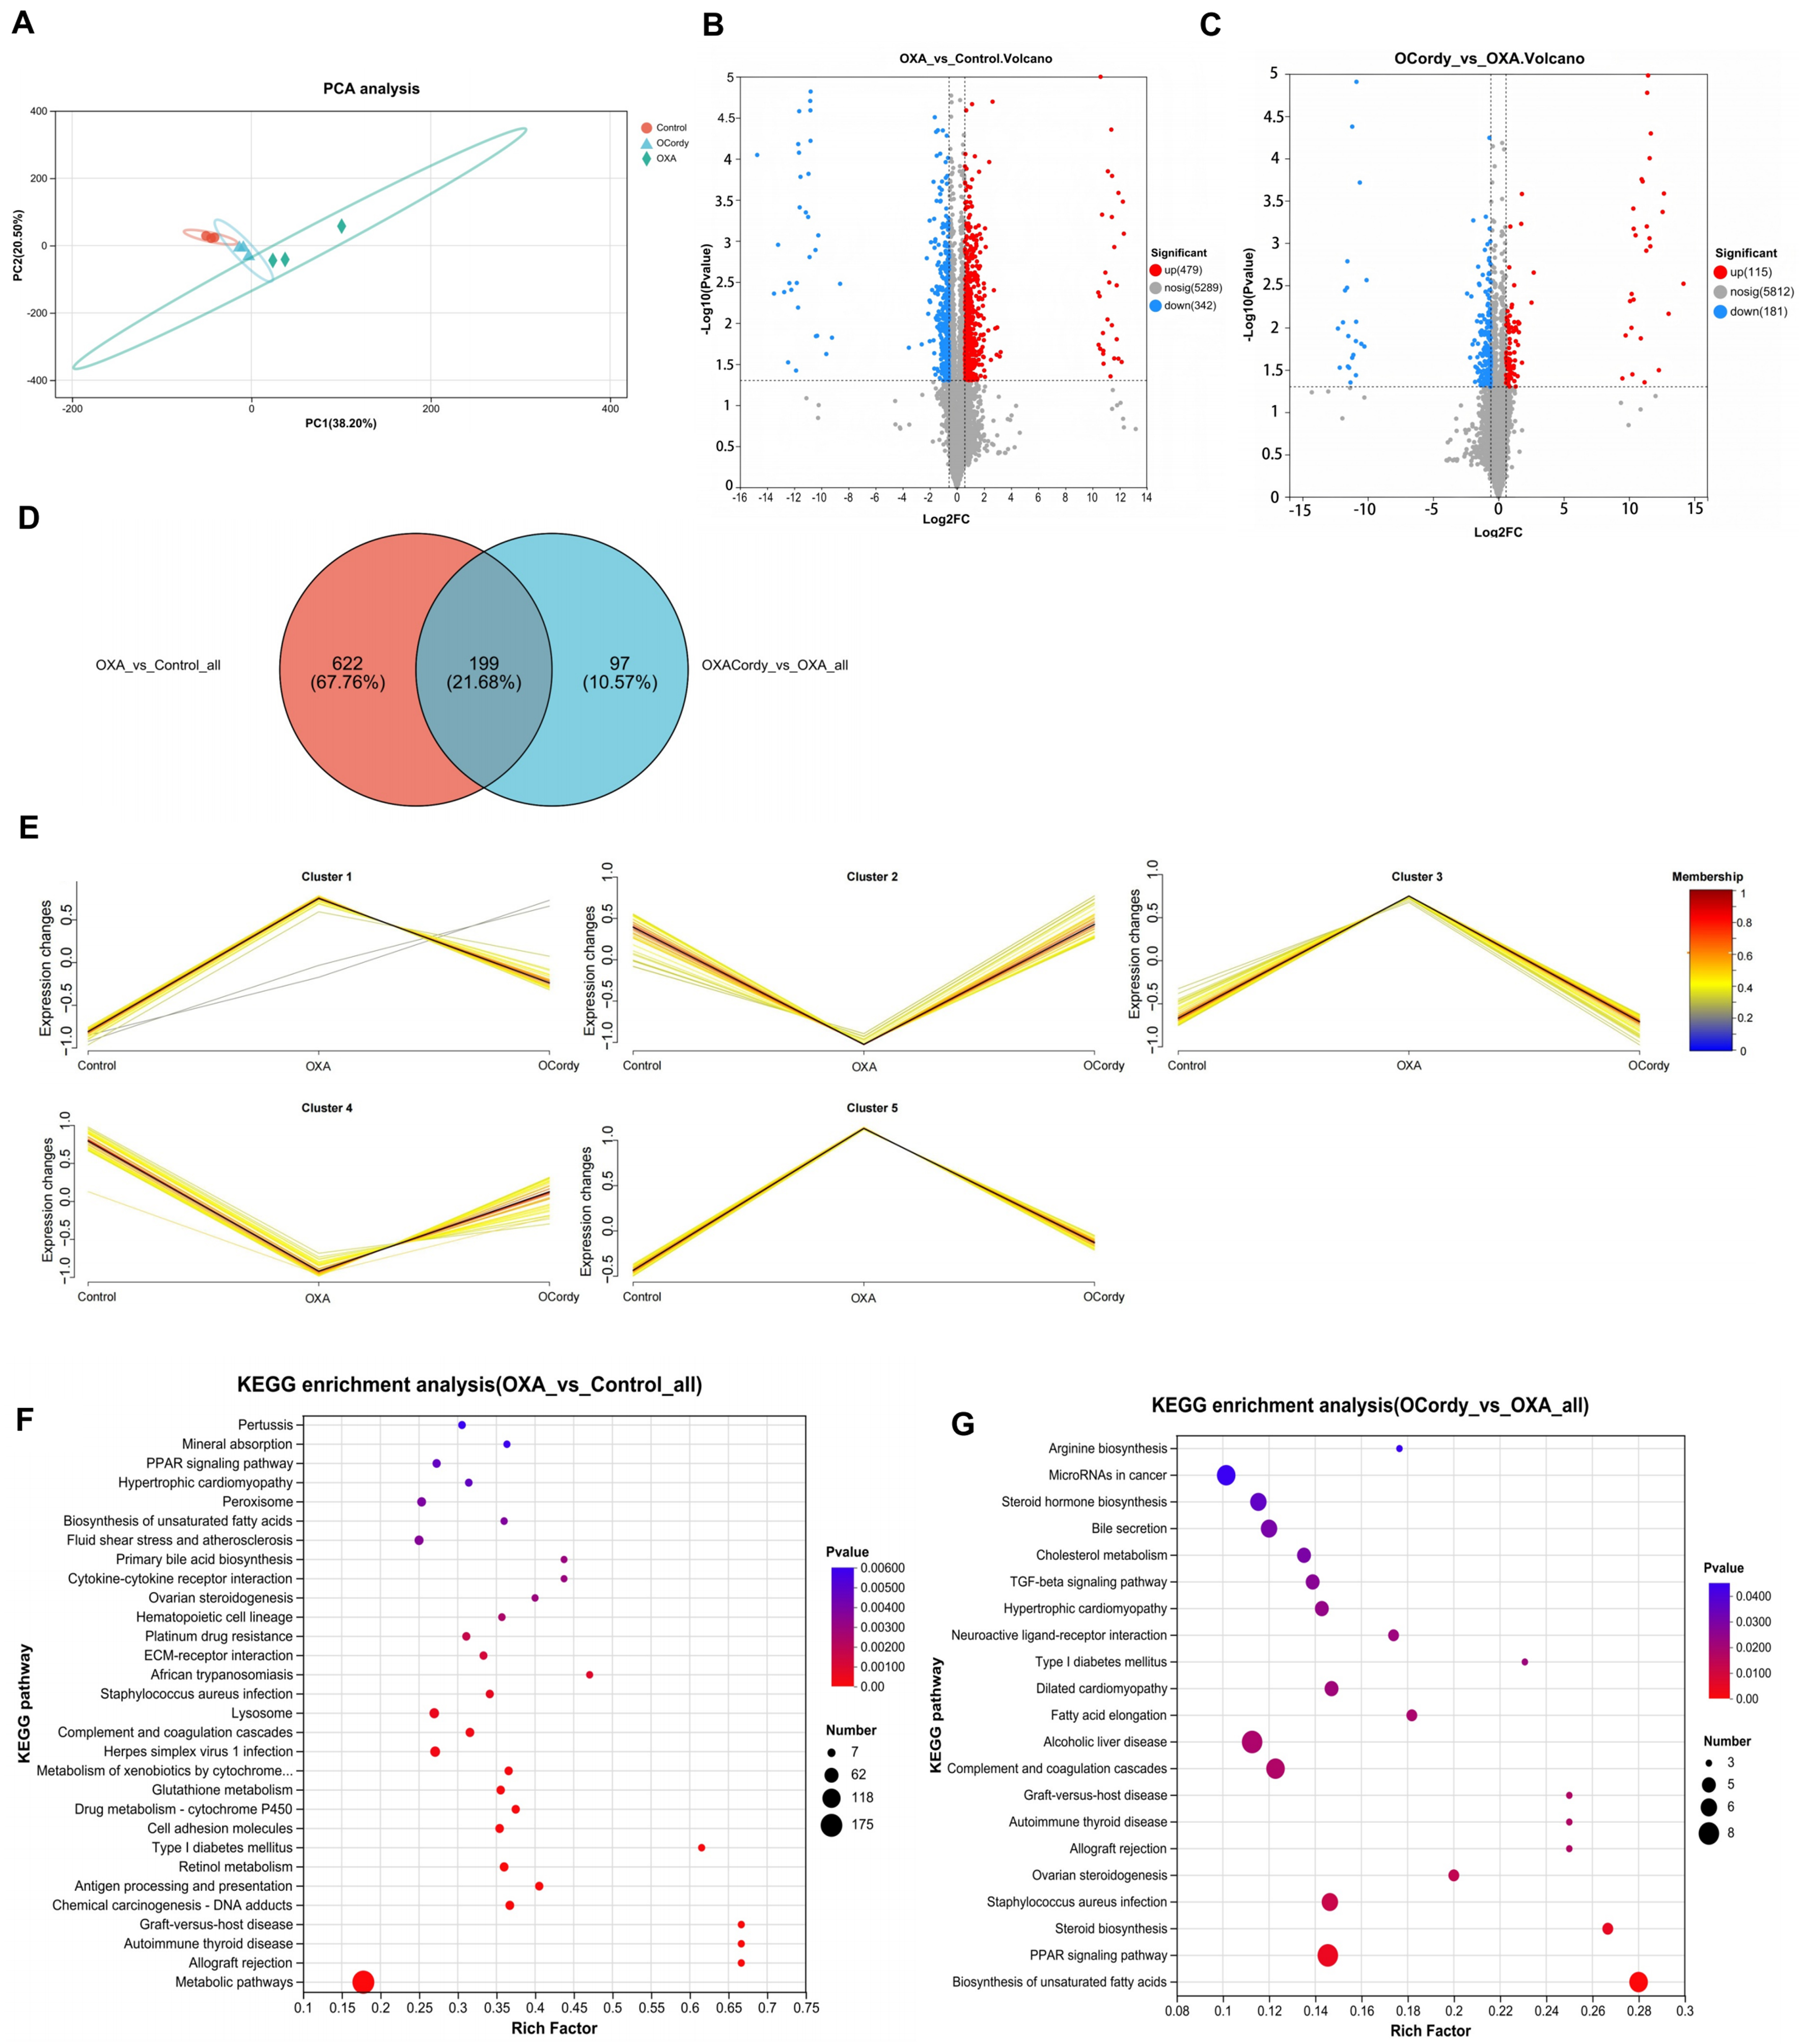
Figure 9. DIA Proteomic Analysis of Hepatic Tissues from Control, OXA, and OCordy Mouse Groups. (A) PCA plot of global protein expression across Control (red), OXA (blue), and OCordy (green) groups, showing distinct clustering. Principal components 1 and 2 account for 38.20% and 24.50% of the variance, respectively; (B and C) Volcano plots of differentially expressed proteins in OXA-Control (B) and OCordy-OXA (C) comparisons. Red: upregulation; blue: downregulation. Significant proteins (P < 0.05, fold change > 1.5) are highlighted; (D) Venn diagram of significantly altered proteins in OXA-Control and OCordy-OXA comparisons, with 199 common proteins; (E) Mfuzz analysis of protein clusters across groups. Color gradient (blue to red) represents expression intensity, highlighting OXA-induced patterns and cordycepin modulation; (F and G) KEGG enrichment analysis of DEPs in OXA-Control (F) and OCordy-OXA (G). Key pathways (e.g., PPAR signaling) are highlighted, revealing OXA-induced reprogramming and cordycepin restoration. DIA: Data-independent acquisition; OXA: Oxaliplatin; OCordy: Oxaliplatin plus cordycepin; PCA: principal component analysis; DEPs: differentially expressed proteins; KEGG: Kyoto Encyclopedia of Genes and Genomes; PPAR: peroxisome proliferator-activated receptor.
KEGG pathway analysis results showed the DEPs between the OXA and control groups were significantly enriched in pathways related to lipid metabolism [e.g., unsaturated fatty acid biosynthesis, Peroxisome Proliferator-Activated Receptor (PPAR) signaling pathway, ovarian steroidogenesis] and oxidative stress (such as peroxisome metabolism, glutathione metabolism, retinol metabolism; all P < 0.05, Figure 9F). The DEPs between the OCordy and OXA groups were primarily enriched in pathways related to lipid metabolism (e.g., ovarian steroidogenesis, unsaturated fatty acid biosynthesis, PPAR signaling pathway, steroid biosynthesis, steroid hormone biosynthesis, cholesterol metabolism, alcoholic liver disease; all P < 0.05, Figure 9G).
Combined metabolomics and proteomics analysis
The O2PLS method was used to evaluate the intrinsic correlation between the proteomics and metabolomics datasets. The results showed a high degree of similarity between the two datasets, with relatively small overall variation, indicating high reliability of the combined analysis results [Figure 10A and B]. Subsequently, KEGG pathway enrichment analysis was performed on the DEPs and DMs between the OCordy and OXA groups. The results revealed 80 KEGG pathways jointly participated by the two omics [Figure 10C], with the top ten pathways showing the highest degree of enrichment for DEPs and DM. This includes purine metabolism, bile secretion, nucleotide metabolism, arachidonic acid metabolism, linoleic acid metabolism, arginine biosynthesis, folate biosynthesis, alanine, aspartate, and glutamate metabolism [Figure 10D]. Additionally, enrichment analysis of the KEGG pathways jointly participated by the two omics using the Fisher exact test showed that the DEPs and DMs between the OCordy and OXA groups were jointly significantly enriched in the bile secretion and arginine biosynthesis pathways (both P < 0.05, Figure 10E). Correlation network analysis was performed on these two pathways and their associated DEPs and DMs. Six DEPs related to arginine biosynthesis, six DMs related to arginine biosynthesis, three DEPs related to bile secretion, and four DMs related to bile secretion were identified. Among them, oxoglutaric acid, a common metabolite in these two pathways, showed a downregulation trend [Figure 11, Tables 3 and 4].
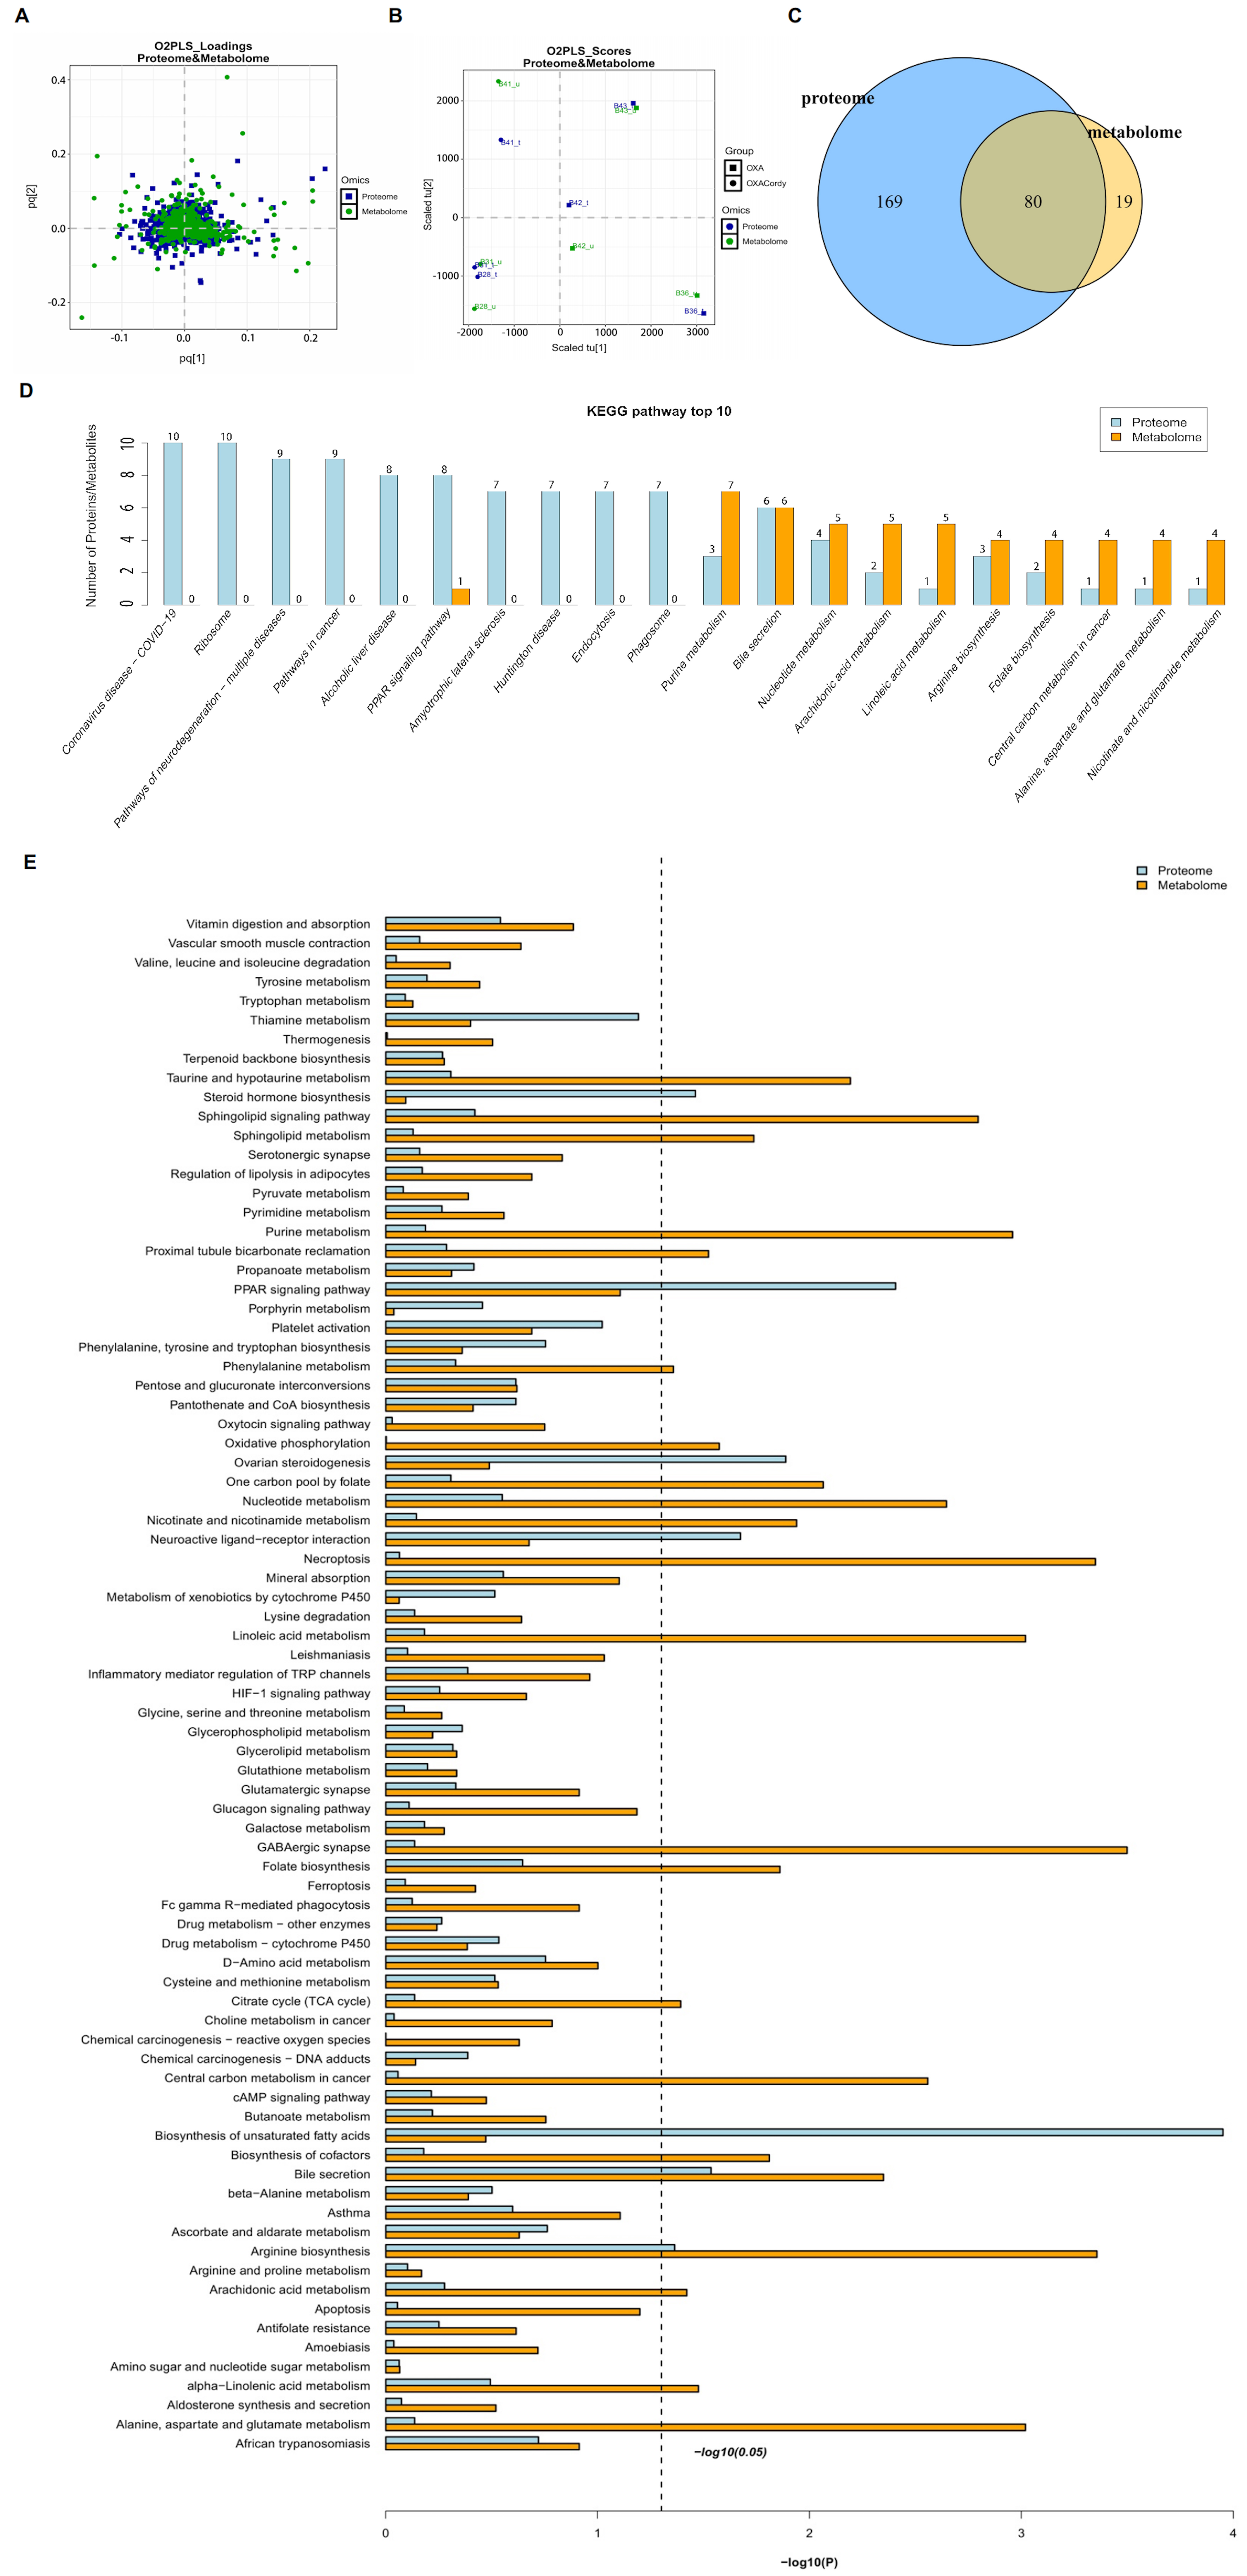
Figure 10. Integrative Analysis of Proteomics and Metabolomics Profiles in Hepatic Tissues from Control, OXA, and OCordy Mouse Groups. (A) OPLS-DA Score Plot showing separation of proteomic and metabolomic profiles among Control, OXA, and OCordy groups; (B) OPLS-DA loading plot identifying key variables contributing to group separation; (C) Venn diagram of overlapping differentially expressed proteins and metabolites; 80 molecules are common to both datasets; (D) Top 10 KEGG pathways for differentially expressed proteins (blue) and metabolites (orange); (E) Comprehensive KEGG pathway enrichment. Pathways ranked by significance [-log10(P-value)]; dashed line indicates P < 0.05. OXA: Oxaliplatin; OCordy: Oxaliplatin plus cordycepin; OPLS-DA: orthogonal projections to latent structures discriminant analysis; KEGG: Kyoto Encyclopedia of Genes and Genomes.
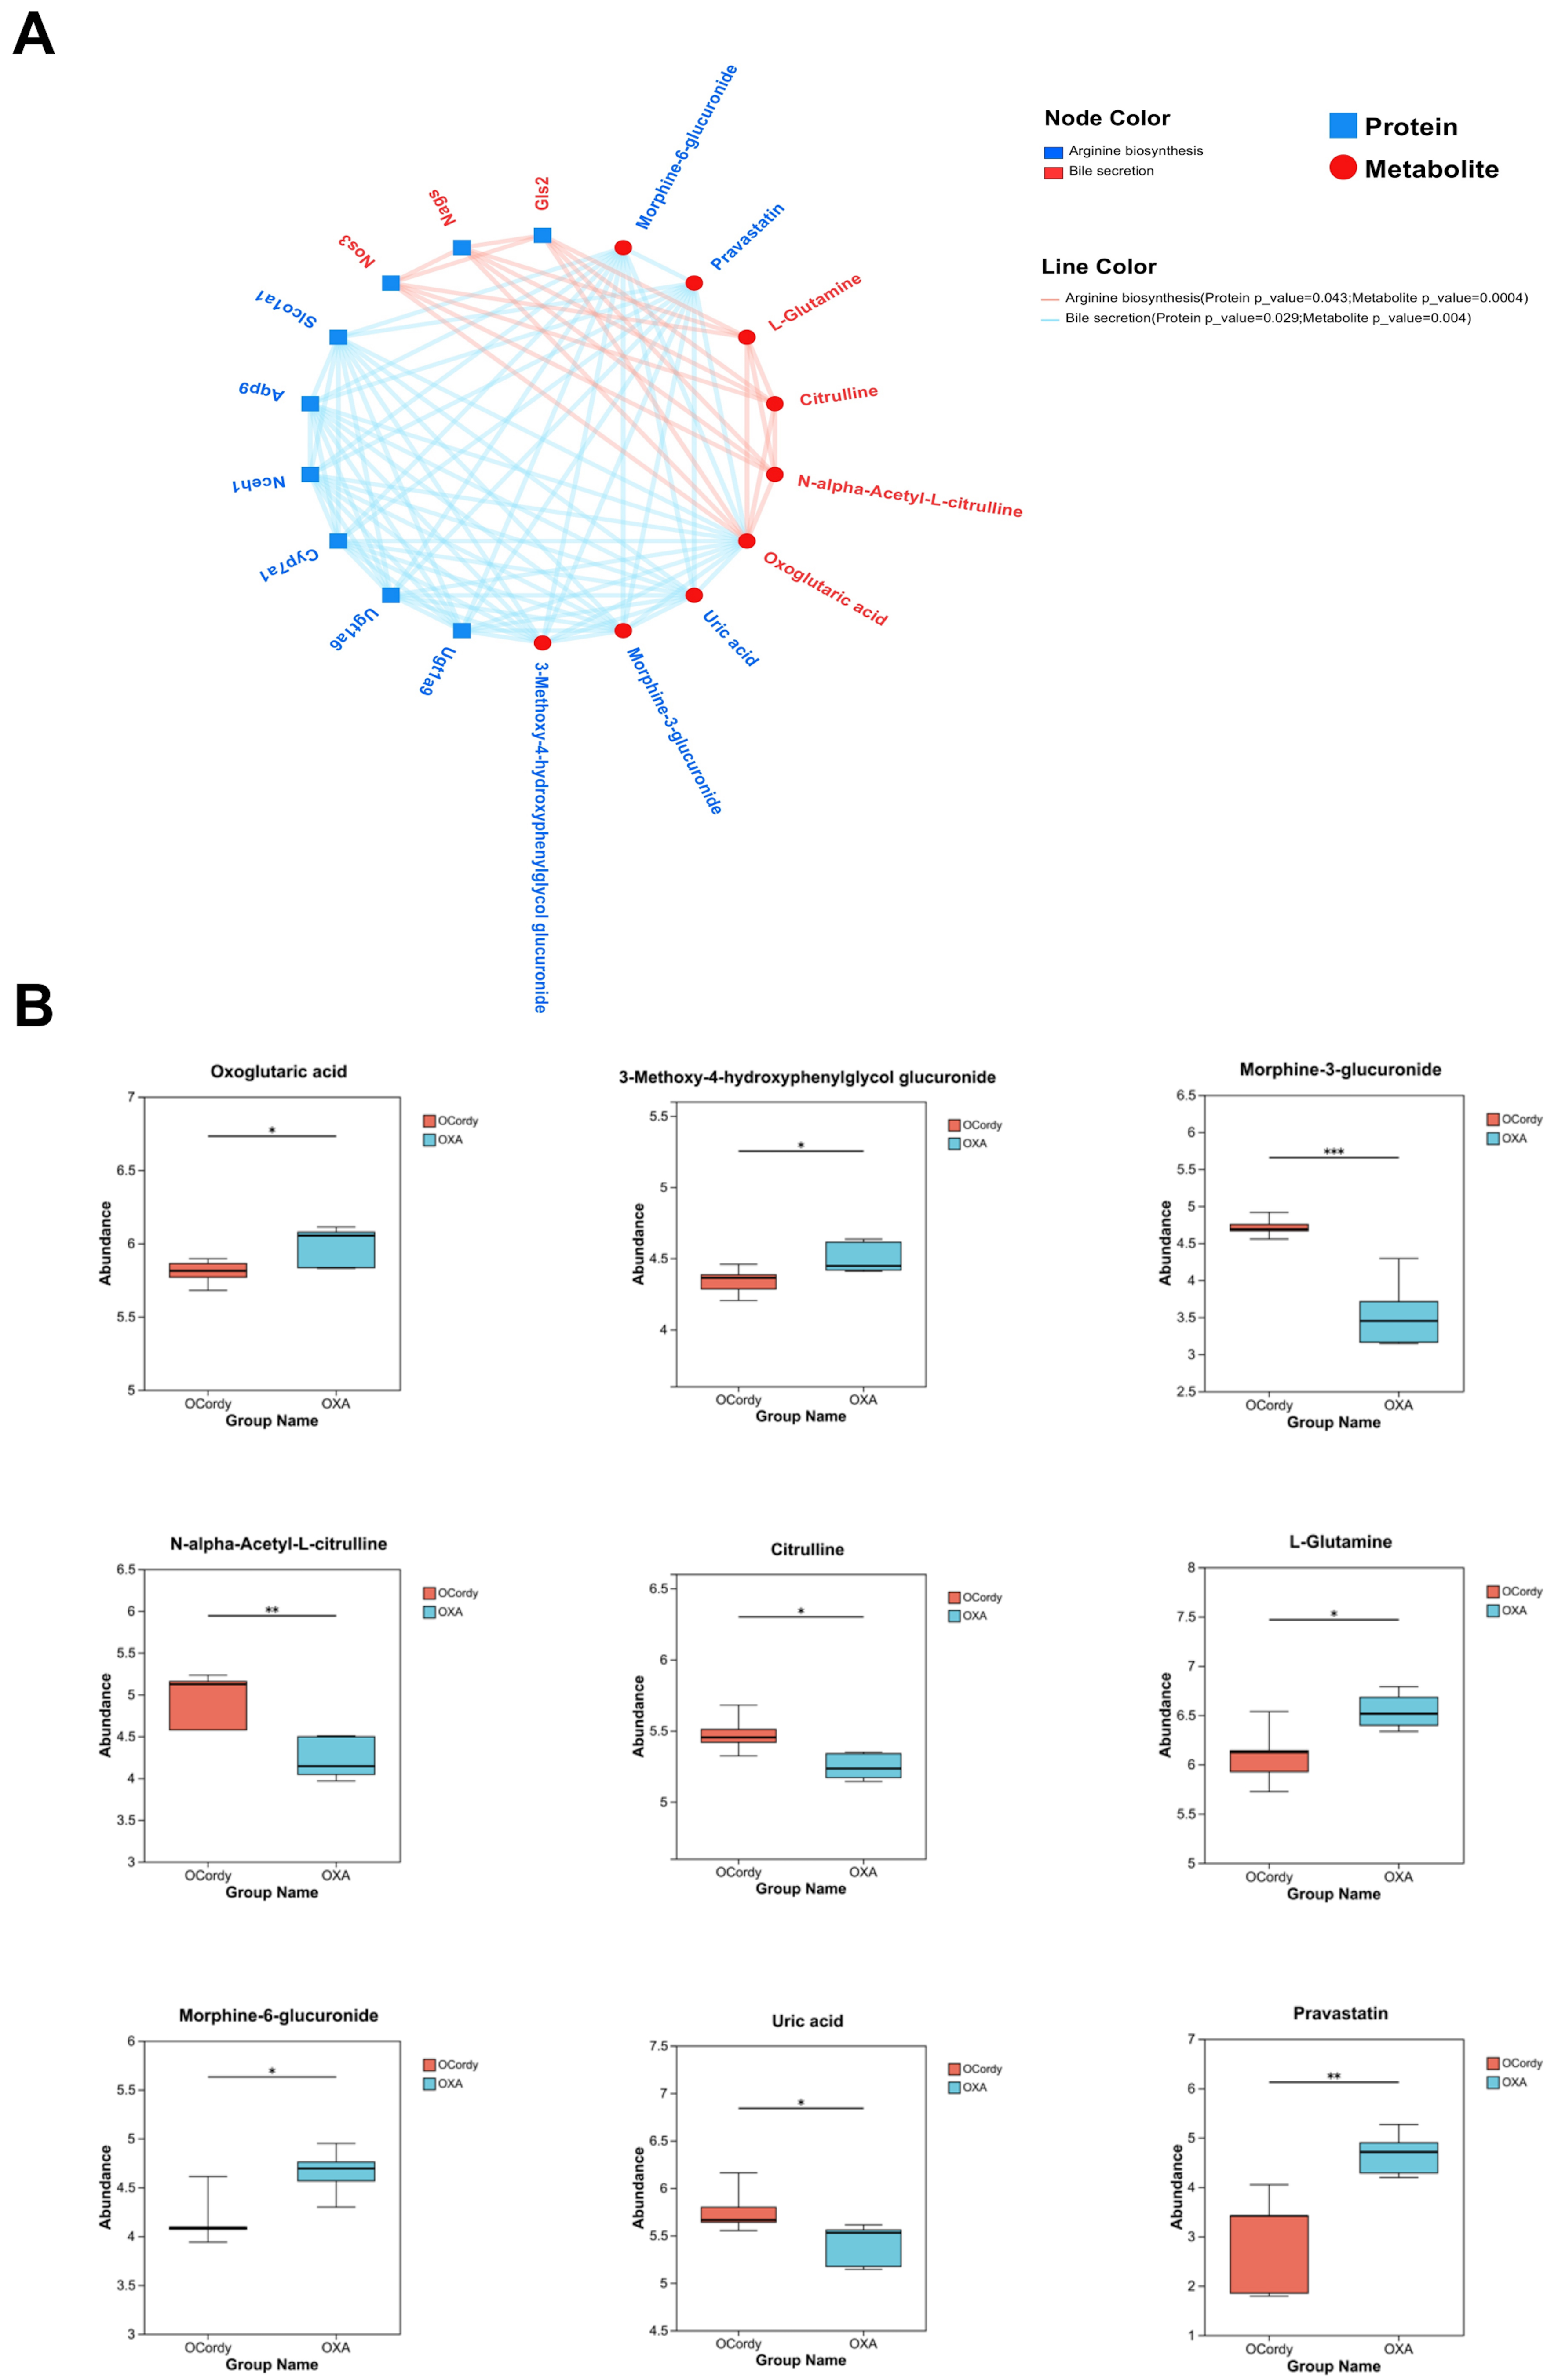
Figure 11. Integrated Analysis of Proteomic and Metabolomic Profiles in Hepatic Tissues from Control, OXA, and OCordy Mouse Groups. (A) Protein-metabolite interaction network for arginine biosynthesis and bile secretion pathways (red edges: arginine biosynthesis; blue edges: bile secretion); (B) Box plots of relative abundances for key differential metabolites (e.g., oxoglutaric acid, citrulline) in OXA and OCordy groups. Significance is denoted by asterisks. (*P < 0.05, **P < 0.01, ***P < 0.001). OXA: Oxaliplatin; OCordy: Oxaliplatin plus cordycepin.
DEPs related to arginine biosynthesis and bile secretion in OCordy vs. OXA groups
| Function | Symbol | Protein name | FC | Log2FC | P value | Regulate |
| Participate in arginine biosynthesis | Ugt1a9 | UDP-glucuronosyltransferase 1A9 | 1.6334 | 0.7079 | 0.006366 | Up |
| Ugt1a6 | UDP-glucuronosyltransferase 1-6 | 1.528 | 0.6116 | 0.01969 | Up | |
| Aqp9 | Aquaporin-9 | 0.4708 | -1.0868 | 0.01991 | Down | |
| Cyp7a1 | Cytochrome P450 7A1 | 2.8255 | 1.4985 | 0.01604 | Up | |
| Nceh1 | Neutral cholesterol ester hydrolase 1 | 0.644 | -0.6349 | 0.003558 | Down | |
| Slco1a1 | Solute carrier organic anion transporter family member 1A1 | 2.7742 | 1.4721 | 0.03752 | Up | |
| Participate in bile secretion | Nos3 | Nitric oxide synthase 3 | 0.6158 | -0.6995 | 0.02419 | Down |
| Nags | N-acetylglutamate synthase, mitochondrial | 1.6452 | 0.7183 | 0.02317 | Up | |
| Gls2 | Glutaminase liver isoform, mitochondrial | 1.6999 | 0.7654 | 0.009084 | Up |
DMs related to arginine biosynthesis and bile secretion in OCordy vs. OXA groups
| Function | Metabolite | P value | FC | Log2FC | Regulate |
| Participate in arginine biosynthesis | Pravastatin | 0.007569 | 0.6219 | -0.6852 | down |
| Morphine-3-glucuronide | 0.0007526 | 1.3275 | 0.4087 | up | |
| Morphine-6-glucuronide | 0.01454 | 0.8938 | -0.1619 | down | |
| 3-Methoxy-4-hydroxyphenylglycol glucuronide | 0.03651 | 0.9634 | -0.0538 | down | |
| Uric acid | 0.04018 | 1.0666 | 0.0931 | up | |
| Participate in bile secretion | N-alpha-Acetyl-L-citrulline | 0.005327 | 1.166 | 0.2215 | up |
| L-Glutamine | 0.02156 | 0.9308 | -0.1035 | down | |
| Citrulline | 0.01332 | 1.0436 | 0.0616 | up | |
| Participate in arginine biosynthesis and bile secretion | Oxoglutaric acid | 0.04016 | 0.9704 | -0.0433 | down |
DISCUSSION
OXA-induced acute DIFLD mouse model
DILI limits antitumor drug application[24,25]. Hepatotoxicity of OXA is complex, inducing steatosis and steatohepatitis[26-28], aligning with DIFLD and adversely affecting prognosis. Thus, precise classification and hepatoprotective management are essential. DIFLD, a DILI subtype, is often asymptomatic in the earlier stages, threatening life[10]. Therefore, early detection is critical; however, non-invasive tests (ultrasound, magnetic resonance) lack sensitivity for mild steatosis (5%-30%). In contrast, liver biopsy, the gold standard, is costly, invasive, and unsuitable for screening/follow-up[29].
Although animal models have overcome clinical limitations, OXA-induced acute DIFLD models are scarce. Our team successfully developed such a model, characterized by weight loss, sparse hair, reduced activity, elevated liver index [Figure 5A and B], abnormal liver function [Figure 5E and F; P < 0.01], and steatosis/injury [Figure 5C and D], consistent with DIFLD pathophysiology.
Mechanism of OXA-induced DIFLD
Currently, the pathophysiological mechanism of OXA-induced DIFLD is unclear. Exploring molecular mechanisms and identifying drug interventions to mitigate OXA-induced liver injury are clinically significant.
Our retrospective clinical study confirmed that OCG substantially increased the risk of inflammatory necrosis, fibrosis, and steatosis in the non-tumor liver tissues of patients, with a proportion as high as 82.42% [Figure 2], providing clinical evidence for OXA-induced DIFLD. In the animal model, OXA treatment led to hepatic lipid accumulation, including TG, TC, and LDL (Figure 5G-I; all P < 0.05). In contrast, serum lipid levels decreased (Figure 5J-L; all P < 0.05). OXA also induced severe oxidative stress, as shown by increased MDA (Figure 5M, P < 0.01) and decreased GSH-PX (Figure 5N, P < 0.001). These findings suggest that OXA induced significant hepatic lipid deposition and oxidative stress responses. Bioinformatics analysis of DEPs and DMs between the OXA and control groups revealed significant changes in metabolites/proteins [Figures 6A-C and 9A-C], with lipids ranking second among DMs [Figure 6E]. Multiple metabolites related to lipid metabolism and oxidative stress exhibited significant differences [Figure 7C]; KEGG analysis showed enrichment in lipid metabolism, oxidative stress, and drug metabolism pathways (Figure 8B and 9F, P < 0.05). This indicates that the mechanism of OXA-induced DIFLD involves lipid metabolism disorders and oxidative stress.
Protective effect of cordycepin on OXA-induced DIFLD
Cordycepin, a key Cordyceps component, has anti-hyperlipidemic, antioxidant, anti-inflammatory, and anti-tumor effects[22,30-33]. It reduces TG in diet-induced NASH mice[20,21] and inhibits lipid synthesis in ob/ob mice[34], showing potential for OXA-induced DIFLD, although no prior study has reported this.
In this study, by observing the intervention effect of cordycepin on OXA-induced acute DIFLD mice induced by OXA, we found that cordycepin significantly alleviated OXA-induced DIFLD. This is manifested by a significant decrease in the liver index of mice (Figure 5B; P < 0.01), hepatic cell injury, and steatosis [Figure 5C and D], as well as a significant improvement in liver function indicators (ALT, AST; Figure 5E and F; all P < 0.05) following cordycepin intervention. Meanwhile, cordycepin, to some extent, alleviated systemic symptoms, such as weight loss, sparse hair, and reduced activity caused by OXA [Figure 5A], indicating favorable hepatoprotective effects and safety. Furthermore, in the OCordy group, hepatic lipid levels (TG, TC, and LDL) were significantly reduced (Figure 5G-I; all P < 0.05). Serum lipid levels (TC and LDL) were significantly increased (Figure 5K and L; all P < 0.05). Oxidative stress markers were also improved, as indicated by decreased MDA and increased GSH-PX and SOD (Figure 5M and N; all P < 0.05). These findings suggest that cordycepin exerts hepatoprotective effects by regulating lipid metabolism and oxidative stress.
Protective mechanism of cordycepin on OXA-induced DIFLD
To further explore the protective mechanism of cordycepin on OXA-induced DIFLD, we conducted bioinformatics analysis of DEPs and DMs in the OCordy and OXA groups by integrating metabolomics and proteomics data. We found that cordycepin altered metabolite/protein expression, with lipids dominating DMs (27.04%; Figure 6F), suggesting hepatoprotection via lipid restoration. VIP analysis revealed significant differences in lipid/oxidative stress-related metabolites [Figure 7D].
Mfuzz analysis revealed cordycepin reversed OXA-induced metabolic/protein dysregulation [Figures 8A and 9E]. KEGG pathway enrichment analysis demonstrated that DEPs and DMs in the OCordy and OXA groups were primarily enriched in pathways related to lipid metabolism, oxidative stress, amino acid metabolism, and drug biodegradation and metabolism (Figures 8C and 9G; all P < 0.05), further confirming that cordycepin restores pathways related to lipid metabolism and oxidative stress.
Finally, we conducted an integrated analysis of the proteomics and non-targeted metabolomics data of the OCordy and OXA groups, discovering that DEPs and DMs in the OCordy and OXA groups were significantly enriched in the arginine biosynthesis and bile secretion pathways (Figure 10E; both P < 0.05). Current research has found that these two pathways interact with each other, forming an important network that regulates lipid metabolism and oxidative stress and is instrumental in the regulation of the occurrence and development of non-alcoholic fatty liver disease. That is, arginine generates Nitric oxide (NO) through the NO synthase pathway, exerting anti-inflammatory and antioxidant effects; meanwhile, its metabolite bile acid, as an Farnesoid X receptor (FXR) ligand, regulates lipid homeostasis and inflammatory responses[35-40]. As an FXR ligand, bile acid further regulates lipid metabolism, insulin sensitivity, and inflammatory responses[41,42].
Correlation network analysis of these two pathways and their related DEPs and DMs revealed that oxoglutaric acid is closely associated with both arginine biosynthesis and bile secretion [Figure 11A], suggesting its vital role in the protective mechanism of cordycepin. Oxoglutaric acid is an important intermediate in the tricarboxylic acid cycle and participates in processes such as energy metabolism, lipid metabolism, amino acid metabolism, and embryonic development[43,44]. Research has determined its crucial role in the animal antioxidant process by regulating mitochondrial dynamics and autophagy, maintaining mitochondrial homeostasis, enhancing the activity of antioxidant enzymes, and reducing oxidative stress levels[45]. Additionally, α-ketoglutarate improves hepatic lipid deposition, mitochondrial dysfunction, and loss of redox capacity, and alleviates dyslipidemia and non-alcoholic fatty liver disease caused by hyperlipidemia-induced endothelial injury activating the AMPK–PGC-1α/Nrf2 (AMP-activated protein kinase–peroxisome proliferator-activated receptor gamma coactivator 1-alpha/nuclear factor erythroid 2-related factor 2) pathway[46]. In this study, oxoglutaric acid was downregulated in the OCordy group compared to that in OXA group (Figure 11B; P < 0.05), with a difference of approximately 1.03 [Table 3]. We hypothesize that cordycepin promotes the consumption of oxoglutaric acid, thereby directing it toward downstream arginine and bile acid metabolism pathways and activating a multi-level protective mechanism, including antioxidation, inhibition of lipid synthesis, and enhanced excretion. Although the magnitude of change is relatively small, oxoglutaric acid functions as an upstream hub metabolite, and even minor fluctuations in its level may trigger substantial biological cascade effects.
The findings of this study corroborate the conclusions in previous literature that cordycepin improves liver injury through regulation of pathways such as AMPK/Nrf2, Toll-like receptor 4 (TLR4), and Nuclear factor kappa-light-chain-enhancer of activated B cells (NF-κB)[20,21,47]. This study is the first to reveal that cordycepin may exert a protective effect in OXA-induced DIFLD by precisely regulating the novel axis of α-ketoglutarate - arginine/bile acid, providing a new dimension for understanding its pharmacological mechanism.
Although this study has comprehensively elucidated the characteristics of OXA-induced DIFLD and the protective mechanism of cordycepin, certain limitations persist. First, the single-center retrospective design may introduce selection bias and lacks long-term follow-up data, rendering it impossible to directly evaluate the impact of DIFLD on patient survival. Second, the mechanism study predominantly relies on multi-omics correlation analysis, lacking direct molecular biological validation of the involvement of the α-ketoglutaric acid axis. Future investigations should prioritize conducting multicenter, prospective clinical trials with extended follow-up to corroborate these findings and assess the influence of DIFLD on long-term survival outcomes. Furthermore, additional molecular biology experiments are warranted to functionally authenticate the causal role of the α-ketoglutarate axis and to elucidate the precise downstream targets of cordycepin, thereby facilitating its clinical translation as a therapeutic agent for OXA-induced hepatotoxicity.
Conclusion
Both OXA-induced SOS and DIFLD significantly affect patient prognosis, but their pathological characteristics are markedly different, and there is an urgent clinical need for precise classification and management.
Our retrospective clinical study has confirmed that OCG significantly increases the risk of inflammatory necrosis, fibrosis, and steatosis in the non-tumor liver tissues of patients, providing solid clinical evidence for OXA-induced DIFLD. Additionally, this study successfully established an acute DIFLD mouse model induced by OXA and demonstrated that cordycepin can significantly ameliorate its pathological and biochemical abnormalities. Multi-omics analysis further revealed that cordycepin exerts its protective effects by regulating lipid metabolism, oxidative stress, particularly arginine biosynthesis, and bile secretion pathways.
As a naturally derived bioactive compound, cordycepin exhibits favorable pharmacokinetic profiles, including high bioavailability and safety. Its multifaceted therapeutic effects, including anti-inflammatory, antioxidant, metabolic regulatory, and antitumor properties, strongly align with the clinical demands of chemotherapy. Notably, this is the first systematic investigation to elucidate the protective role of cordycepin in OXA-induced DIFLD, thereby expanding the therapeutic potential of traditional Chinese medicine in DILI and providing a scientific framework for OXA-associated hepatotoxicity precision-based stratification and management.
DECLARATIONS
Authors’ contributions
Conceptualization: Liao X
Data curation: Pan M, Lin Y
Formal analysis: Lin Y
Funding acquisition: Liao X
Investigation: Tan D, Li T
Methodology: Tan D, Li T
Project administration: Liao X
Resources: Lin Y
Software: Pan M
Supervision: Pan M, Wang Z
Validation: Lin Y, Lu Y
Visualization: YL, Lai H
Writing-original draft: Pan M
Writing-review and editing: Lin Y
Availability of data and materials
The mass spectrometry-based proteomics data generated in this study have been deposited in the ProteomeXchange Consortium via the PRIDE repository under the dataset identifier PXD068067. The metabolomics data have been deposited in the MetaboLights repository under the study identifier MTBLS12938 (https://www.ebi.ac.uk/metabolights/MTBLS12938). All other original experimental data supporting the findings of this study are available from the corresponding author upon reasonable request.
AI and AI-assisted tools statement
During the preparation of this manuscript, the AI tool Doubao (ByteDance) (released 2023-08, accessed 2025-8-20) was used solely for preliminary refinement of caption language and optimization of content layout. All visual elements included in Figure 1 and the graphical abstract (e.g., liver, mouse, and cellular structures) were obtained from the standard image library available at doubao.com. The authors confirm that the use of these materials complies with the platform’s copyright and licensing policies for academic publication. The tool did not influence the study design, data collection, analysis, interpretation, or the scientific content of the work. All authors take full responsibility for the accuracy, integrity, and final content of the manuscript.
Financial support and sponsorship
This study was supported by the Guangxi Natural Science Foundation (No. 2023GXNSFAA026156), the Guangxi Key Research and Development Program (No. GuiKe AB25069073), the Guangxi Medical and Health Key Discipline Construction Project (No. 2022-1), the Traditional Chinese Medicine Project of the Guangxi Zhuang Autonomous Region Administration (No. GZSY23-67), the Education Department Project (No. 2017KY0095), the self-funded project of the Administration of Traditional Chinese Medicine of Guangxi (No. GXZYA20230333), and the Guangxi Natural Science Foundation (No. 2025GXNSFAA069760).
Conflicts of interest
All authors declared that there are no conflicts of interest.
Ethical approval and consent to participate
The research protocol was approved by the Science and Technology Ethical Review Committee of Guangxi Medical University Cancer Hospital (Approval No. KY2025683). All patients involved in the retrospective study provided written informed consent for the use of their clinical data and samples for research purposes. Animal experiments were also approved by the same committee (Approval No. KY2025683).
Consent for publication
Not applicable.
Copyright
© The Author(s) 2026.
Supplementary Materials
REFERENCES
1. Kleiner DE, Chalasani NP, Lee WM, et al.; Drug-Induced Liver Injury Network (DILIN). Hepatic histological findings in suspected drug-induced liver injury: systematic evaluation and clinical associations. Hepatology. 2014;59:661-70.
2. Tian QJ, Zhao XY, Wang Y, et al. Histologic pattern is better correlated with clinical outcomes than biochemical classification in patients with drug-induced liver injury. Mod Pathol. 2019;32:1795-805.
3. Andrade RJ, Chalasani N, Björnsson ES, et al. Drug-induced liver injury. Nat Rev Dis Primers. 2019;5:58.
4. Zhao J, van Mierlo KMC, Gómez-Ramírez J, et al.; Chemotherapy-Associated Liver Injury (CALI) consortium. Systematic review of the influence of chemotherapy-associated liver injury on outcome after partial hepatectomy for colorectal liver metastases. Br J Surg. 2017;104:990-1002.
5. Zhu C, Ren X, Liu D, Zhang C. Oxaliplatin-induced hepatic sinusoidal obstruction syndrome. Toxicology. 2021;460:152882.
6. Tabassum H, Waseem M, Parvez S, Qureshi MI. Oxaliplatin-induced oxidative stress provokes toxicity in isolated rat liver mitochondria. Arch Med Res. 2015;46:597-603.
7. Kim HP, Navarro V, Zacks S, Odin J, Kleiner DE, Hayashi PH; Drug-Induced Liver Injury Network Investigators. The clinical spectrum and diagnosis of oxaliplatin liver injury in the era of nonalcoholic fatty liver disease. Clin Gastroenterol Hepatol. 2021;19:2199-201.
8. Mahlmann JC, Wirth TC, Hartleben B, et al. Chemotherapy and hepatic steatosis: impact on postoperative morbidity and survival after liver resection for colorectal liver metastases. Visc Med. 2021;37:198-205.
9. Vigano L, De Rosa G, Toso C, et al. Reversibility of chemotherapy-related liver injury. J Hepatol. 2017;67:84-91.
10. López-Pascual E, Rienda I, Perez-Rojas J, et al. Drug-induced fatty liver disease (DIFLD): a comprehensive analysis of clinical, biochemical, and histopathological data for mechanisms identification and consistency with current adverse outcome pathways. Int J Mol Sci. 2024;25:5203.
11. Fernandez FG, Ritter J, Goodwin JW, Linehan DC, Hawkins WG, Strasberg SM. Effect of steatohepatitis associated with irinotecan or oxaliplatin pretreatment on resectability of hepatic colorectal metastases. J Am Coll Surg. 2005;200:845-53.
12. Vauthey JN, Pawlik TM, Ribero D, et al. Chemotherapy regimen predicts steatohepatitis and an increase in 90-day mortality after surgery for hepatic colorectal metastases. J Clin Oncol. 2006;24:2065-72.
13. Morawska I, Pasicz K, Cieszanowski A. Biomarkers of systemic treatment response: MR images of intratumoral fat deposition in colorectal liver metastases (CRLM) after chemotherapy. Int J Colorectal Dis. 2024;39:185.
14. Lin Y, Li Y, Hu X, et al. The hepatoprotective role of reduced glutathione and its underlying mechanism in oxaliplatin-induced acute liver injury. Oncol Lett. 2018;15:2266-72.
15. Lu Y, Wu S, Xiang B, Li L, Lin Y. Curcumin attenuates oxaliplatin-induced liver injury and oxidative stress by activating the Nrf2 pathway. Drug Des Devel Ther. 2020;14:73-85.
16. Aloia T, Sebagh M, Plasse M, et al. Liver histology and surgical outcomes after preoperative chemotherapy with fluorouracil plus oxaliplatin in colorectal cancer liver metastases. J Clin Oncol. 2006;24:4983-90.
17. Rubbia-Brandt L, Lauwers GY, Wang H, Majno PE, Tanabe K, Zhu AX, et al. Sinusoidal obstruction syndrome and nodular regenerative hyperplasia are frequent oxaliplatin-associated liver lesions and partially prevented by bevacizumab in patients with hepatic colorectal metastasis. Histopathology. 2010;56:430-9.
18. Makowiec F, Möhrle S, Neeff H, et al. Chemotherapy, liver injury, and postoperative complications in colorectal liver metastases. J Gastrointest Surg. 2011;15:153-64.
19. Li M, Luo Q, Tao Y, Sun X, Liu C. Pharmacotherapies for drug-induced liver injury: a current literature review. Front Pharmacol. 2021;12:806249.
20. Gong X, Li T, Wan R, Sha L. Cordycepin attenuates high-fat diet-induced non-alcoholic fatty liver disease via down-regulation of lipid metabolism and inflammatory responses. Int Immunopharmacol. 2021;91:107173.
21. Lan T, Yu Y, Zhang J, et al. Cordycepin ameliorates nonalcoholic steatohepatitis by activation of the AMP-activated protein kinase signaling pathway. Hepatology. 2021;74:686-703.
22. Chen Y, Wang P, Zhang M, Yang H, Liang B. Mechanism analysis of the effect of cordycepin on colorectal cancer via network pharmacology and experiment. Comb Chem High Throughput Screen. 2026;29:411-22.
23. Rui F, Yeo YH, Xu L, et al. Development of a machine learning-based model to predict hepatic inflammation in chronic hepatitis B patients with concurrent hepatic steatosis: a cohort study. EClinicalMedicine. 2024;68:102419.
24. Mudd TW, Guddati AK. Management of hepatotoxicity of chemotherapy and targeted agents. Am J Cancer Res. 2021;11:3461-74.
25. Sung H, Ferlay J, Siegel RL, et al. Global cancer statistics 2020: GLOBOCAN estimates of incidence and mortality worldwide for 36 cancers in 185 countries. CA Cancer J Clin. 2021;71:209-49.
26. Keizman D, Maimon N, Ish-Shalom M, Buchbut D, Inbar M, Klein B, et al. An animal model for chemotherapy-associated steatohepatitis and its prevention by the oral administration of fatty acid bile acid conjugate. Cancer. 2010;116:251-5.
27. Schwingel TE, Klein CP, Nicoletti NF, et al. Effects of the compounds resveratrol, rutin, quercetin, and quercetin nanoemulsion on oxaliplatin-induced hepatotoxicity and neurotoxicity in mice. Naunyn Schmiedebergs Arch Pharmacol. 2014;387:837-48.
28. Lu Y, Lin Y, Huang X, Wu S, Wei J, Yang C. Oxaliplatin aggravates hepatic oxidative stress, inflammation and fibrosis in a non‑alcoholic fatty liver disease mouse model. Int J Mol Med. 2019;43:2398-408.
29. Green CJ, Parry SA, Gunn PJ, et al. Studying non-alcoholic fatty liver disease: the ins and outs of in vivo, ex vivo and in vitro human models. Horm Mol Biol Clin Investig. 2018;41:/j/hmbci.
30. Limanaqi F, Busceti CL, Biagioni F, et al. Cell clearing systems as targets of polyphenols in viral infections: potential implications for COVID-19 pathogenesis. Antioxidants. 2020;9:1105.
31. Ashraf SA, Elkhalifa AEO, Siddiqui AJ, et al. Cordycepin for health and wellbeing: a potent bioactive metabolite of an entomopathogenic Cordyceps medicinal fungus and its nutraceutical and therapeutic potential. Molecules. 2020;25:2735.
32. Qing R, Huang Z, Tang Y, Xiang Q, Yang F. Cordycepin negatively modulates lipopolysaccharide-induced cytokine production by up-regulation of heme oxygenase-1. Int Immunopharmacol. 2017;47:20-7.
33. Cao T, Xu R, Xu Y, Liu Y, Qi D, Wan Q. The protective effect of Cordycepin on diabetic nephropathy through autophagy induction in vivo and in vitro. Int Urol Nephrol. 2019;51:1883-92.
34. Zhong LP, Li J, Wang FZ, Zhu HB, Hou XJ. Protective effect and underlying mechanism of cordycepin on non-alcoholic fatty liver in ob/ob mice. Yao Xue Xue Bao 2017;52:106-12.
35. Caldwell RB, Toque HA, Narayanan SP, Caldwell RW. Arginase: an old enzyme with new tricks. Trends Pharmacol Sci. 2015;36:395-405.
36. Suschek CV, Schnorr O, Hemmrich K, et al. Critical role of L-arginine in endothelial cell survival during oxidative stress. Circulation. 2003;107:2607-14.
37. Boga S, Alkim H, Koksal AR, et al. Increased plasma levels of asymmetric dimethylarginine in nonalcoholic fatty liver disease: relation with insulin resistance, inflammation, and liver histology. J Investig Med. 2015;63:871-7.
38. Abu-Serie MM, El-Gamal BA, El-Kersh MA, El-Saadani MA. Investigation into the antioxidant role of arginine in the treatment and the protection for intralipid-induced non-alcoholic steatohepatitis. Lipids Health Dis. 2015;14:128.
39. Yun C, Yan S, Liao B, et al. The microbial metabolite agmatine acts as an FXR agonist to promote polycystic ovary syndrome in female mice. Nat Metab. 2024;6:947-62.
40. Kasumov T, Edmison JM, Dasarathy S, Bennett C, Lopez R, Kalhan SC. Plasma levels of asymmetric dimethylarginine in patients with biopsy-proven nonalcoholic fatty liver disease. Metabolism. 2011;60:776-81.
41. Chávez-Talavera O, Tailleux A, Lefebvre P, Staels B. Bile acid control of metabolism and inflammation in obesity, type 2 diabetes, dyslipidemia, and nonalcoholic fatty liver disease. Gastroenterology. 2017;152:1679-94.e3.
42. Yamamoto S, Sato I, Fukuhama N, et al. Bile acids aggravate nonalcoholic steatohepatitis and cardiovascular disease in SHRSP5/Dmcr rat model. Exp Mol Pathol. 2020;114:104437.
43. Zhang Z, He C, Zhang L, et al. Alpha-ketoglutarate affects murine embryo development through metabolic and epigenetic modulations. Reproduction. 2019;158:123-33.
44. Zhang ZH, Yang CT, Su XR, et al. CCK1R2R-/- ameliorates myocardial damage caused by unpredictable stress via altering fatty acid metabolism. Stress. 2023;26:2254566.
45. Liu G, Lu J, Sun W, et al. Alpha-ketoglutaric acid attenuates oxidative stress and modulates mitochondrial dynamics and autophagy of spleen in a piglet model of lipopolysaccharide-induced sepsis. Free Radic Biol Med. 2024;214:80-6.
46. Cheng D, Zhang M, Zheng Y, et al. α-Ketoglutarate prevents hyperlipidemia-induced fatty liver mitochondrial dysfunction and oxidative stress by activating the AMPK-pgc-1α/Nrf2 pathway. Redox Biol. 2024;74:103230.
Cite This Article
How to Cite
Download Citation
Export Citation File:
Type of Import
Tips on Downloading Citation
Citation Manager File Format
Type of Import
Direct Import: When the Direct Import option is selected (the default state), a dialogue box will give you the option to Save or Open the downloaded citation data. Choosing Open will either launch your citation manager or give you a choice of applications with which to use the metadata. The Save option saves the file locally for later use.
Indirect Import: When the Indirect Import option is selected, the metadata is displayed and may be copied and pasted as needed.
About This Article
Copyright

Data & Comments
Data
0


Comments
Comments must be written in English. Spam, offensive content, impersonation, and private information will not be permitted. If any comment is reported and identified as inappropriate content by OAE staff, the comment will be removed without notice. If you have any queries or need any help, please contact us at [email protected].