


fig6
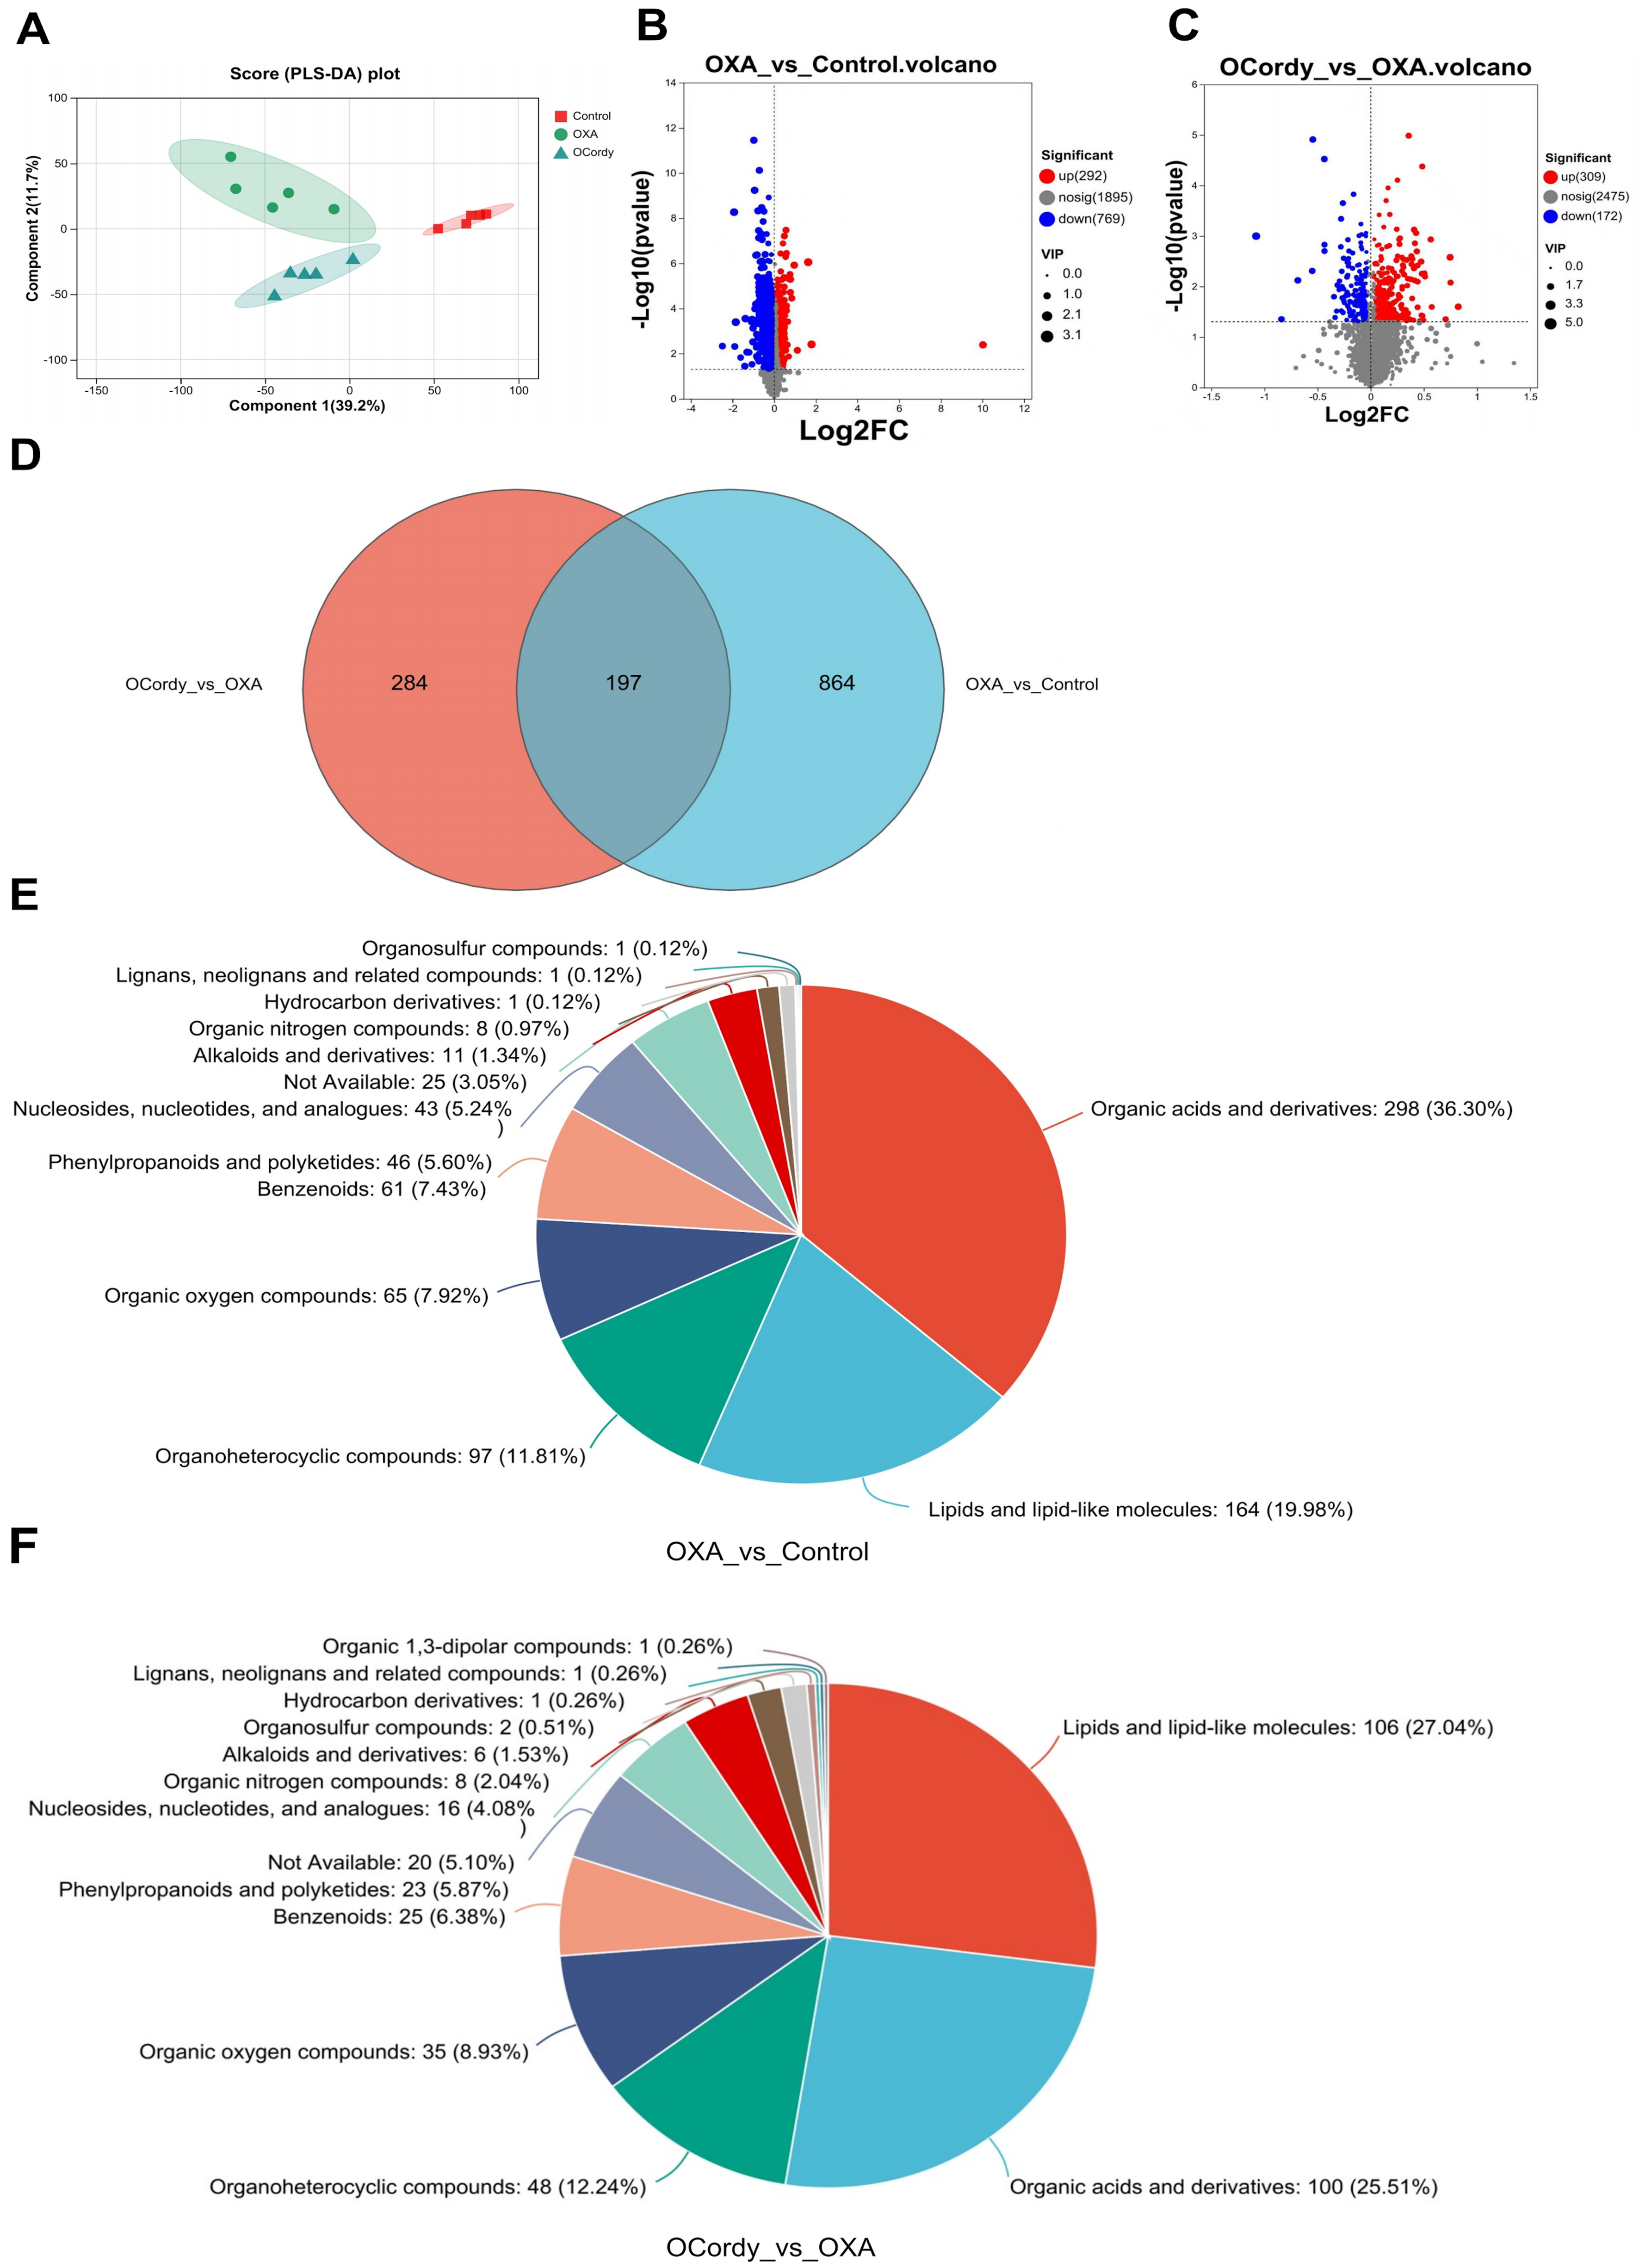
Figure 6. Non-targeted Metabolomic Analysis of Hepatic Tissues from Control, OXA, and OCordy Mouse Groups. (A) PLS-DA score plot showing distinct clustering among Control, OXA, and OCordy groups; (B and C) Volcano plots of differentially expressed metabolites in OXA-Control (B) and OCordy-OXA (C) comparisons (red: upregulated; blue: downregulated); (D) Venn diagram identifying 197 common differential metabolites between the two comparisons; (E and F) Pie charts illustrating the distribution of metabolite classes in OXA-Control (E) and OCordy-OXA (F) groups. OXA: Oxaliplatin; OCordy: Oxaliplatin plus cordycepin; PLS-DA: partial least squares discriminant analysis.


