


fig4
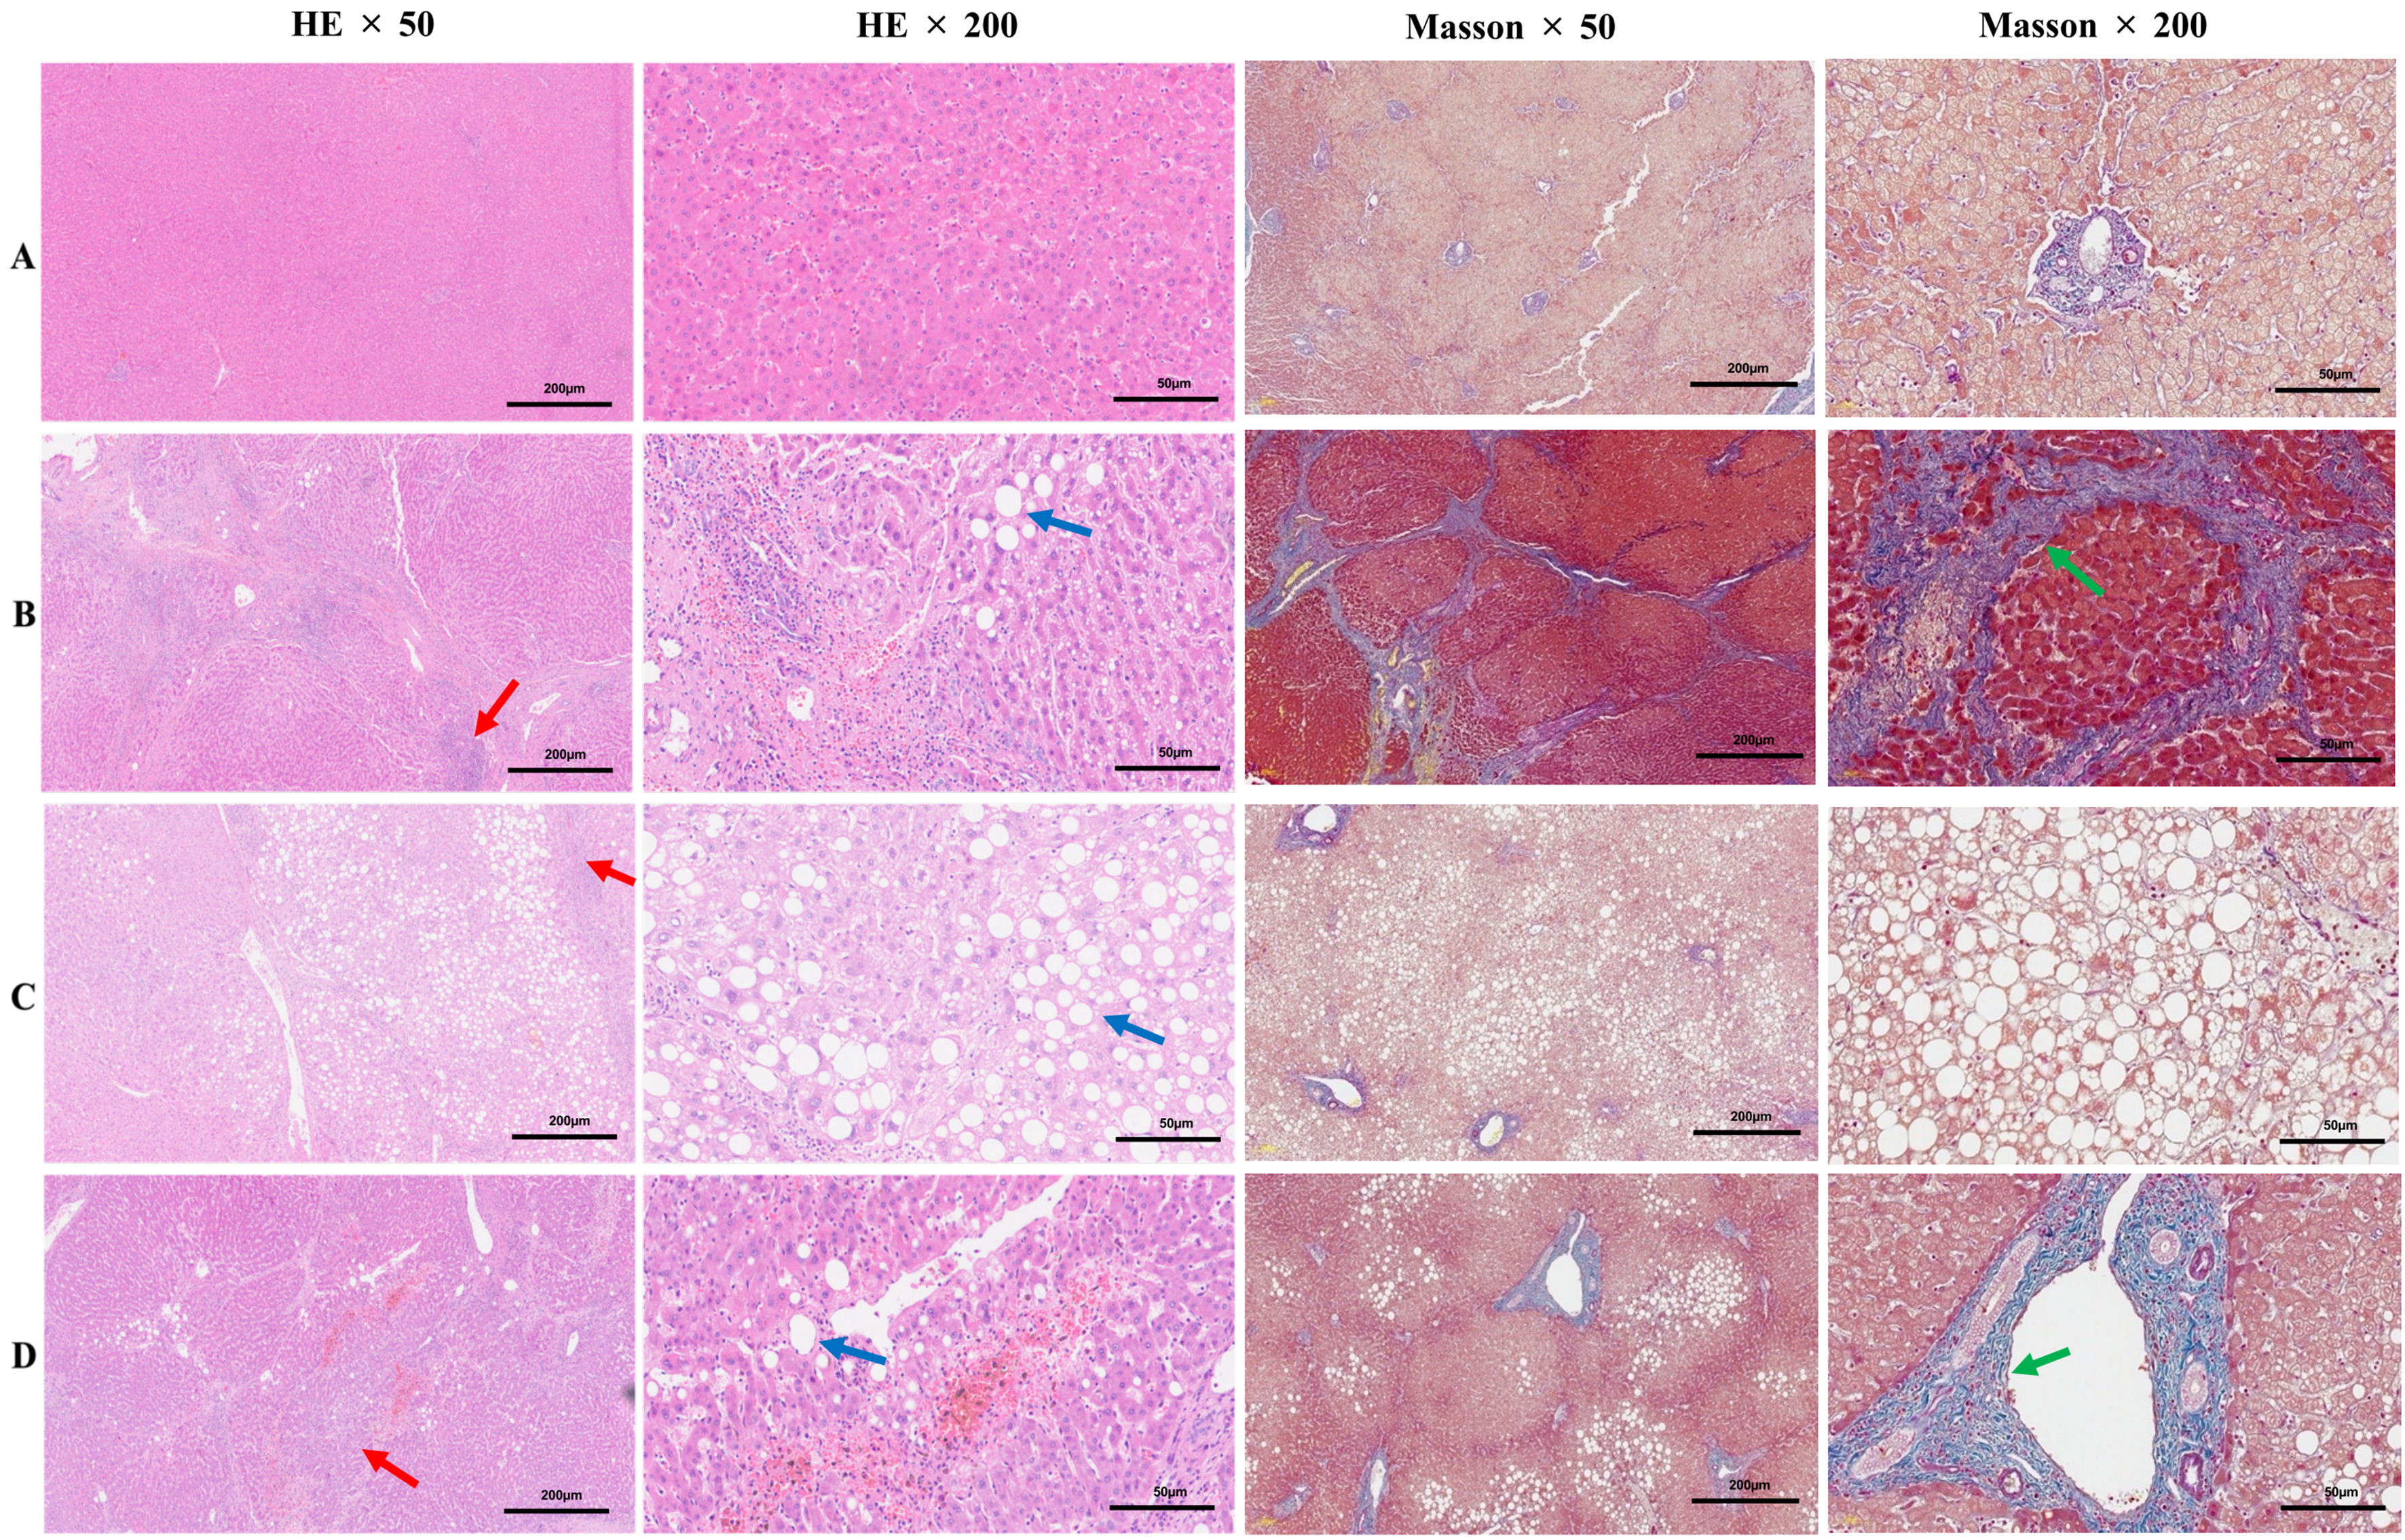
Figure 4. Representative hepatic histopathological stained with HE and Masson’s trichrome. (A) (NCG group): Normal hepatic tissue showing no evidence of inflammation, fibrosis, or steatosis (G0S0F0); (B) (OCG group): Severe inflammatory infiltration and extensive fibrosis (G3S4), with mild steatosis (F1); (C) (OCG group): Marked macrovesicular steatosis (F3), with minimal inflammatory changes (G1S0); (D) (OCG group): Moderate inflammatory activity and fibrosis (G2S2), with mild steatosis (F1). (Note: The first and third panels on the left: ×50 magnification; the second and fourth panels on the left: ×200 magnification; red arrow: inflammatory changes; blue arrow: steatosis; green arrow: fibrosis). HE: Hematoxylin and eosin; NCG: Non-chemotherapy group; OCG: Oxaliplatin-based chemotherapy group; G: grade of hepatic inflammation (G0-G3); S: stage of hepatic fibrosis (S0-S4); F: grade of hepatic steatosis (F0-F3).


