


fig9
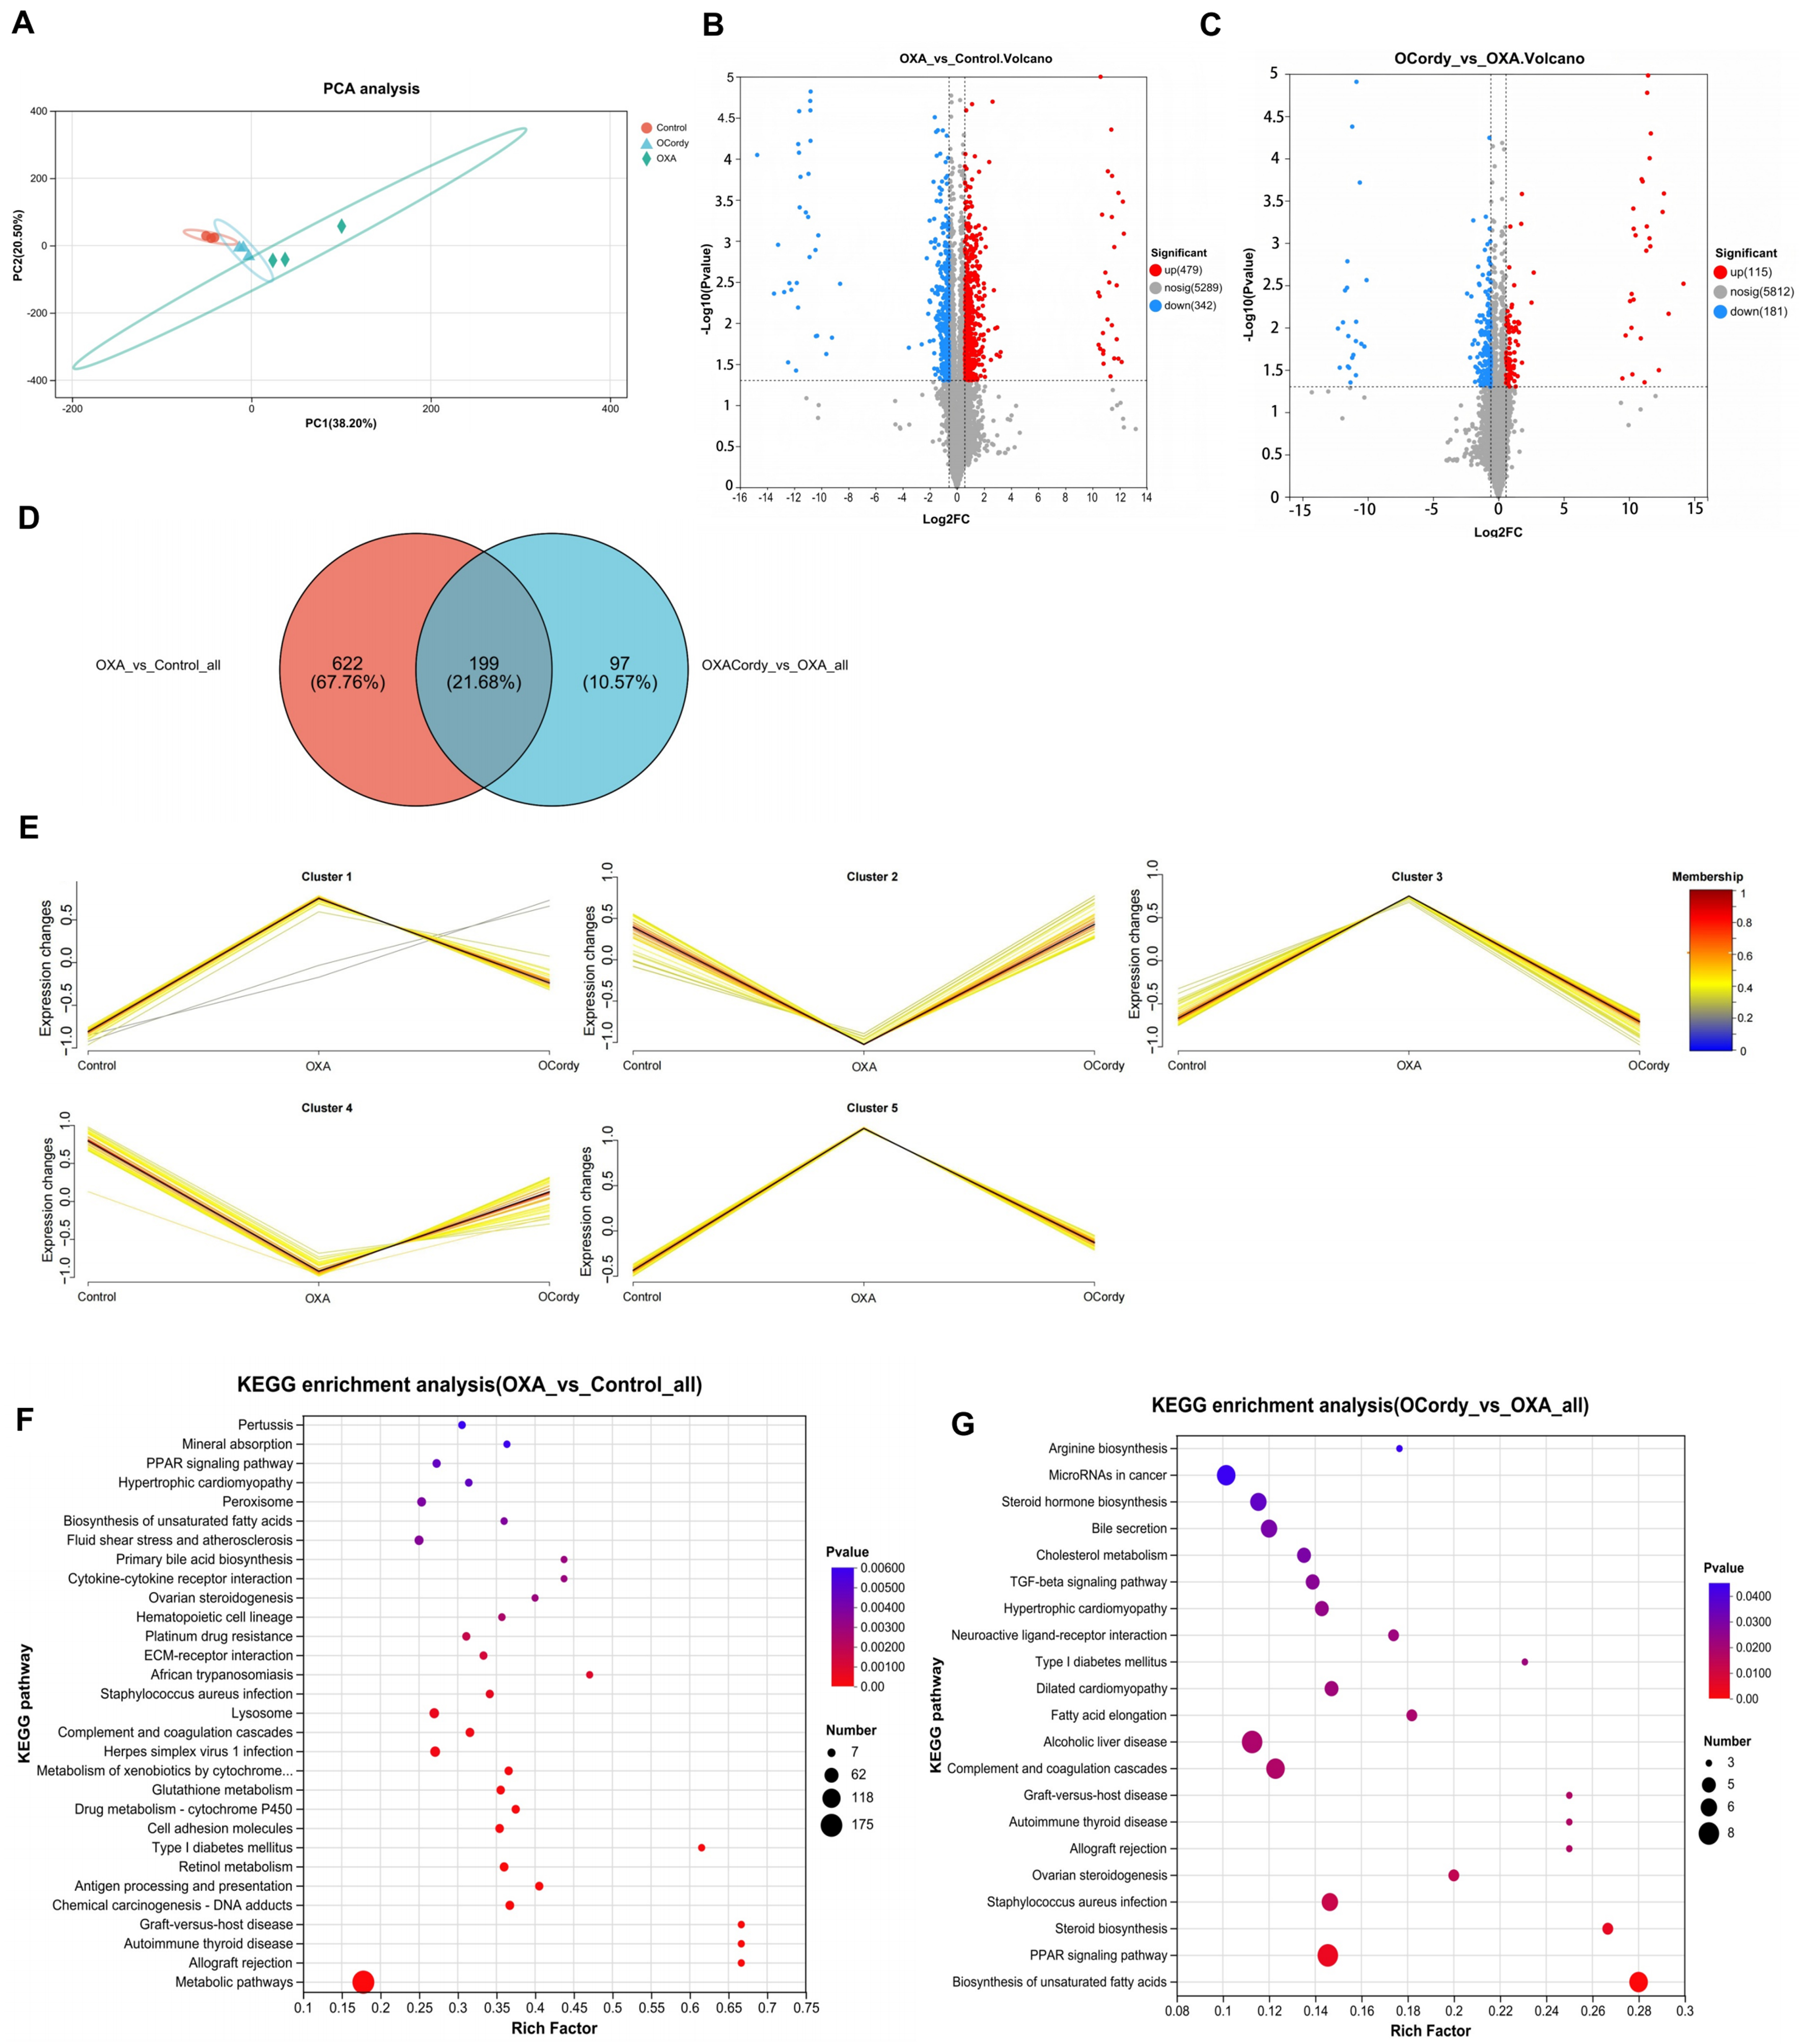
Figure 9. DIA Proteomic Analysis of Hepatic Tissues from Control, OXA, and OCordy Mouse Groups. (A) PCA plot of global protein expression across Control (red), OXA (blue), and OCordy (green) groups, showing distinct clustering. Principal components 1 and 2 account for 38.20% and 24.50% of the variance, respectively; (B and C) Volcano plots of differentially expressed proteins in OXA-Control (B) and OCordy-OXA (C) comparisons. Red: upregulation; blue: downregulation. Significant proteins (P < 0.05, fold change > 1.5) are highlighted; (D) Venn diagram of significantly altered proteins in OXA-Control and OCordy-OXA comparisons, with 199 common proteins; (E) Mfuzz analysis of protein clusters across groups. Color gradient (blue to red) represents expression intensity, highlighting OXA-induced patterns and cordycepin modulation; (F and G) KEGG enrichment analysis of DEPs in OXA-Control (F) and OCordy-OXA (G). Key pathways (e.g., PPAR signaling) are highlighted, revealing OXA-induced reprogramming and cordycepin restoration. DIA: Data-independent acquisition; OXA: Oxaliplatin; OCordy: Oxaliplatin plus cordycepin; PCA: principal component analysis; DEPs: differentially expressed proteins; KEGG: Kyoto Encyclopedia of Genes and Genomes; PPAR: peroxisome proliferator-activated receptor.


