


fig8
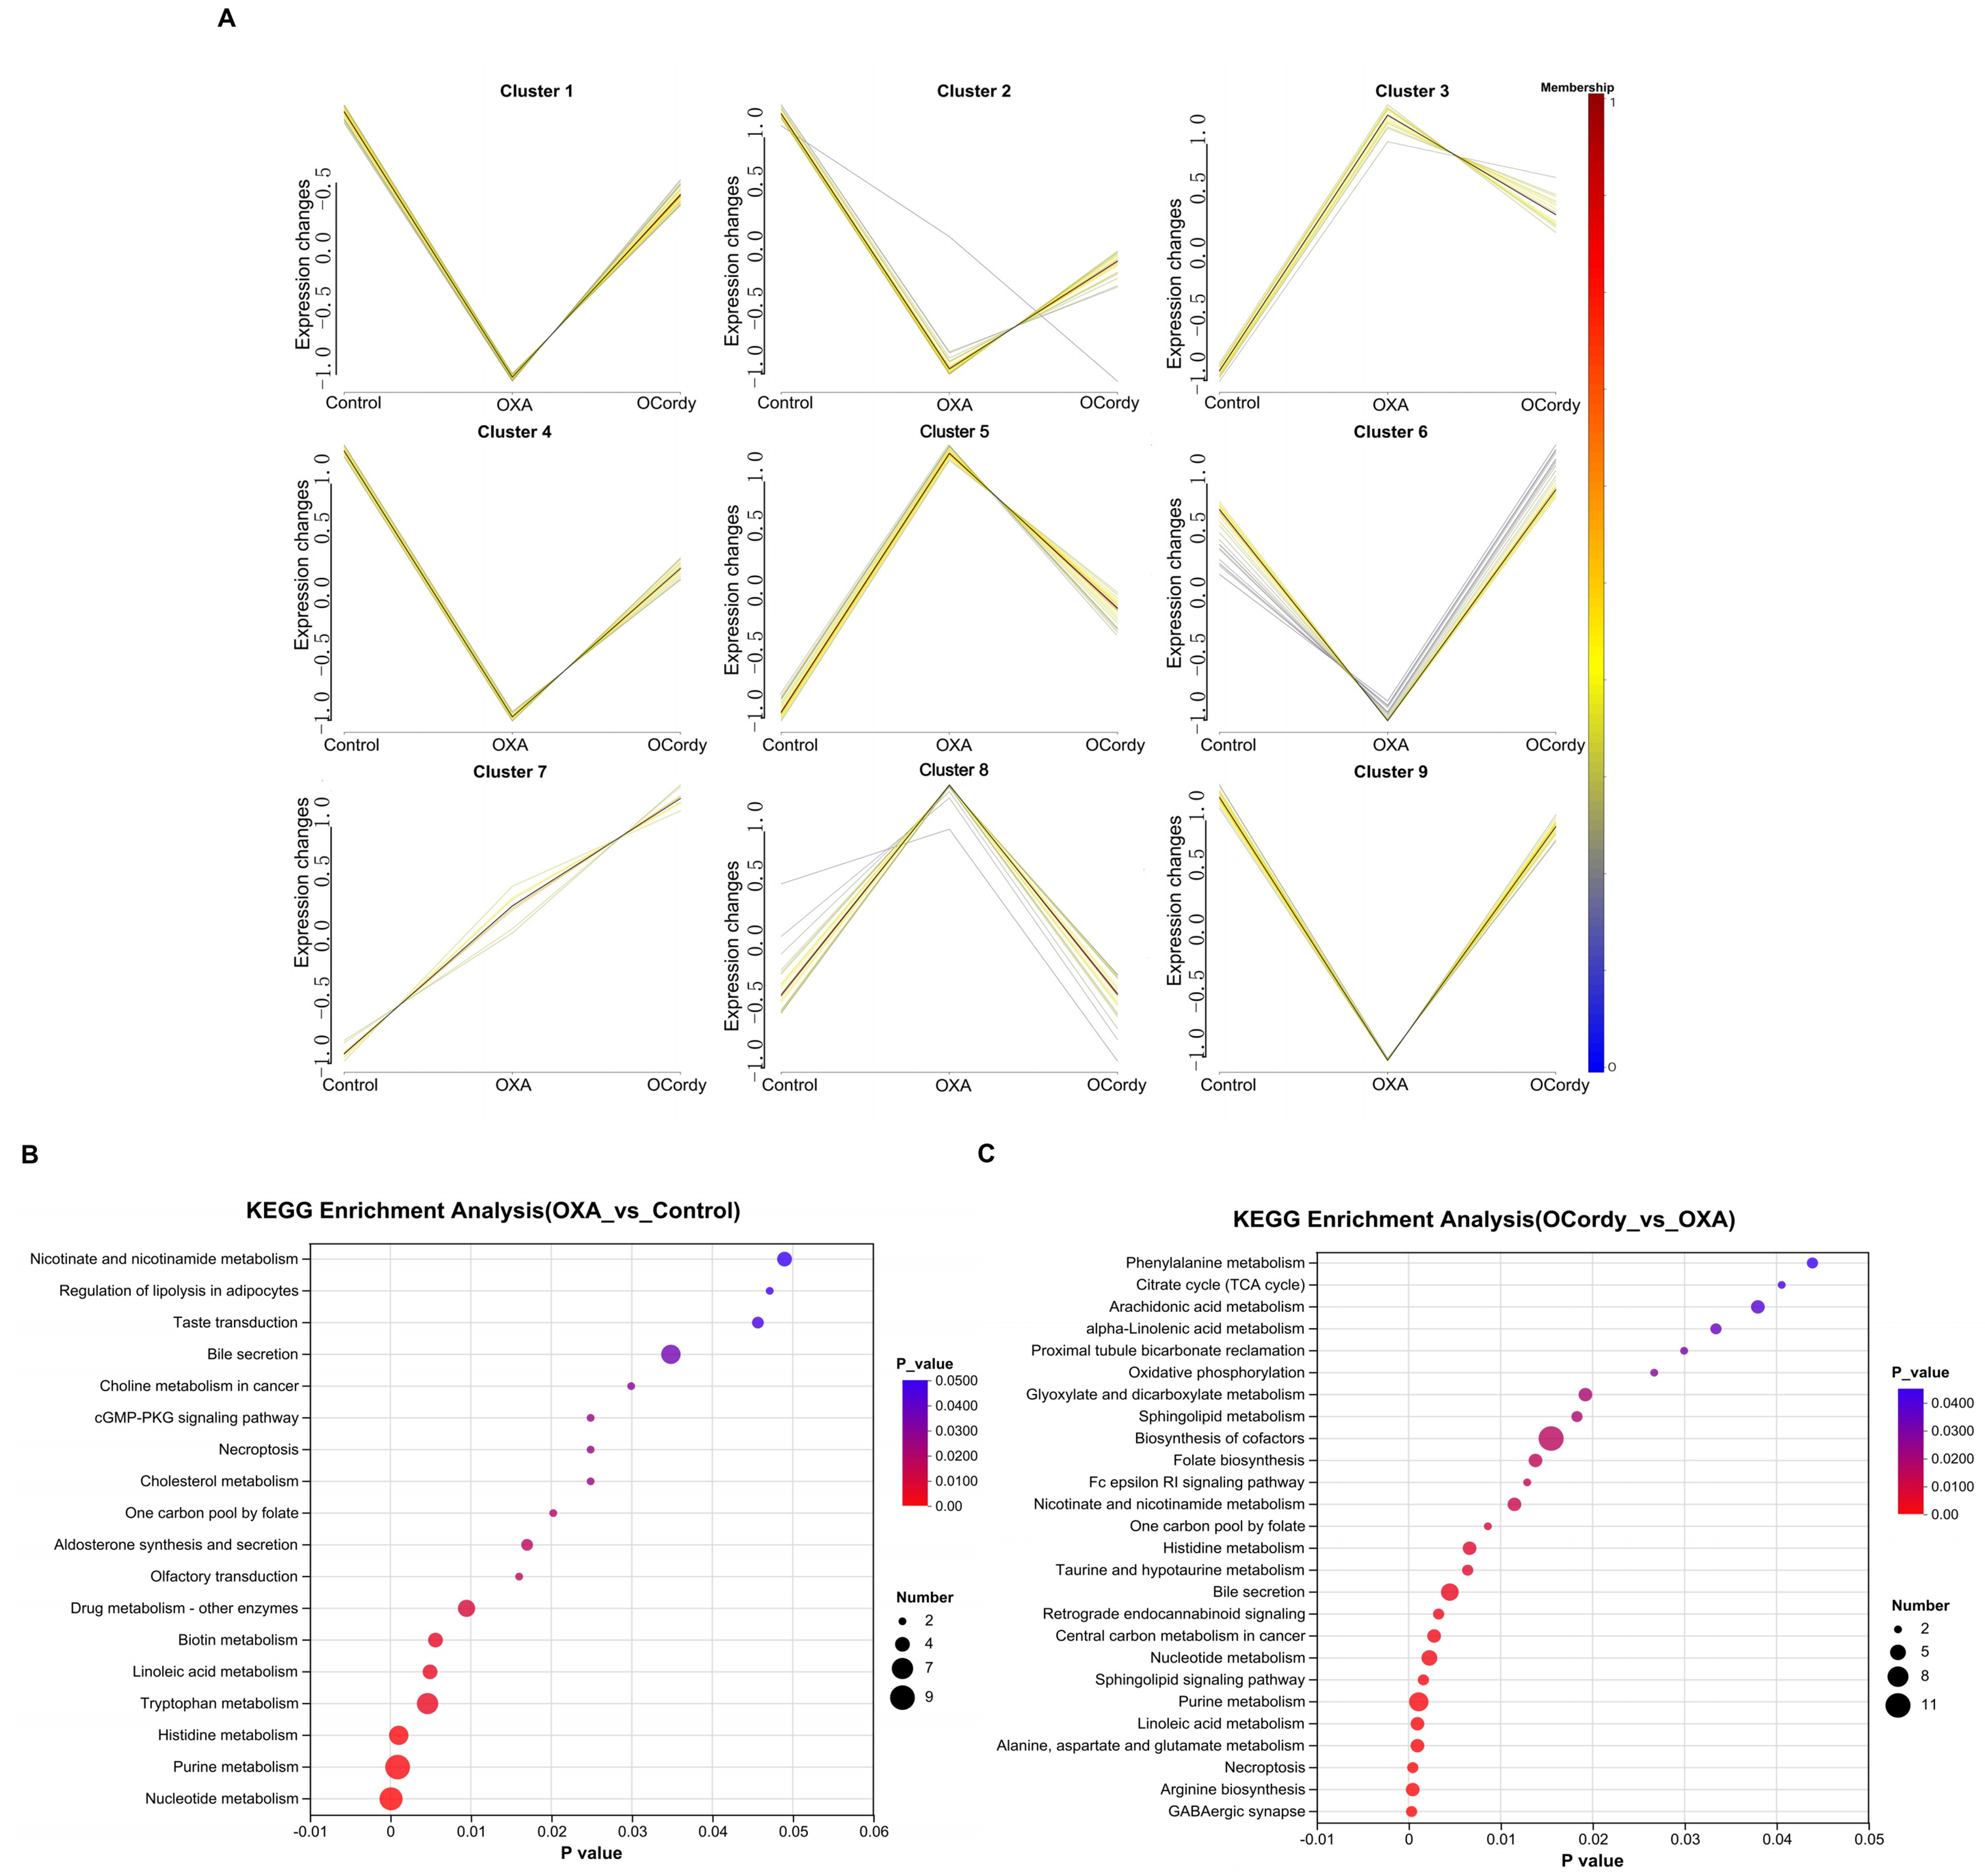
Figure 8. Non-targeted Metabolomic Analysis of Hepatic Tissues from Control, OXA, and OCordy Mouse Groups. (A) Mfuzz analysis illustrating the relationships among metabolite clusters across the Control, OXA, and OCordy groups. The diagram is divided into nine clusters, with lines connecting metabolites between groups. The color gradient (from blue to red) represents metabolite expression intensity, highlighting differential metabolic patterns induced by OXA and the OCordy modulatory effects; (B and C) KEGG enrichment analysis for differentially expressed metabolites in OXA-Control (B) and OCordy-OXA (C) comparisons. The x-axis represents the P-value (-log10 transformed), and the y-axis lists enriched metabolic pathways. The size of each dot corresponds to the number of metabolites involved in each pathway, with color intensity indicating the significance level (P-value). OXA: Oxaliplatin; OCordy: Oxaliplatin plus cordycepin; KEGG: Kyoto Encyclopedia of Genes and Genomes.


