


fig5
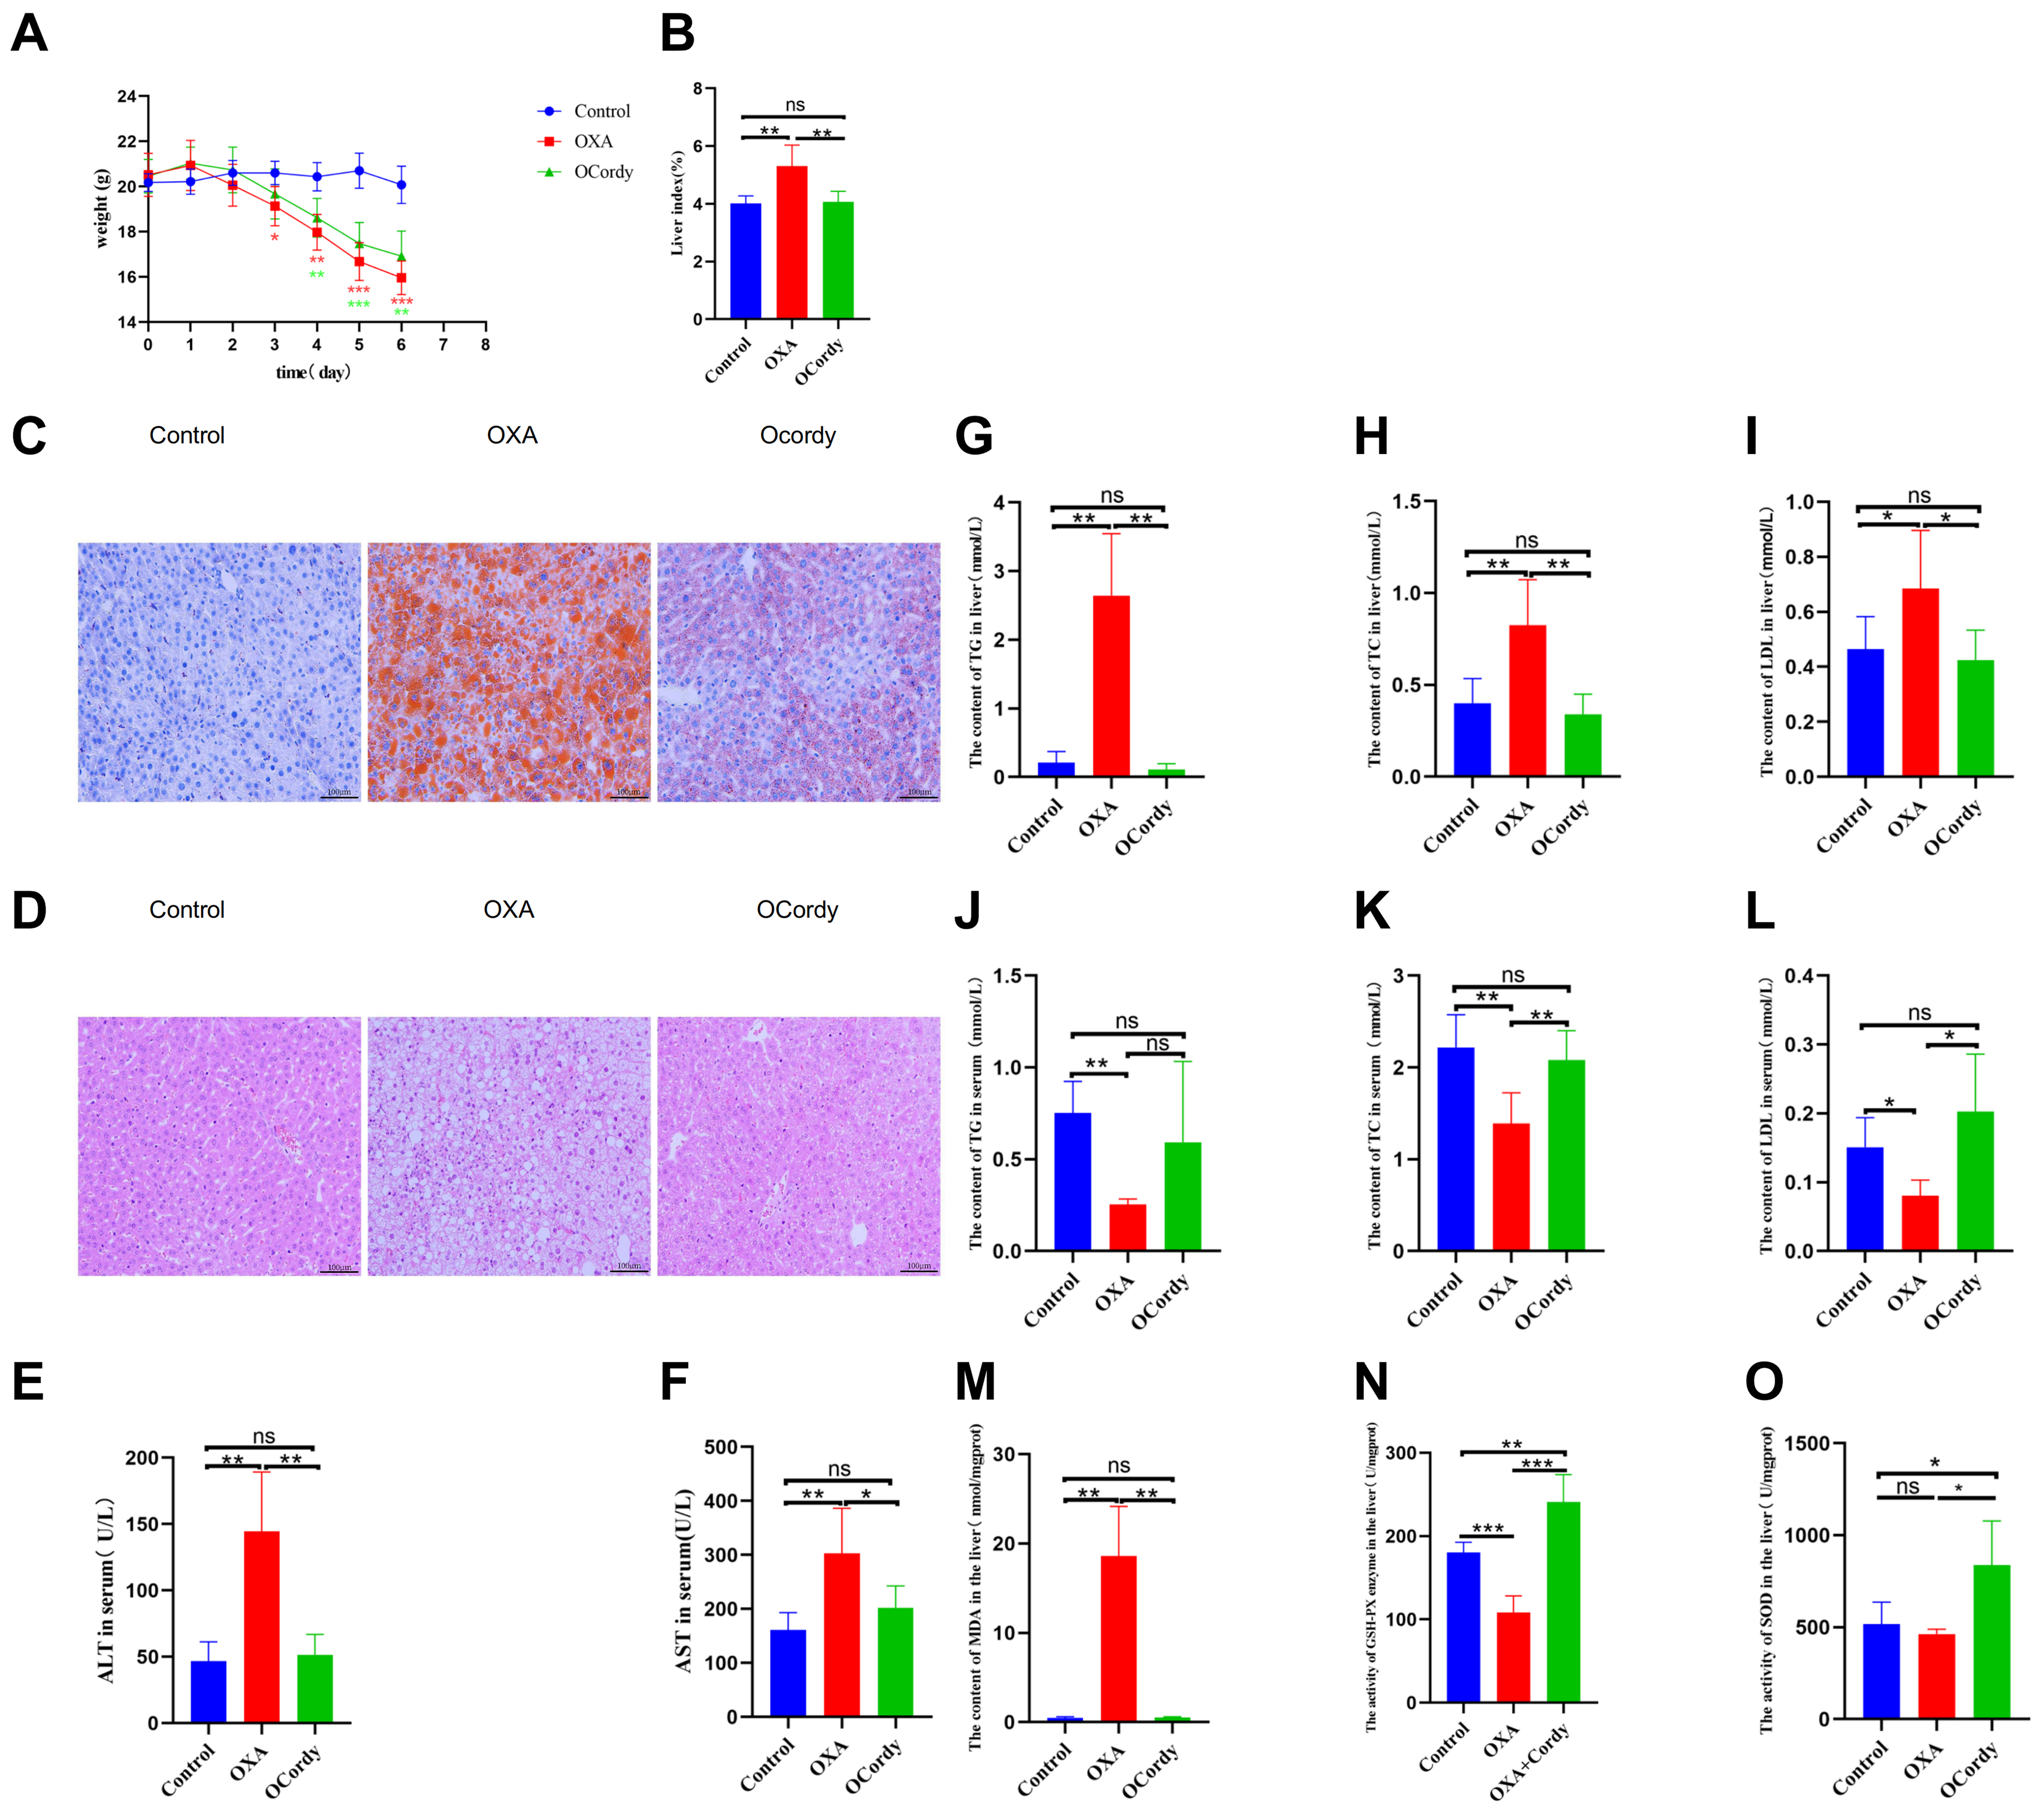
Figure 5. In vivo Experimental Results in Control, OXA, and OCordy Mouse Groups. (A) Body weight changes. Control mice remained stable. OXA induced progressive weight loss (P < 0.05), which was alleviated by cordycepin; (B) Liver index. The index was significantly higher in the OXA group than in the Control group (P < 0.01); cordycepin intervention significantly reduced this index (P < 0.01); (C) Liver Oil Red O staining (200×). OXA caused diffuse lipid droplet accumulation, which was markedly reduced by cordycepin; (D) Liver HE staining (200×). OXA resulted in hepatocyte swelling and disordered arrangement; these pathological changes were ameliorated by cordycepin; (E and F) Serum ALT and AST levels. OXA significantly elevated levels compared to Control (P < 0.01); cordycepin significantly reduced levels (P < 0.01 and P < 0.05, respectively); (G-I) Liver TG, TC, and LDL levels. OXA significantly elevated levels (P < 0.01, P < 0.01, and P < 0.05, respectively); cordycepin treatment significantly reduced levels (P < 0.01, P < 0.01, and P < 0.05, respectively); (J-L) Serum TG, TC, and LDL levels. OXA significantly lowered levels (P < 0.01, P < 0.01, and P < 0.05, respectively); cordycepin intervention increased serum TC and LDL (P < 0.01 and P < 0.05, respectively); (M-O) Liver MDA content, GSH-PX activity, and SOD activity. OXA increased MDA (P < 0.01) and decreased GSH-PX (P < 0.001). Cordycepin treatment reduced MDA (P < 0.01) and increased SOD (P < 0.05) and GSH-PX activities (P < 0.001 and P < 0.01). (Note: Statistical methods: Independent Samples t-test. *P < 0.05, P < 0.01, *P < 0.001). OXA: Oxaliplatin; OCordy: Oxaliplatin plus cordycepin; HE: hematoxylin and eosin; ALT: alanine aminotransferase; AST: aspartate aminotransferase; TG: triglycerides; TC: total cholesterol; LDL: low-density lipoprotein; MDA: malondialdehyde; GSH-PX: glutathione peroxidase; SOD: superoxide dismutase.


