


fig7
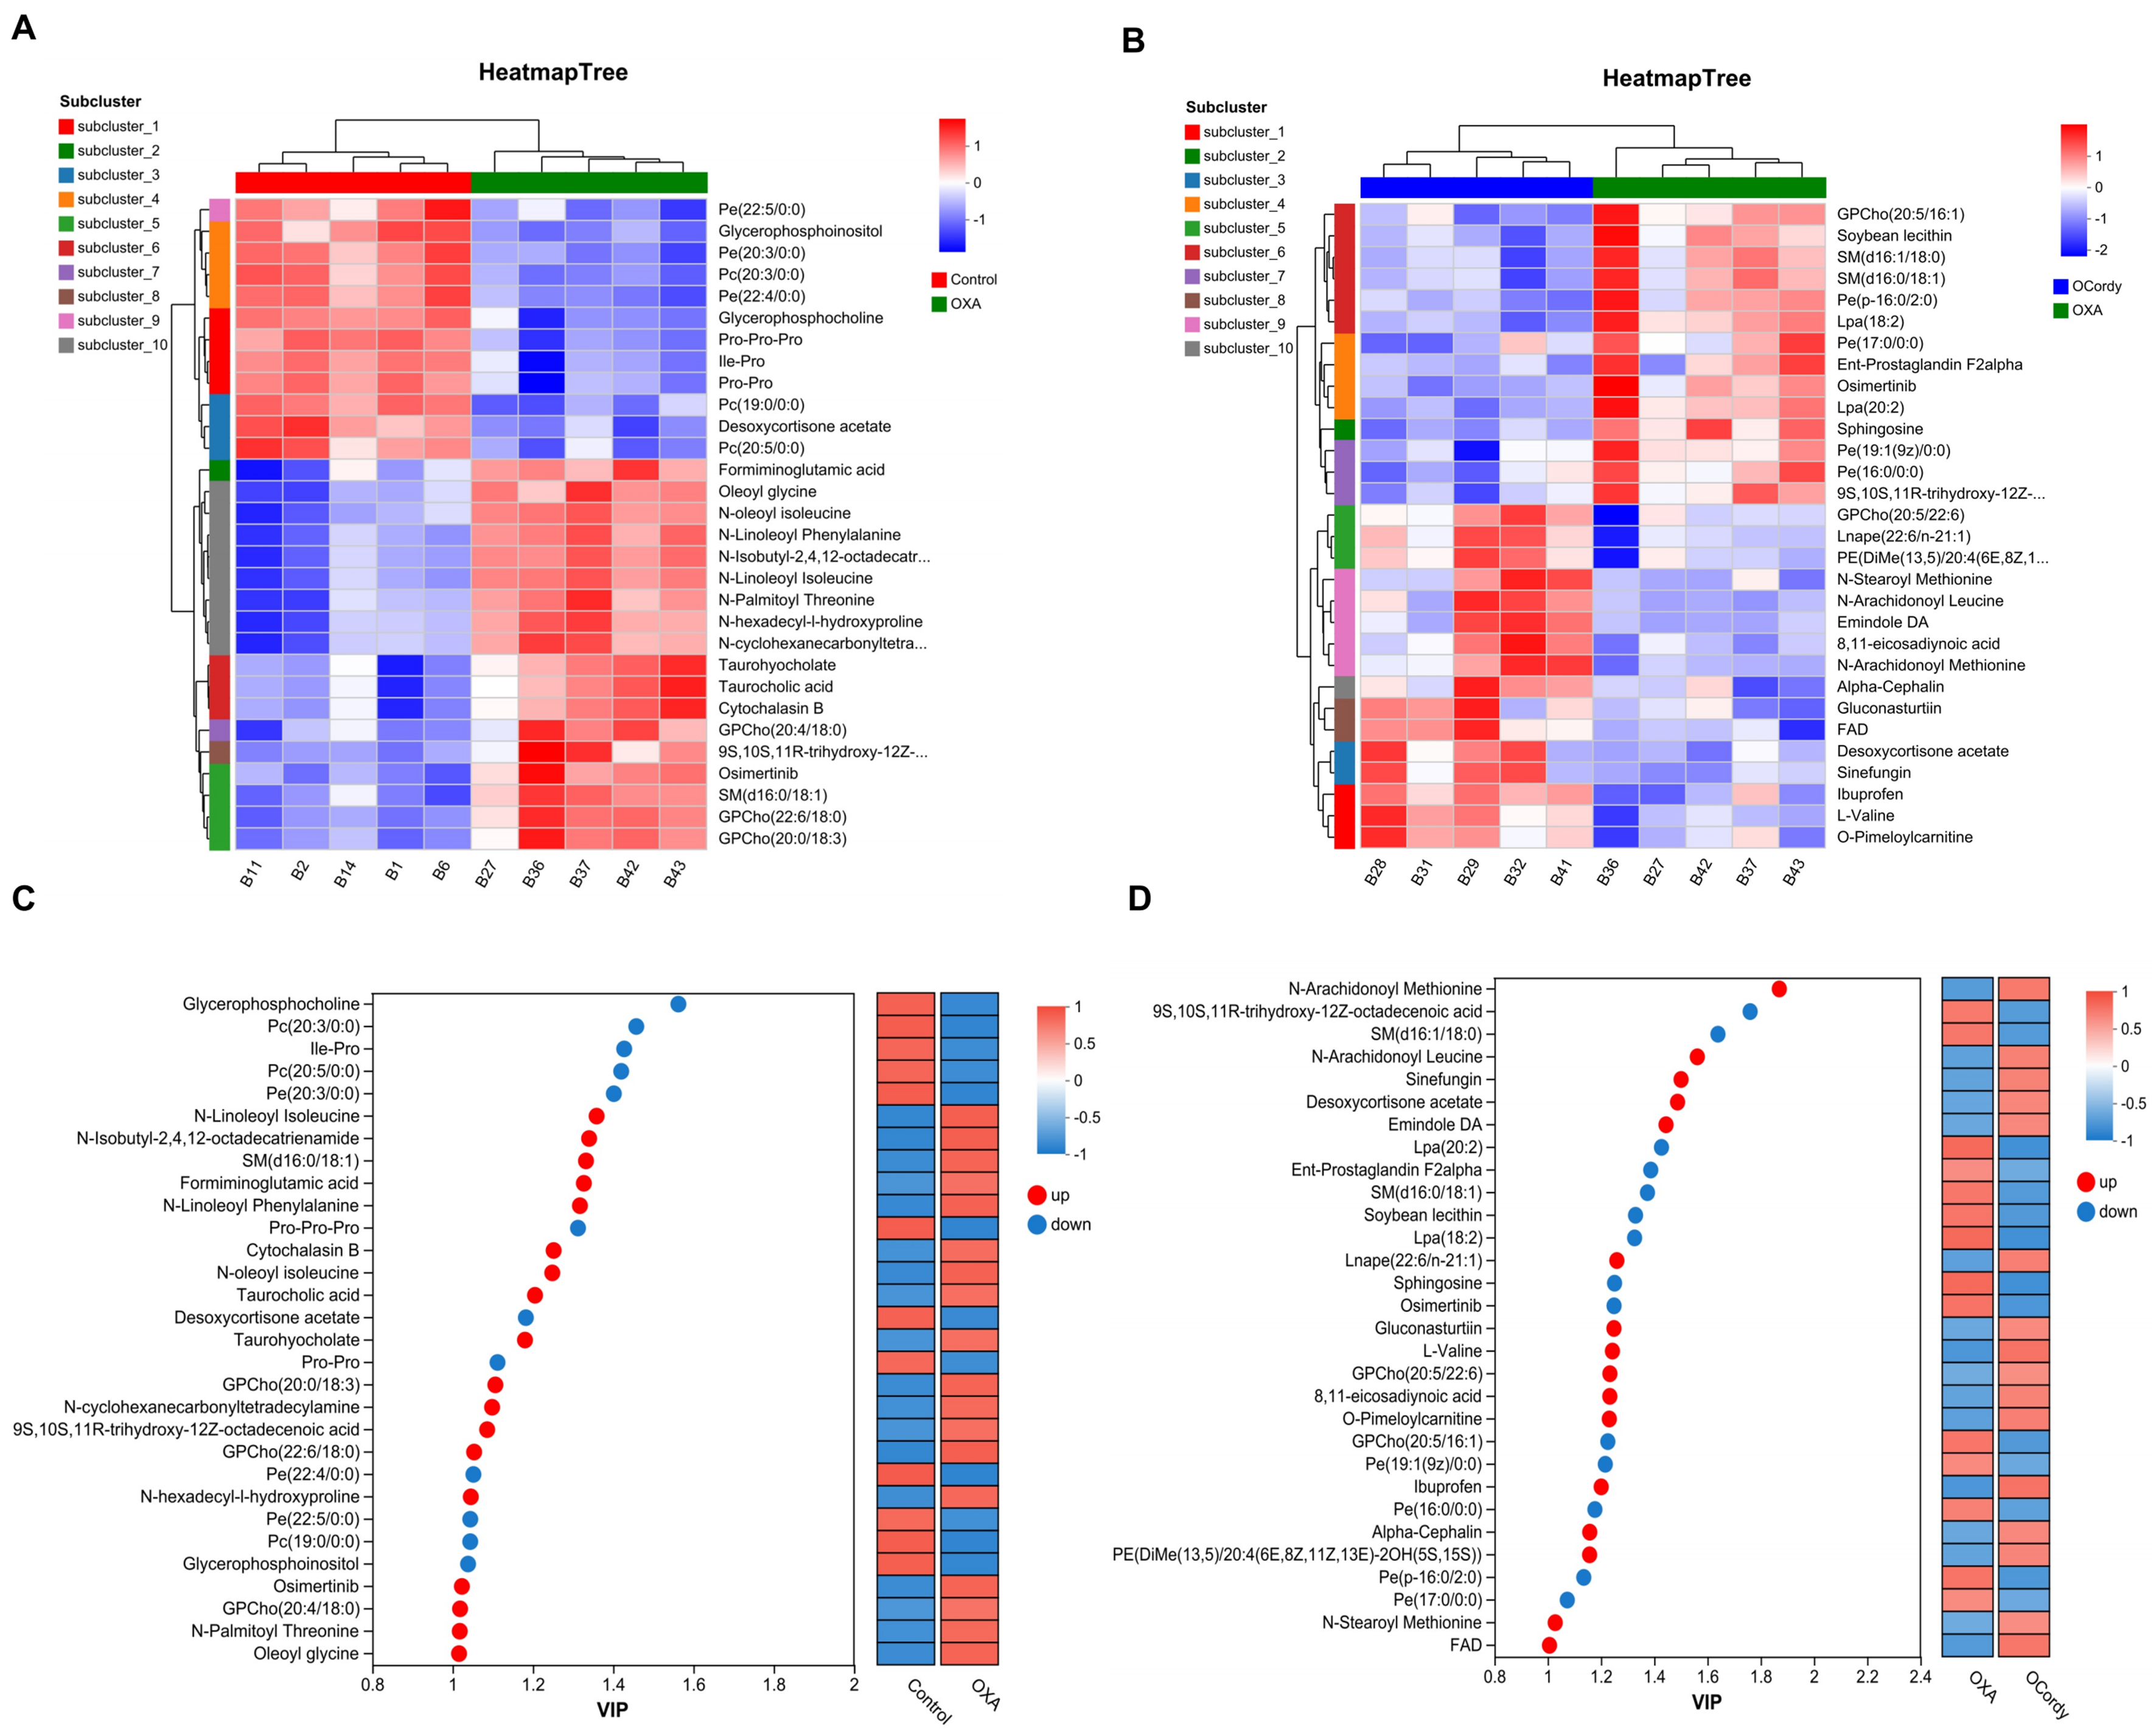
Figure 7. Non-targeted Metabolomics Analysis of Hepatic Tissues from Control, OXA, and OCordy Mouse Groups. (A and B) Heatmaps showing clustering analysis of the top 30 DMs in liver tissues from OXA-control (A) and OCordy-OXA (B) comparisons. Color intensity represents metabolite abundance (red: upregulated; blue: downregulated), revealing significant metabolic alterations and distinct clustering patterns. (C and D) VIP bar plots displaying expression levels of the top 30 differentially expressed metabolites in OXA-Control (C) and OCordy-OXA (D) comparisons in liver tissues. X-axis: VIP values; Y-axis: metabolites (red: upregulated; blue: downregulated). OXA: Oxaliplatin; OCordy: Oxaliplatin plus cordycepin; DMs: differential metabolites.


