


fig10
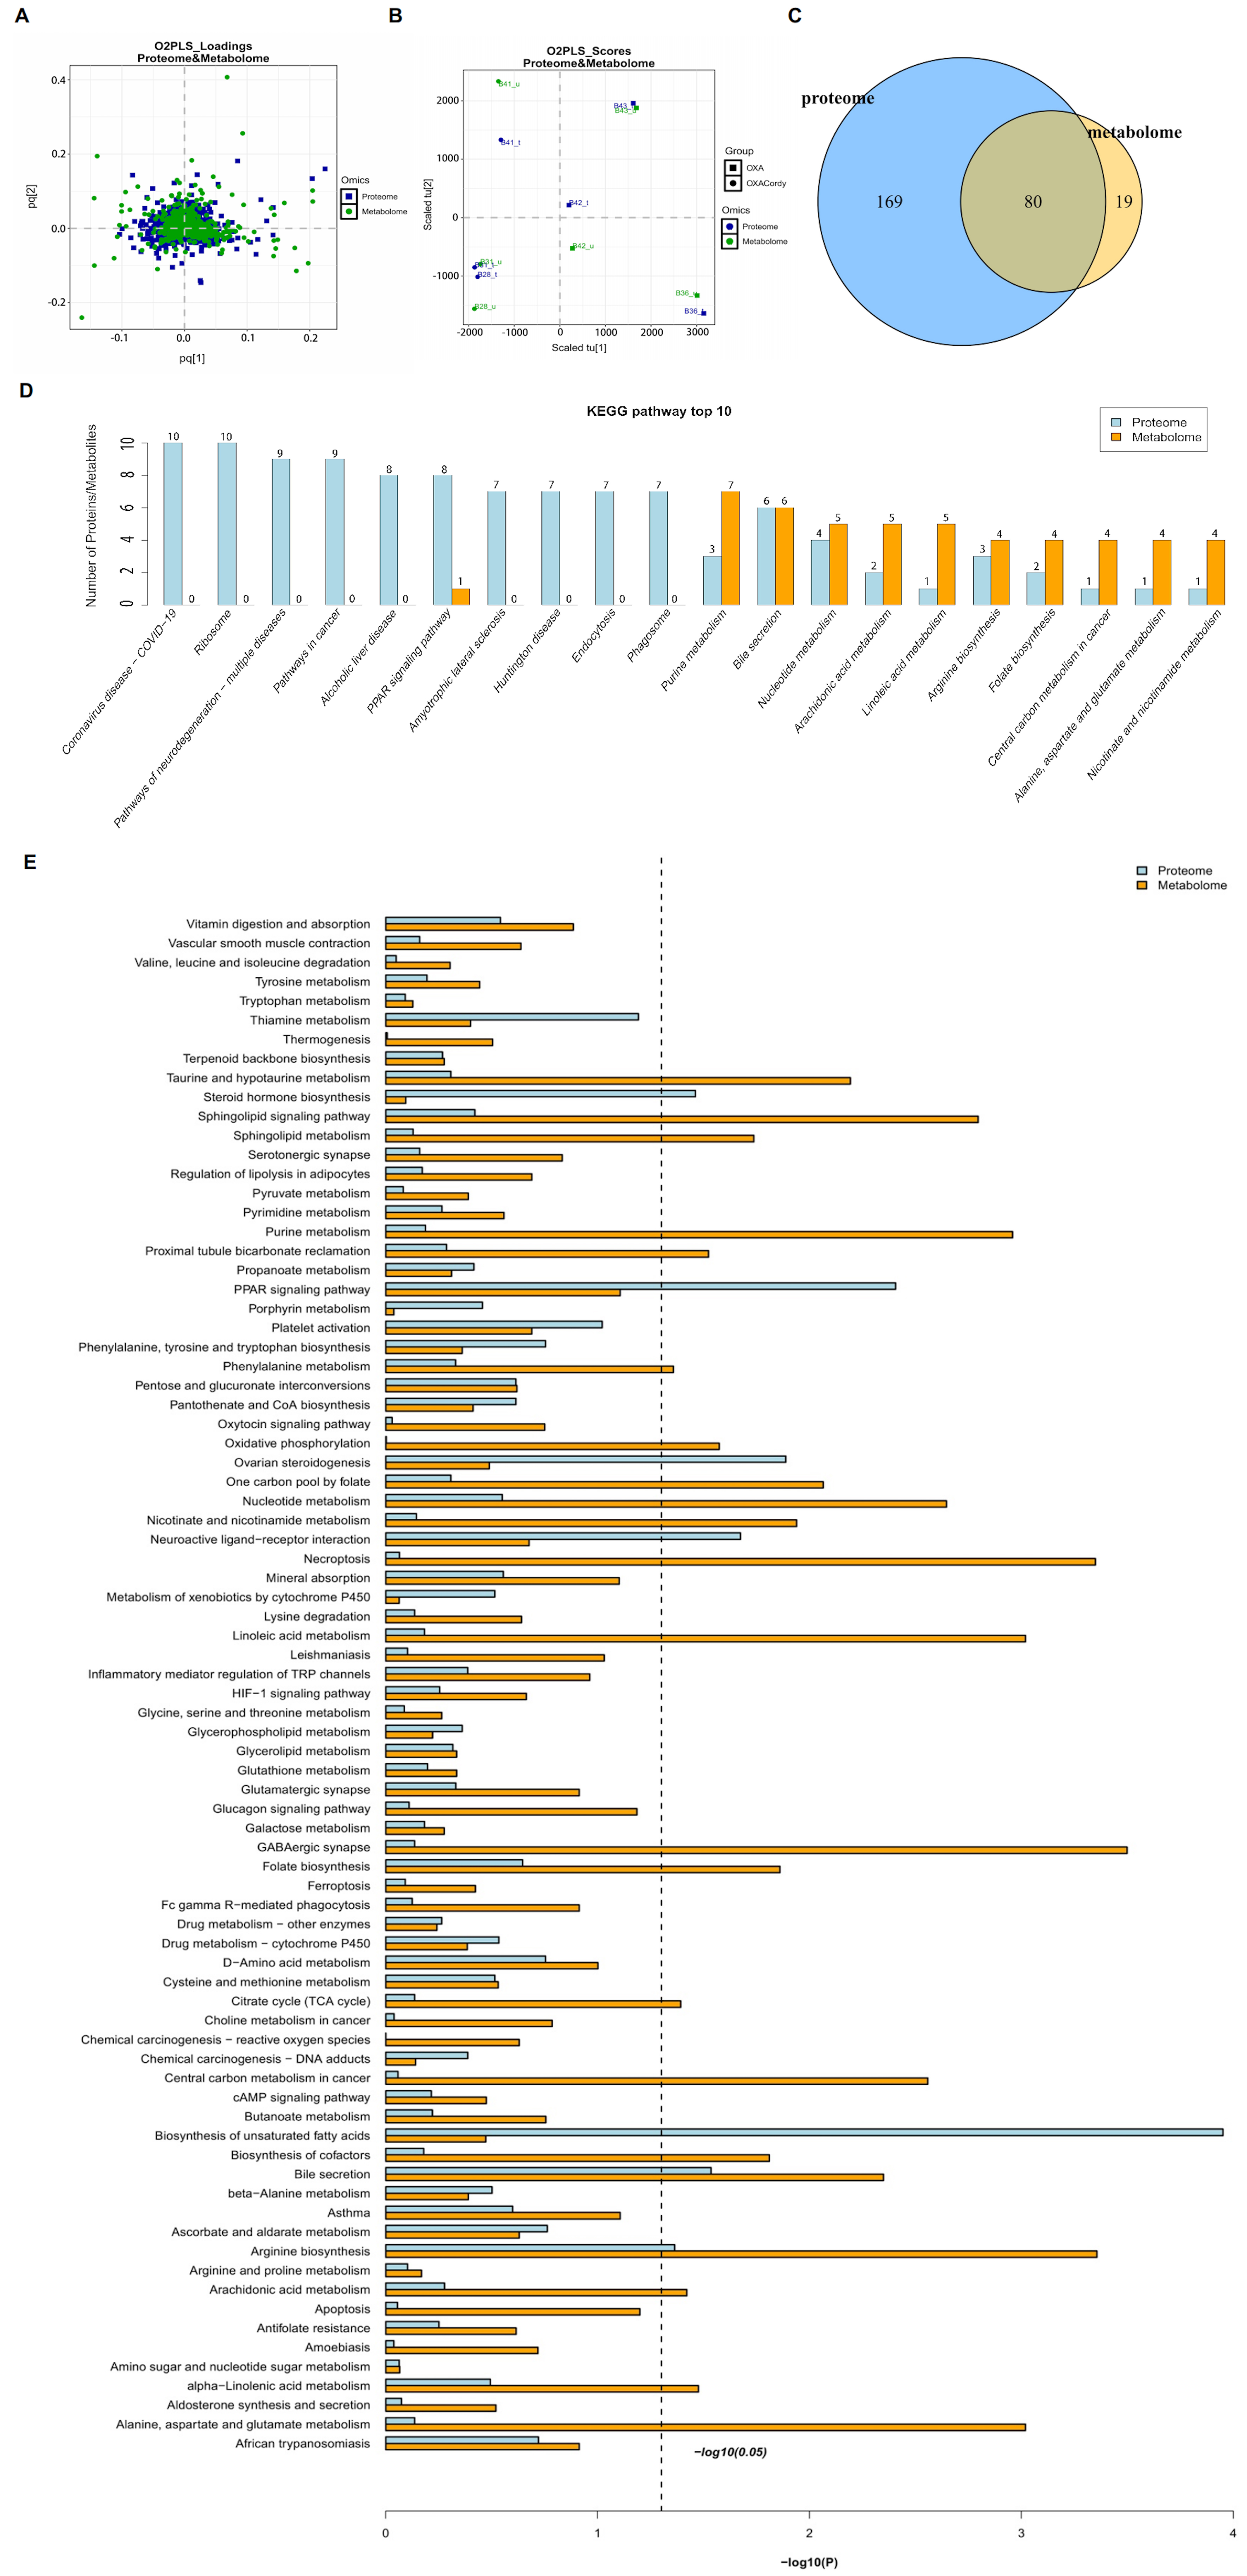
Figure 10. Integrative Analysis of Proteomics and Metabolomics Profiles in Hepatic Tissues from Control, OXA, and OCordy Mouse Groups. (A) OPLS-DA Score Plot showing separation of proteomic and metabolomic profiles among Control, OXA, and OCordy groups; (B) OPLS-DA loading plot identifying key variables contributing to group separation; (C) Venn diagram of overlapping differentially expressed proteins and metabolites; 80 molecules are common to both datasets; (D) Top 10 KEGG pathways for differentially expressed proteins (blue) and metabolites (orange); (E) Comprehensive KEGG pathway enrichment. Pathways ranked by significance [-log10(P-value)]; dashed line indicates P < 0.05. OXA: Oxaliplatin; OCordy: Oxaliplatin plus cordycepin; OPLS-DA: orthogonal projections to latent structures discriminant analysis; KEGG: Kyoto Encyclopedia of Genes and Genomes.


