


fig3
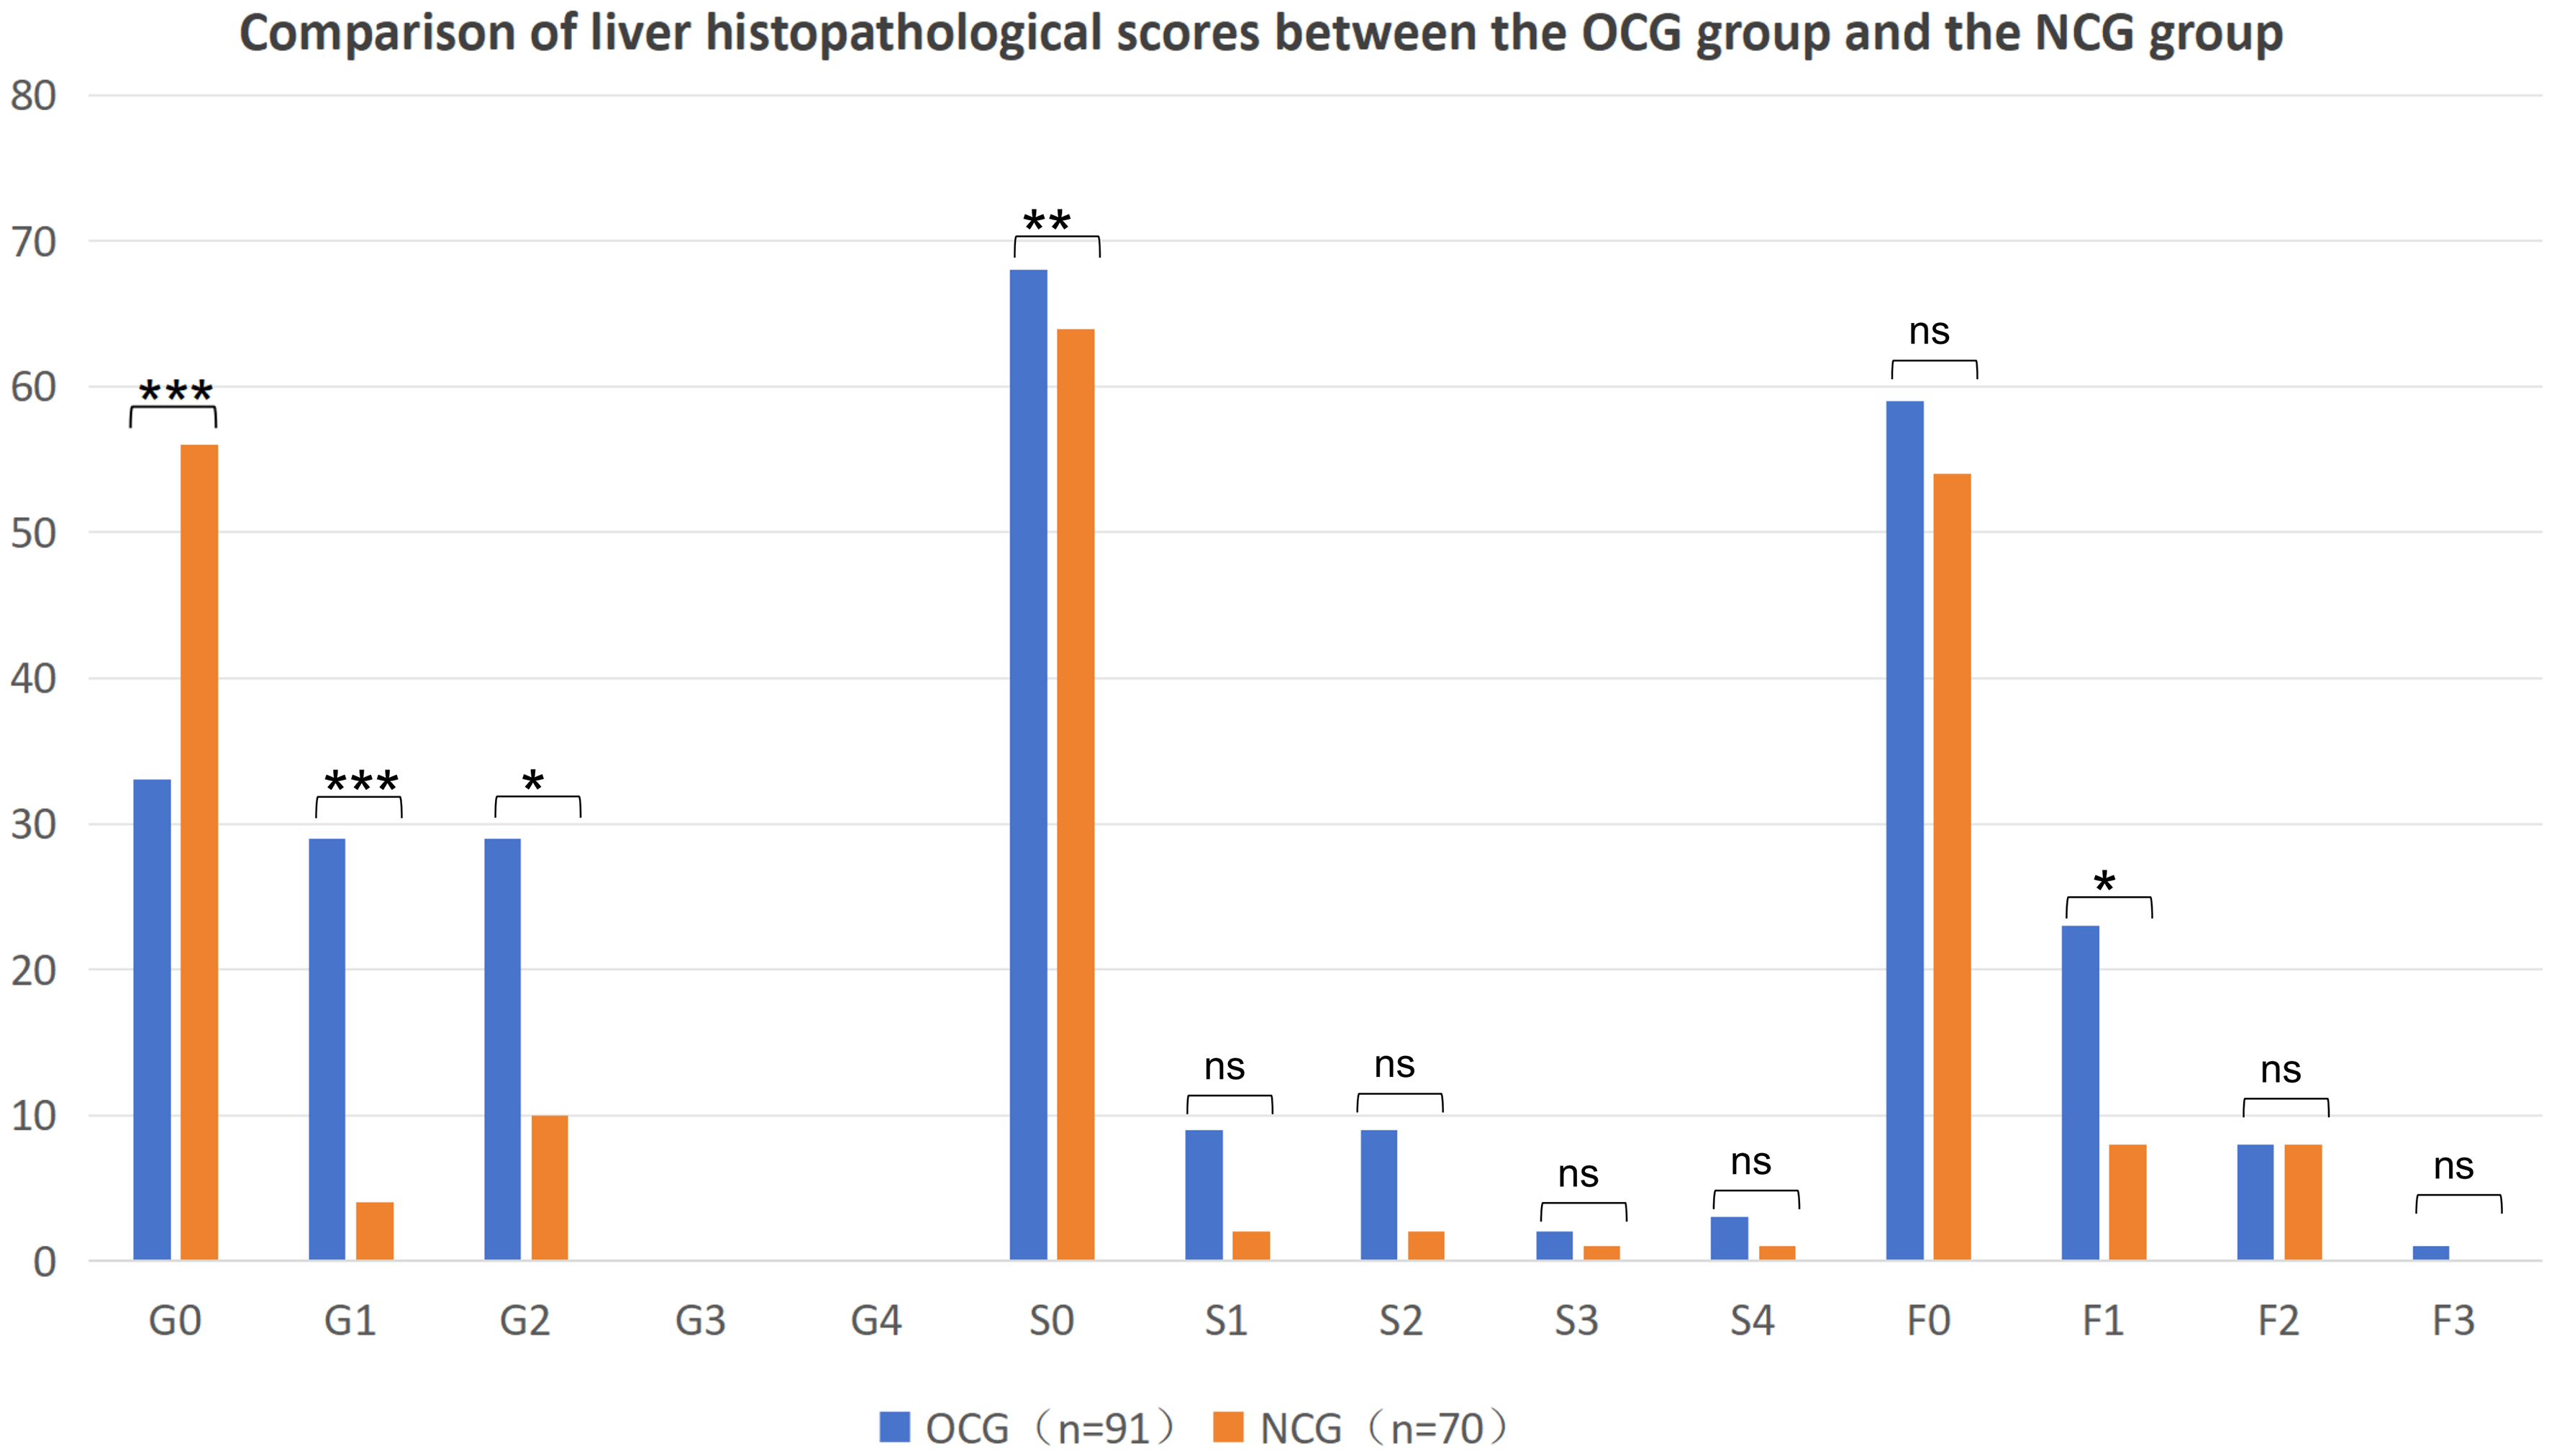
Figure 3. Comparison of Histopathological Changes in the Non-Tumor Liver Tissues between the OCG (n = 91) and NCG (n = 70) Groups. (Note: Statistical methods: Chi-squared test. *P < 0.05; **P < 0.01; ***P < 0.001). OCG: Oxaliplatin-based chemotherapy group; NCG: Non-chemotherapy group; G: grade of hepatic inflammation (G0-G4); S: stage of hepatic fibrosis (S0-S4); F: grade of hepatic steatosis (F0-F2); n: number of patients; ns: not significant.


