


High glucose induces hypoxanthine accumulation, linking hyperglycemia to adipocyte dysfunction
 0
0 Abstract
Aim: This study aimed to clarify how hyperglycemia drives metabolite-mediated remodeling in human adipocytes and to identify key metabolites that mediate high-glucose (HG)-induced remodeling of human adipocytes.
Methods: Human visceral preadipocytes and mature adipocytes were exposed to HG and analyzed using metabolomics. Based on metabolomic screening, hypoxanthine was selected as the primary metabolite for functional validation. Lipid accumulation, mitochondrial respiration, and uncoupling protein 1 (UCP1) expression were assessed to determine its metabolic effects. Zebrafish fed a high-fat diet were used to evaluate in vivo effects. Pathway enrichment analyses were conducted to map metabolic and transcriptional responses.
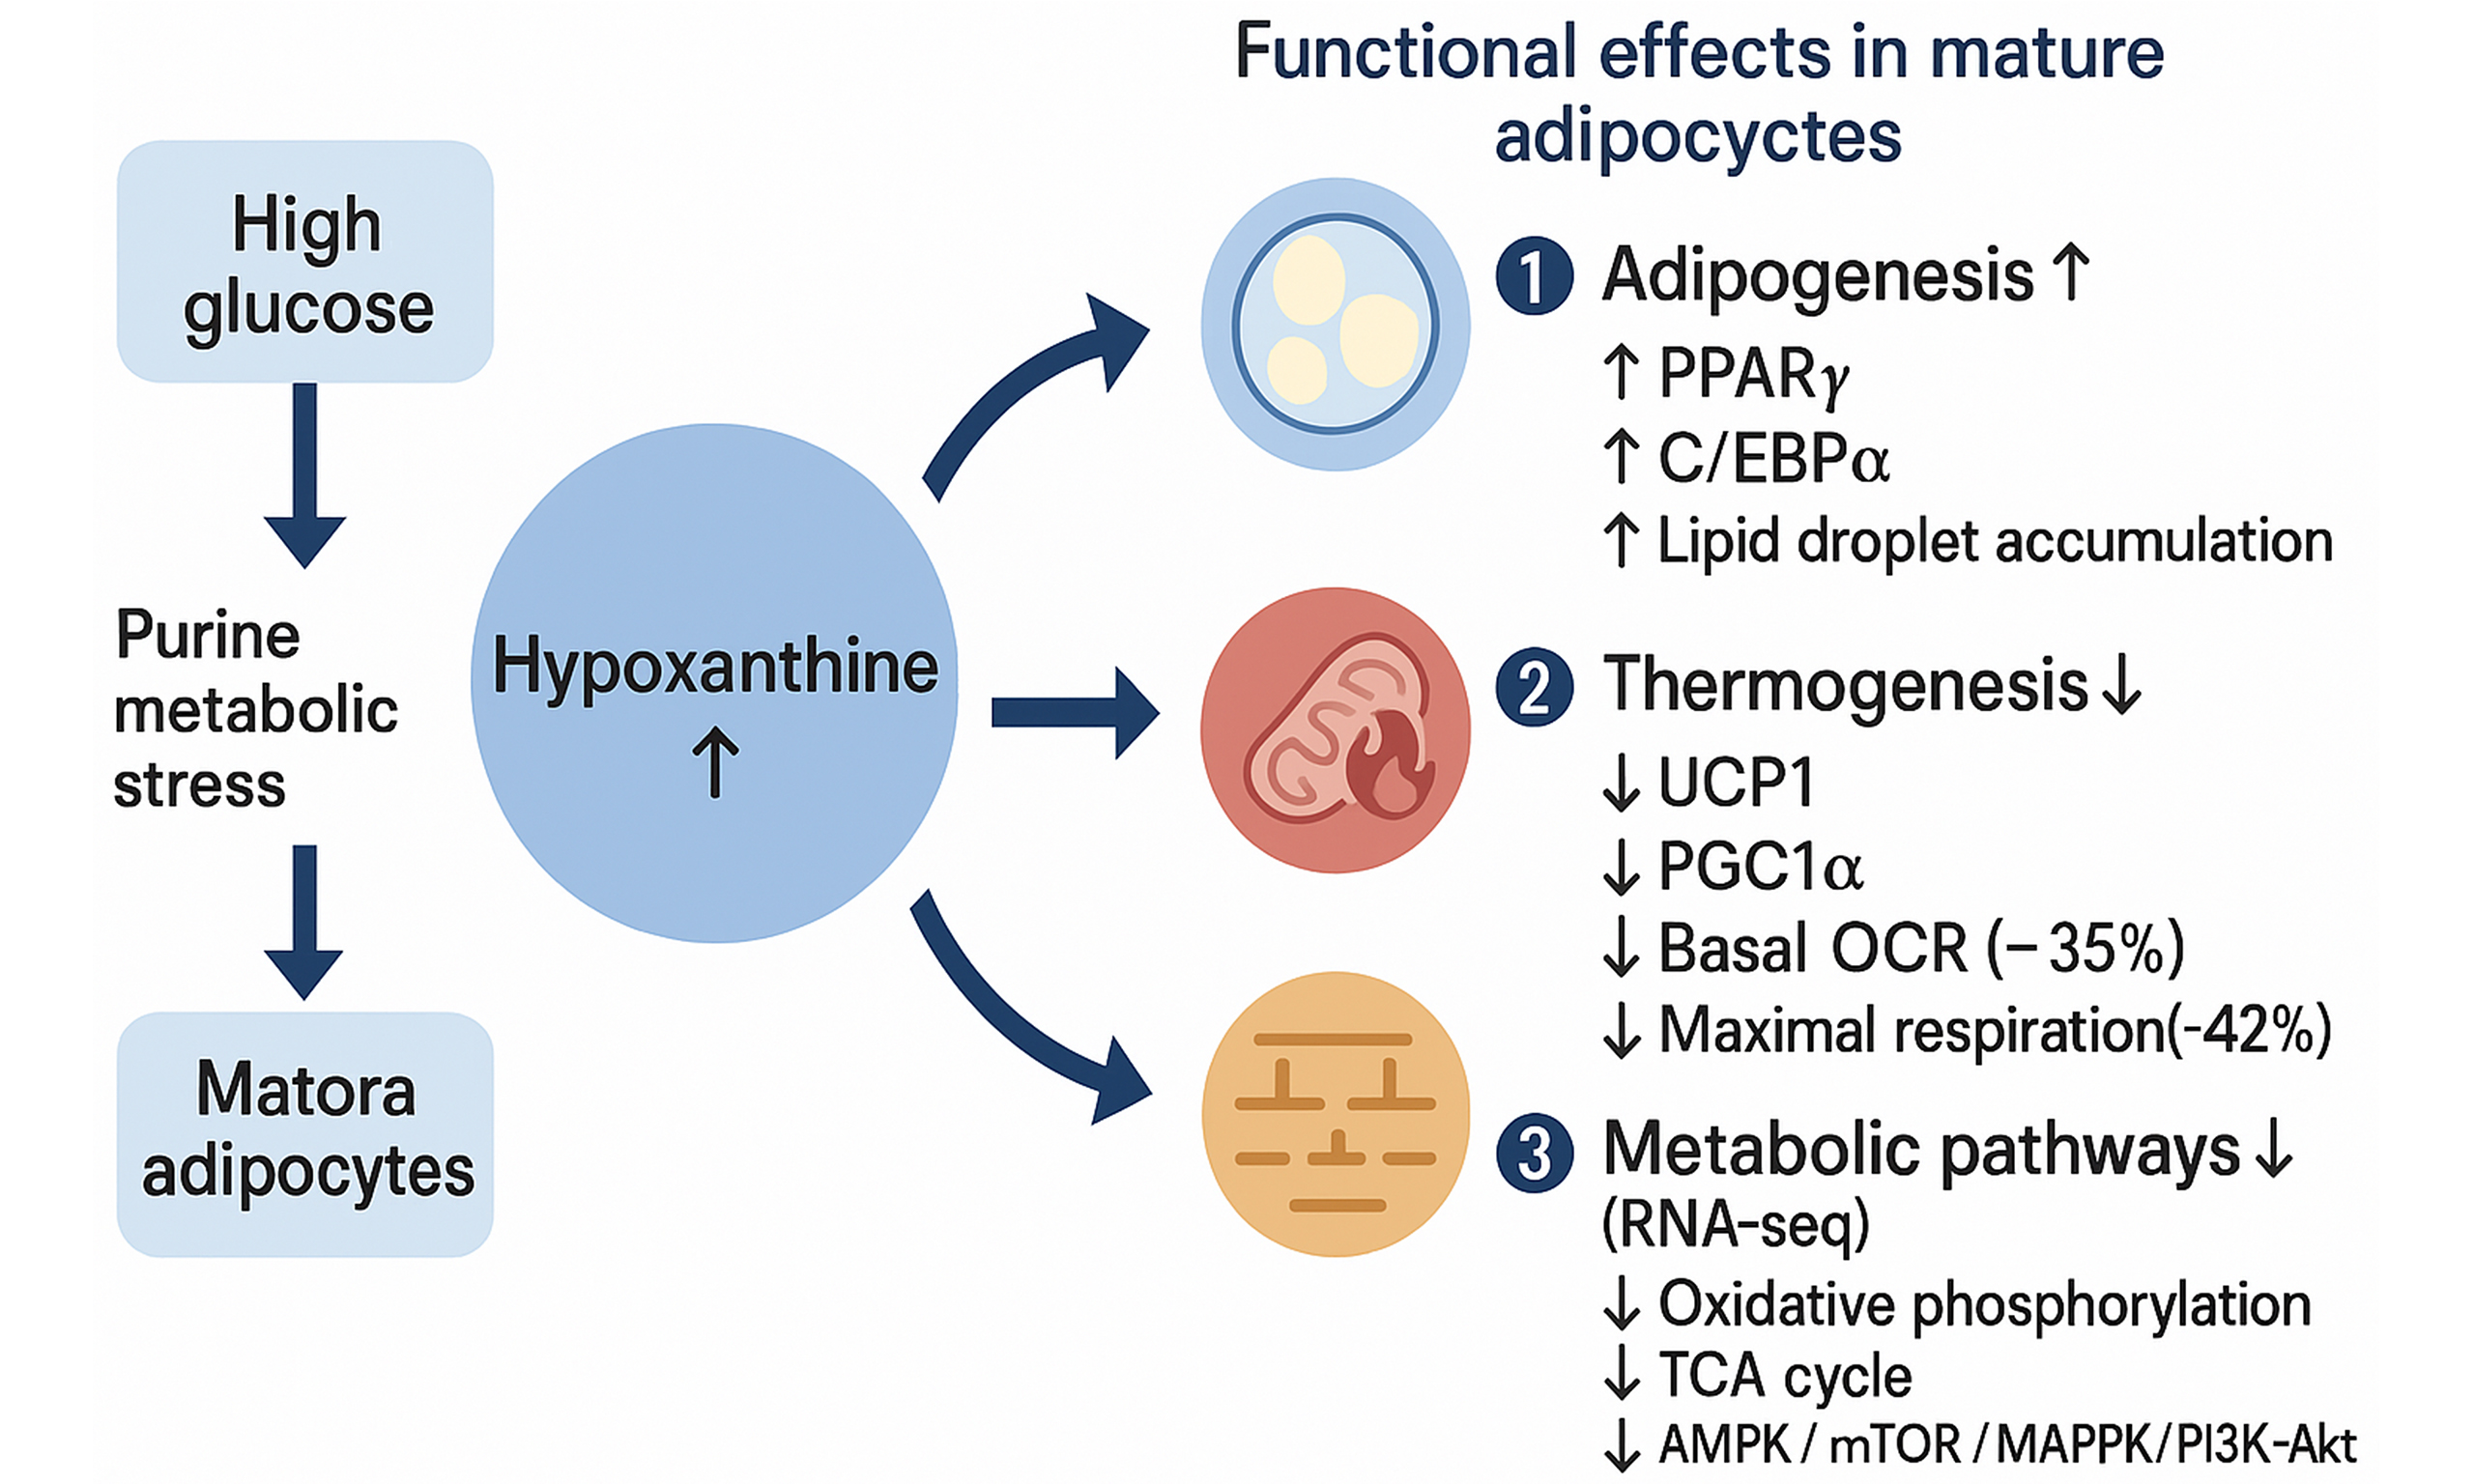
Results: HG induced widespread alterations in metabolic pathways in mature adipocytes but caused only minor alterations in precursor cells. Hypoxanthine emerged as the most consistently upregulated metabolite in HG-treated mature adipocytes. Functionally, hypoxanthine increased lipid accumulation during differentiation while suppressing UCP1 expression and mitochondrial oxidative respiration in mature adipocytes. In zebrafish, hypoxanthine aggravated diet-induced lipid deposition. Transcriptomic analysis showed glycerolipid metabolism and the peroxisome proliferator-activated receptor (PPAR) signaling pathway were significantly enriched, suggesting that hypoxanthine may participate in adipocyte functional remodeling by regulating pathways involved in lipid metabolism and energy metabolism.
Conclusion: Hypoxanthine is identified as a candidate metabolic mediator linking hyperglycemia to impaired adipocyte metabolic flexibility. By promoting lipid storage and attenuating mitochondrial and nutrient-sensing pathways, hypoxanthine contributes to glucotoxic adipocyte remodeling. These findings provide mechanistic insight into metabolite-driven adipocyte dysfunction under hyperglycemic stress and support further investigation of hypoxanthine as a potential modulator of obesity-related metabolic dysfunction.
Keywords
INTRODUCTION
Obesity has become a major global health concern, with its prevalence rising steadily over the past four decades. According to the World Health Organization, more than 650 million adults were classified as obese in 2022, and over 70 countries have experienced a doubling of obesity rates since 1980[1]. In China, the obesity rate surged from 3.1% to 16.4% between 2004 and 2023, paralleling rapid urbanization and dietary shifts toward high-calorie diets. This increase is part of a larger trend observed globally, where the prevalence of overweight and obesity has been steadily climbing[2], with significant variations across different regions and countries[3]. The global prevalence of obesity continues to escalate, constituting an important public health challenge[4]. Obesity not only elevates the risks of cardiovascular diseases, hypertension, and specific malignancies but also exhibits a strong etiological association with the development of type 2 diabetes mellitus (T2DM)[5].
The pathophysiological interplay between obesity and diabetes manifests as an intricate bidirectional relationship. Obesity emerges as a principal modifiable risk factor for type 2 diabetes through its mechanistic links with insulin resistance, β-cell dysfunction, and glucose metabolism abnormalities[6]. Adipose tissue dysregulation in obesity - characterized by adipocyte hypertrophy, macrophage infiltration, and impaired insulin signaling - creates a pathogenic milieu that exacerbates systemic insulin resistance and diabetogenesis[7]. Furthermore, obesity-induced chronic low-grade inflammation (via proinflammatory cytokine secretion) and elevated free fatty acid flux induce whole-body glucose homeostasis perturbation[8]. These obesity-related metabolic disturbances can be further aggravated by chronic hyperglycemia, exacerbating the pathological remodeling of adipocytes and forming a vicious cycle that progresses from insulin resistance to overt diabetes[9]. Therefore, investigating the effects of hyperglycemic environments on adipocyte differentiation and metabolic processes is crucial for elucidating the reciprocal interaction mechanisms between obesity and diabetes.
High-glucose (HG) environments profoundly impact adipocyte metabolism and function through diverse mechanisms. In mature adipocytes, HG exposure induces metabolic reprogramming characterized by enhanced lipolysis via glycerol-3-phosphate (G3P) synthesis[10], disrupted insulin signaling (e.g., reduced phosphorylation of Caveolin-1 and insulin receptor)[11], and oxidative stress due to elevated reactive oxygen species (ROS) production linked to NADPH oxidase 4 (NOX4) upregulation[12]. These changes impair insulin sensitivity and promote proinflammatory cytokine secretion [e.g., interleukin-6 (IL-6), tumor necrosis factor-alpha (TNF-α)], exacerbating systemic inflammation and metabolic dysregulation[13]. Additionally HG exposure alters the secretory phenotype of visceral adipocytes and has been shown in other cell types, such as bone-marrow adipocytes, to disrupt normal differentiation and favoring adipogenesis over osteoblastogenesis[12,14]. Therapeutic strategies targeting adipose browning and thermogenic pathways show promise in restoring metabolic homeostasis in diabetic states[15].
In preadipocytes, HG similarly disrupts metabolic and differentiation processes. Elevated glucose levels upregulate adipogenic markers [e.g., peroxisome proliferator-activated-receptor-gamma (PPARγ), CCAAT/enhancer-binding protein-alpha (C/EBPα)], accelerate lipid droplet formation, and perturb mitochondrial dynamics (e.g., fusion/fission imbalance), leading to hypertrophic lipid accumulation[14,16]. HG also amplifies crosstalk between metabolic and hormonal signaling pathways. For instance, L-cysteine supplementation enhances glucose utilization via glucose transporter 4 (GLUT4) and disulfide bond-forming protein A-like (DsbA L) upregulation[17], while oleic acid potentiates insulin receptor phosphorylation by inhibiting protein tyrosine phosphatase 1B (PTP1B), thereby improving glucose uptake[18]. These findings underscore the dual role of glucose as both an energy substrate and a regulatory molecule, influencing adipocyte differentiation, lipid metabolism, and inflammatory responses. Collectively, these studies highlight the multifaceted effects of hyperglycemia on adipose tissue remodeling, emphasizing the need for targeted interventions to mitigate obesity-related metabolic complications[15,19,20].
Metabolomic profiling based on serum and tissue samples combined with mass spectrometry platforms has been increasingly applied to identify stable and clinically translatable metabolite biomarkers for disease diagnosis[21]. Existing studies on adipocyte metabolism under HG conditions exhibit critical gaps that hinder a comprehensive understanding of how mature adipocytes and preadipocytes differentially respond to hyperglycemic stress. While prior research has extensively characterized HG-induced lipolysis, insulin resistance, and oxidative stress in mature adipocytes[10-12], it has largely neglected preadipocytes, and most studies have not systematically compared the metabolic adaptations of precursor and mature adipocytes to high glucose. For instance, mature adipocytes under HG exhibit impaired insulin signaling and ROS-driven dysfunction[12,14], whereas preadipocytes show accelerated lipid synthesis and differentiation via upregulated PPARγ/C/EBPα[14,16].
These studies collectively illustrate the multifaceted effects of HG environments on adipocyte biology, emphasizing the importance of glucose regulation in preventing inflammation and metabolic dysregulation. Understanding these mechanisms is crucial for developing therapeutic strategies to mitigate the adverse effects of hyperglycemia in metabolic diseases. Despite growing insights into the cellular responses to HG exposure, a comprehensive comparison of the secretory metabolomes between preadipocytes and mature adipocytes under such conditions remains lacking. Addressing this knowledge gap could further elucidate the distinct metabolic adaptations occurring during adipocyte differentiation and provide new targets for intervention.
Investigating the metabolomic differences between mature adipocytes and preadipocytes under HG conditions aims to elucidate their distinct metabolic responses to glucotoxic stress and their pathological roles in metabolic diseases. Mature adipocytes, as central units for energy storage, exhibit enhanced lipid synthesis, suppressed oxidative metabolism, and accumulation of lipotoxic substances under HG stimulation, directly driving insulin resistance and chronic inflammation. In contrast, preadipocytes display aberrant proliferation and differentiation impairment due to HG-induced metabolic reprogramming, leading to dysfunctional adipose tissue and ectopic lipid deposition. Metabolomic comparisons systematically dissect critical disparities between these cell types in pathways such as glucose-lipid metabolism, oxidative stress, and mitochondrial function, clarifying cell-specific mechanisms underlying lipotoxicity, inflammatory signaling, and reduced insulin sensitivity. This research provides a theoretical foundation for targeted therapies in metabolic disorders such as obesity and diabetes and establishes a molecular basis for precision interventions leveraging metabolic reprogramming.
METHODS
Experimental design
Four experimental groups were established (n = 6 per group): (1) mature white visceral adipocytes (WAT-C) and (2) precursor white visceral adipocytes (Pre-WAT-C) under basal conditions, to control for osmotic effects, parallel groups were treated with 25 mM mannitol (Sigma, Cat# M4125); (3) preadipocytes exposed to 25 mM glucose (Pre-WAT-HG); (4) mature adipocytes exposed to 25 mM glucose (WAT-HG). HG conditions were achieved by adding 19.5 mM D-glucose to the basal 5.5 mM glucose concentration.
Cell culture and differentiation
Human visceral white preadipocytes (HPA-v; Cat. No. 7210; ScienCell Research Laboratories, Inc., Carlsbad, CA, USA) were purchased and cultured according to the manufacturer’s instructions. For WAT-HG and WAT-C groups, human preadipocytes (ScienCell Research Laboratories) were cultured in Preadipocyte Medium (PAM) medium (ScienCell, USA) supplemented with 10% fetal bovine serum (FBS) at 37 °C and 5% CO2. Cells within five passages were grown to three days post-confluency before initiating differentiation. Differentiation was induced using a cocktail containing Dulbecco’s Modified Eagle Medium/Nutrient Mixture F-12 (DMEM/F12), 0.5 mM 3-isobutyl-1-methylxanthine, 0.5 μM insulin, 1 μM dexamethasone, and 1 μM rosiglitazone (all from Sigma, USA). After four days, the medium was replaced with DMEM/F12 maintenance medium containing insulin (0.5 μM) for an additional 4 days. At Day 8, cells were serum-starved for 12 h in DMEM (1 g/L glucose, no FBS, 1% penicillin/streptomycin). Following starvation, fresh DMEM containing 25 mM glucose or mannitol was added, and cells were incubated for 12 h under standard conditions.
For Pre-WAT-HG and Pre-WAT-C groups, human preadipocytes (ScienCell Research Laboratories) were cultured in PAM medium (ScienCell, USA) supplemented with 10% FBS at 37 °C and 5% CO2. Cells were grown to three days post-confluency and then maintained in the same PAM medium (without any differentiation-inducing agents) for a total culture duration of 8 days, without initiating the differentiation protocol. At Day 8, cells were serum-starved for 12 h in DMEM (1 g/L glucose, no FBS, 1% penicillin/streptomycin). Following starvation, fresh DMEM containing 25 mM glucose or mannitol was added, and cells were treated with 25 mM mannitol (Sigma, Cat# M4125) for 12 h.
Sample collection and processing
Supernatants were harvested by gently agitating culture plates to homogenize the medium, followed by centrifugation at 800 × g for 5 min at 4 °C (Eppendorf 5810R). Clarified supernatants were aliquoted and stored at -80 °C. Hemolysis was assessed using a hemoglobin enzyme-linked immunosorbent assay (ELISA) (Abcam, Cat# ab234615), and samples with Optical density at 540 nm (OD540) > 0.2 were excluded from further analysis. For cell harvesting, cells were rinsed three times with ice-cold PBS, detached using cell scrapers (Corning, Cat# 353085), and pelleted by centrifugation at 300 × g for 5 min. Cell pellets were snap-frozen in liquid nitrogen and stored at -80 °C until further analysis.
The human cohort data were derived from a previously established and published cohort from our research group, as reported in our earlier study (DOI: 10.3389/fendo.2022.1097612). Detailed information regarding the population source, inclusion and exclusion criteria, and clinical characterization has been fully described in that publication. Briefly, Animal procedures were approved by Tongren Hospital Animal Ethics Committee (Ref: A2022-016-01; 10/27/2022). The clinical study was approved by the Internal Review and Ethics Boards of Tongren Hospital, affiliated with Shanghai Jiao Tong University School of Medicine (Approval No. 2022-049-01).
Metabolomic profiling
Metabolomic analysis was performed using ultra-high-performance liquid chromatography (UHPLC) coupled with a Q Exactive HF-X Hybrid Quadrupole-Orbitrap mass spectrometer (Thermo Scientific). The UHPLC system was equipped with a C18 column (2.1 mm × 100 mm, 1.7 μm) and operated with a mobile phase consisting of 0.1% formic acid in water (A) and 0.1% formic acid in acetonitrile (B). The gradient program was as follows: 5% B (0-1 min), 95% B (10-12 min), and 5% B (12.1-15 min). The mass spectrometer was operated in positive and negative electrospray ionization (ESI) modes, with a scan range of m/z 50-1,500. Raw data were processed using Compound Discoverer 3.1 (Thermo Scientific) and annotated against the Human Metabolome Database (HMDB) and LipidMaps.
Unsupervised principal component analysis (PCA) was first performed to assess the overall metabolic variation and clustering patterns among groups. Subsequently, supervised orthogonal partial least squares discriminant analysis (OPLS-DA) was applied to identify metabolites contributing to group discrimination. Model robustness was evaluated using cross-validation (7-fold cross-validation) and permutation testing (200 permutations) to avoid overfitting. Differential metabolites were selected based on the following criteria: variable importance in projection (VIP) score > 1.0 derived from the OPLS-DA model, unadjusted P value < 0.05 from univariate statistical analysis, and false discovery rate (FDR)-adjusted q value using the Benjamini-Hochberg procedure.
Metabolite identification was conducted by matching accurate mass (mass error < 5 ppm), retention time, and Tandem mass spectrometry (MS/MS) fragmentation patterns against public databases, including HMDB and The METLIN metabolite database (METLIN). Where available, metabolite identities were further confirmed using authentic chemical standards analyzed under identical Liquid chromatography-mass spectrometry (LC-MS) conditions.
Functional validation assays
To assess hypoxanthine [Hx; MCE, USA; purity ≥ 99.85% by high-performance liquid chromatography (HPLC)]-induced effects on adipogenesis, cells were treated with Hx throughout differentiation. Control groups received 1% dimethyl sulfoxide (DMSO) (Hx vehicle). Media were refreshed every 48 h. Differentiation efficiency was evaluated by Day 8 via intracellular triglyceride (TG) quantification and Oil Red O (ORO) staining.
Adipogenesis was quantified by ORO staining. Cells were fixed with 4% paraformaldehyde, stained with 0.3% ORO (Sigma, Cat# O 0625), and imaged using a Nikon Eclipse Ti microscope. Lipid content was quantified by eluting the stain with isopropanol and measuring the optical density at 510 nm (OD510). Gene expression of adipogenic markers (PPARγ and CCAAT/enhancer-binding protein-alpha (C/EBPα) was assessed by quantitative real-time polymerase chain reaction (qPCR). RNA was extracted using TRIzol (Invitrogen), reverse-transcribed using the Takara PrimeScript RT Kit, and amplified using specific primers.
Thermogenesis was evaluated by Western blot analysis of uncoupling protein 1 (UCP1) and mitochondrial respiration assays. Proteins were extracted using radio-immunoprecipitation assay (RIPA) buffer, separated on 10% sodium dodecyl sulfate-polyacrylamide gel electrophoresis (SDS-PAGE) gels, and transferred to polyvinylidene difluoride (PVDF) membranes. Antibodies against UCP1 (Abcam, Cat# ab10983, 1:1,000) and β-actin (Cell Signaling, Cat# 4970, 1:5,000) were used for detection. Mitochondrial respiration was measured using a Seahorse XFe96 Analyzer (Agilent) with oligomycin (1 μM), carbonyl cyanide-4-(trifluoromethoxy)phenylhydrazone (FCCP) (2 μM), and rotenone/antimycin A (0.5 μM).
Following treatment, preadipocytes and mature adipocytes were harvested and lysed using RIPA buffer supplemented with protease and phosphatase inhibitors. Total protein concentrations were determined using the bicinchoninic acid (BCA) assay. Equal amounts of protein (20-30 μg) were separated by SDS-PAGE and transferred onto PVDF membranes. After blocking with 5% non-fat milk for 1 h at room temperature, membranes were incubated overnight at 4 °C with primary antibodies against xanthine dehydrogenase (XDH), adenosine monophosphate deaminase 2 (AMPD2), hypoxanthine-guanine phosphoribosyltransferase (HGPRT), and β-actin (used as an internal control). The following day, membranes were incubated with horseradish peroxidase-conjugated secondary antibodies for 1 h at room temperature. Protein bands were visualized using enhanced chemiluminescence (ECL) and imaged. Band intensities were quantified using ImageJ software, and relative protein expression levels were calculated as the ratio of the target protein to β-actin. Statistical analysis was performed using GraphPad Prism 9.0.
Animal rearing and treatment with hypoxanthine (Hx)
Tu strain zebrafish larvae (China Zebrafish Resource Center) were maintained at the Model Animal Research Center, Hongqiao Institute for International Medical Sciences, Shanghai Jiao Tong University. Fertilized eggs collected at 6 h post-fertilization (hpf) were cultured in E3 medium supplemented with 200 μM 1-phenyl-2-thiourea (phenylthiourea, PTU). To determine a non-toxic dose, embryos were exposed to exogenous hypoxanthine (Hx; 0, 10, 50, or 250 μM) from 1 to 3 days post-fertilization (dpf); 200 μM Hx was selected for subsequent experiments. At 4 dpf, larvae (n = 17 per group) were randomly assigned to treatment groups and fed for 6 h/day from 4 to 6 dpf with either a high-fat diet (HFD) or a control diet. During feeding, larvae were concurrently exposed to exogenous Hx (200 μM) via the bathing medium. An HFD-induced obesity model with hypoxanthine intervention was thus established. From 7 to 9 dpf, larvae continued to receive daily Hx exposure, and lipid accumulation was assessed 18 h after the final feeding. All procedures were approved by the Tongren Hospital Animal Ethics Committee (Ref: A2022-016-01).
Zebrafish larvae lipid staining
Lipid accumulation was analyzed using ORO and Nile Red staining protocols. For ORO staining, larvae fixed at 7 dpf were incubated in 4% paraformaldehyde overnight at 4 °C, followed by three 5-min washes in PBS and a 30-min incubation in 60% isopropanol. Samples were then stained with freshly prepared ORO solution (ScienCell, USA) for 3 h, washed thrice with 60% isopropanol (5 min/wash), transferred to PBS, and imaged using an Optec SZ760 stereomicroscope. For Nile Red staining, live larvae were incubated in 5 mL E3 fish water containing 0.5 µg/mL Nile Red (diluted from a 1.25 mg/mL acetone stock) for 30 min at room temperature in the dark. After staining, zebrafish were anesthetized and imaged immediately under an immunofluorescence microscope.
RNA sequencing and data analysis
Cells treated with 200 μM hypoxanthine (Hx) for eight days, alongside untreated control groups at corresponding timepoints (D8), were subjected to RNA sequencing (n = 3 biological replicates per group). Differential expression analysis identified differentially expressed genes (DEGs) between Hx-treated and control groups. Functional annotation of DEGs included Gene Ontology (GO) enrichment, pathway analysis, hierarchical clustering, and protein-protein interaction network construction.
RESULTS
Adipocyte differentiation and morphological changes
Multivariate metabolomic analysis revealed clear metabolic divergence among experimental groups. PCA showed robust separation between mature (WAT-C) and precursor adipocytes (Pre-WAT-C) under basal conditions, with principal component 1 (PC1) explaining 68.3% of the variance [Figure 1A and B]. HG exposure further enhanced metabolic heterogeneity, as Pre-WAT-HG separated distinctly from Pre-WAT-C along principal component 2 (PC2) (21.5% variance, P < 0.01; Figure 1B). These patterns were confirmed by OPLS-DA (coefficient of determination for Y variables, R2Y = 0.89; predictive goodness-of-fit, Q2 = 0.72), which identified purine metabolism-particularly hypoxanthine (VIP = 2.85) - as a major contributor to group discrimination [Figure 1C and D]. Model robustness was validated by permutation testing (Q2 intercept = -0.316, P < 0.001; Figure 1E and F). Consistently, volcano plot analysis identified significantly altered metabolites [log2 fold change (log2FC)| > 1 and false discovery rate (FDR) < 0.05], including elevated amino acids in WAT-C and reduced osmolytes in Pre-WAT-HG [Figure 2].
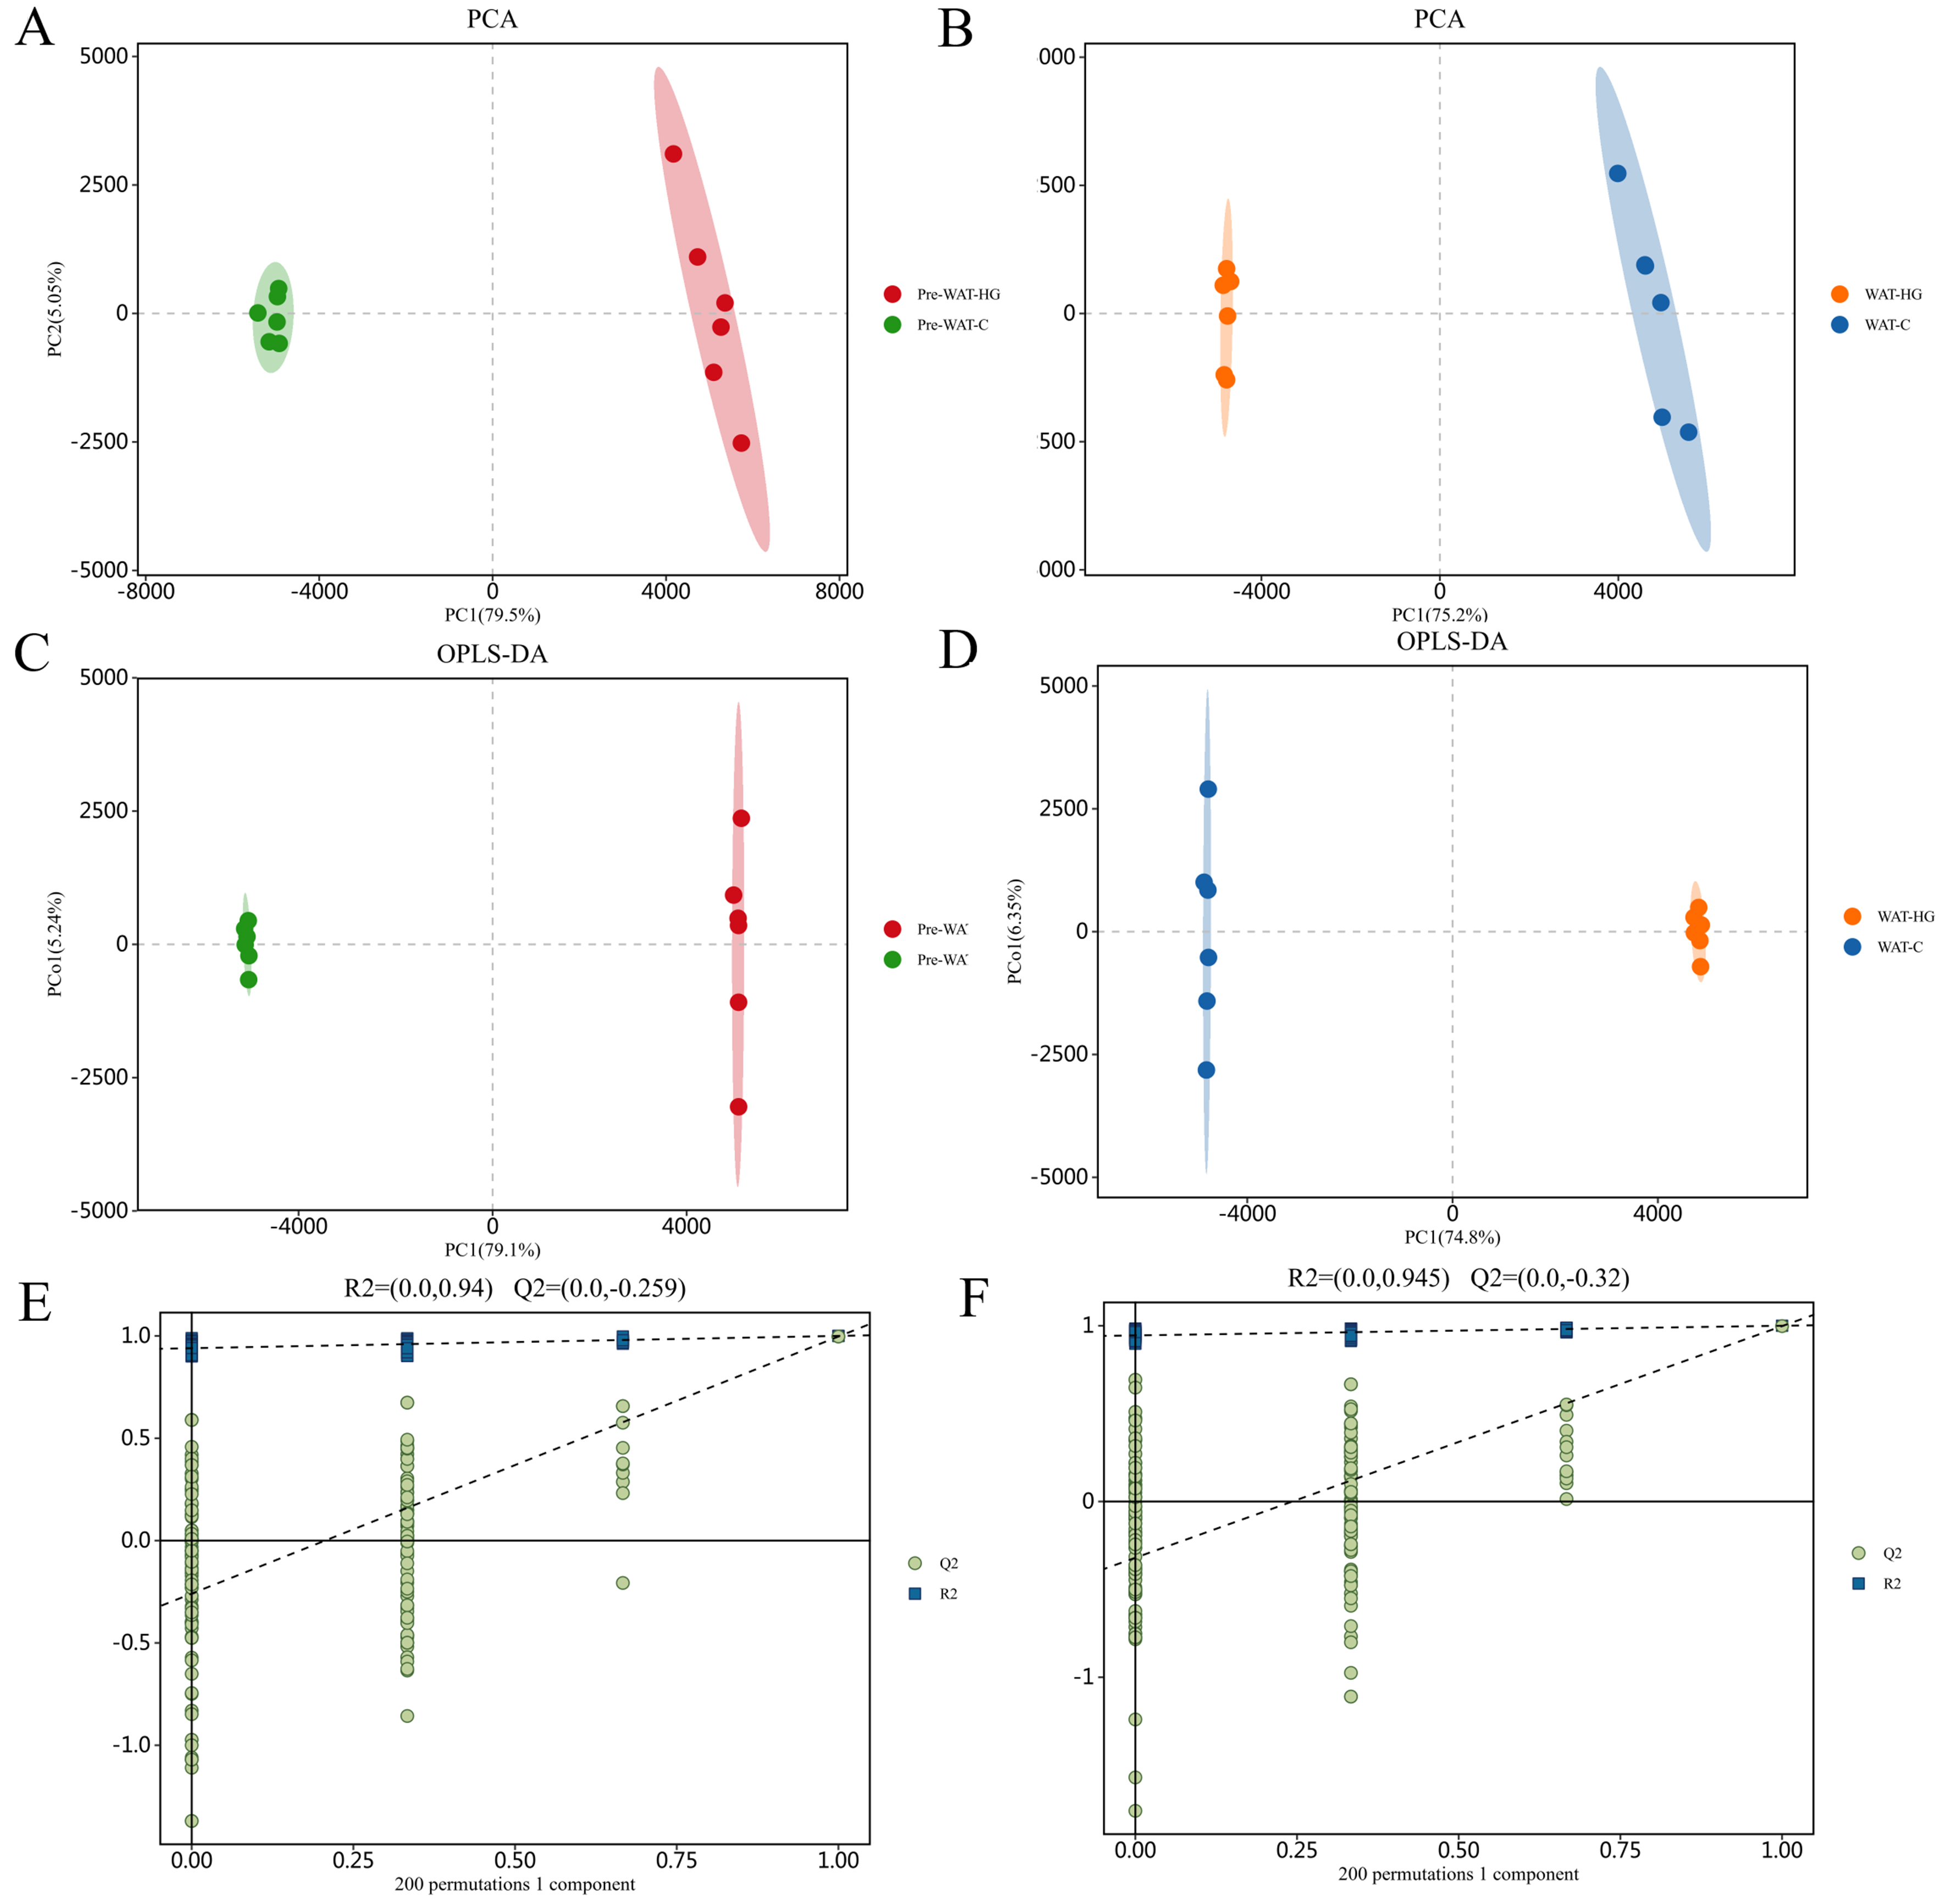
Figure 1. (A) PCA score plot revealing differential metabolic states of pre-WAT cultured under HG vs. C (n = 6 per group); (B) PCA score plot delineating HG-induced metabolic remodeling in WAT compared to C-maintained WAT; (C) OPLS-DA score plot contrasting metabolic divergence of HG-exposed WAT vs. HG-exposed pre-WAT, with explicit discrimination along predictive component; (D) OPLS-DA score plot revealing intervention-specific variance in HG-treated WAT compared to C-maintained WAT cohorts; (E) Permutation test confirming condition-specific discrimination in pre-WAT cultured under HG vs. C environments (95% confidence interval of permuted models shown in shaded area); (F) Validation plot for HG-induced metabolic perturbations in WAT vs. C-maintained WAT cohorts, with permuted Q2 values (-0.259) distinctly lower than original model (blue). C: Control; HG: high glucose; OPLS-DA: orthogonal partial least squares discriminant analysis; PCA: principal component analysis; pre-WAT: precursor white visceral adipocytes; Q2: predictive ability parameter; WAT: mature white visceral adipocytes.
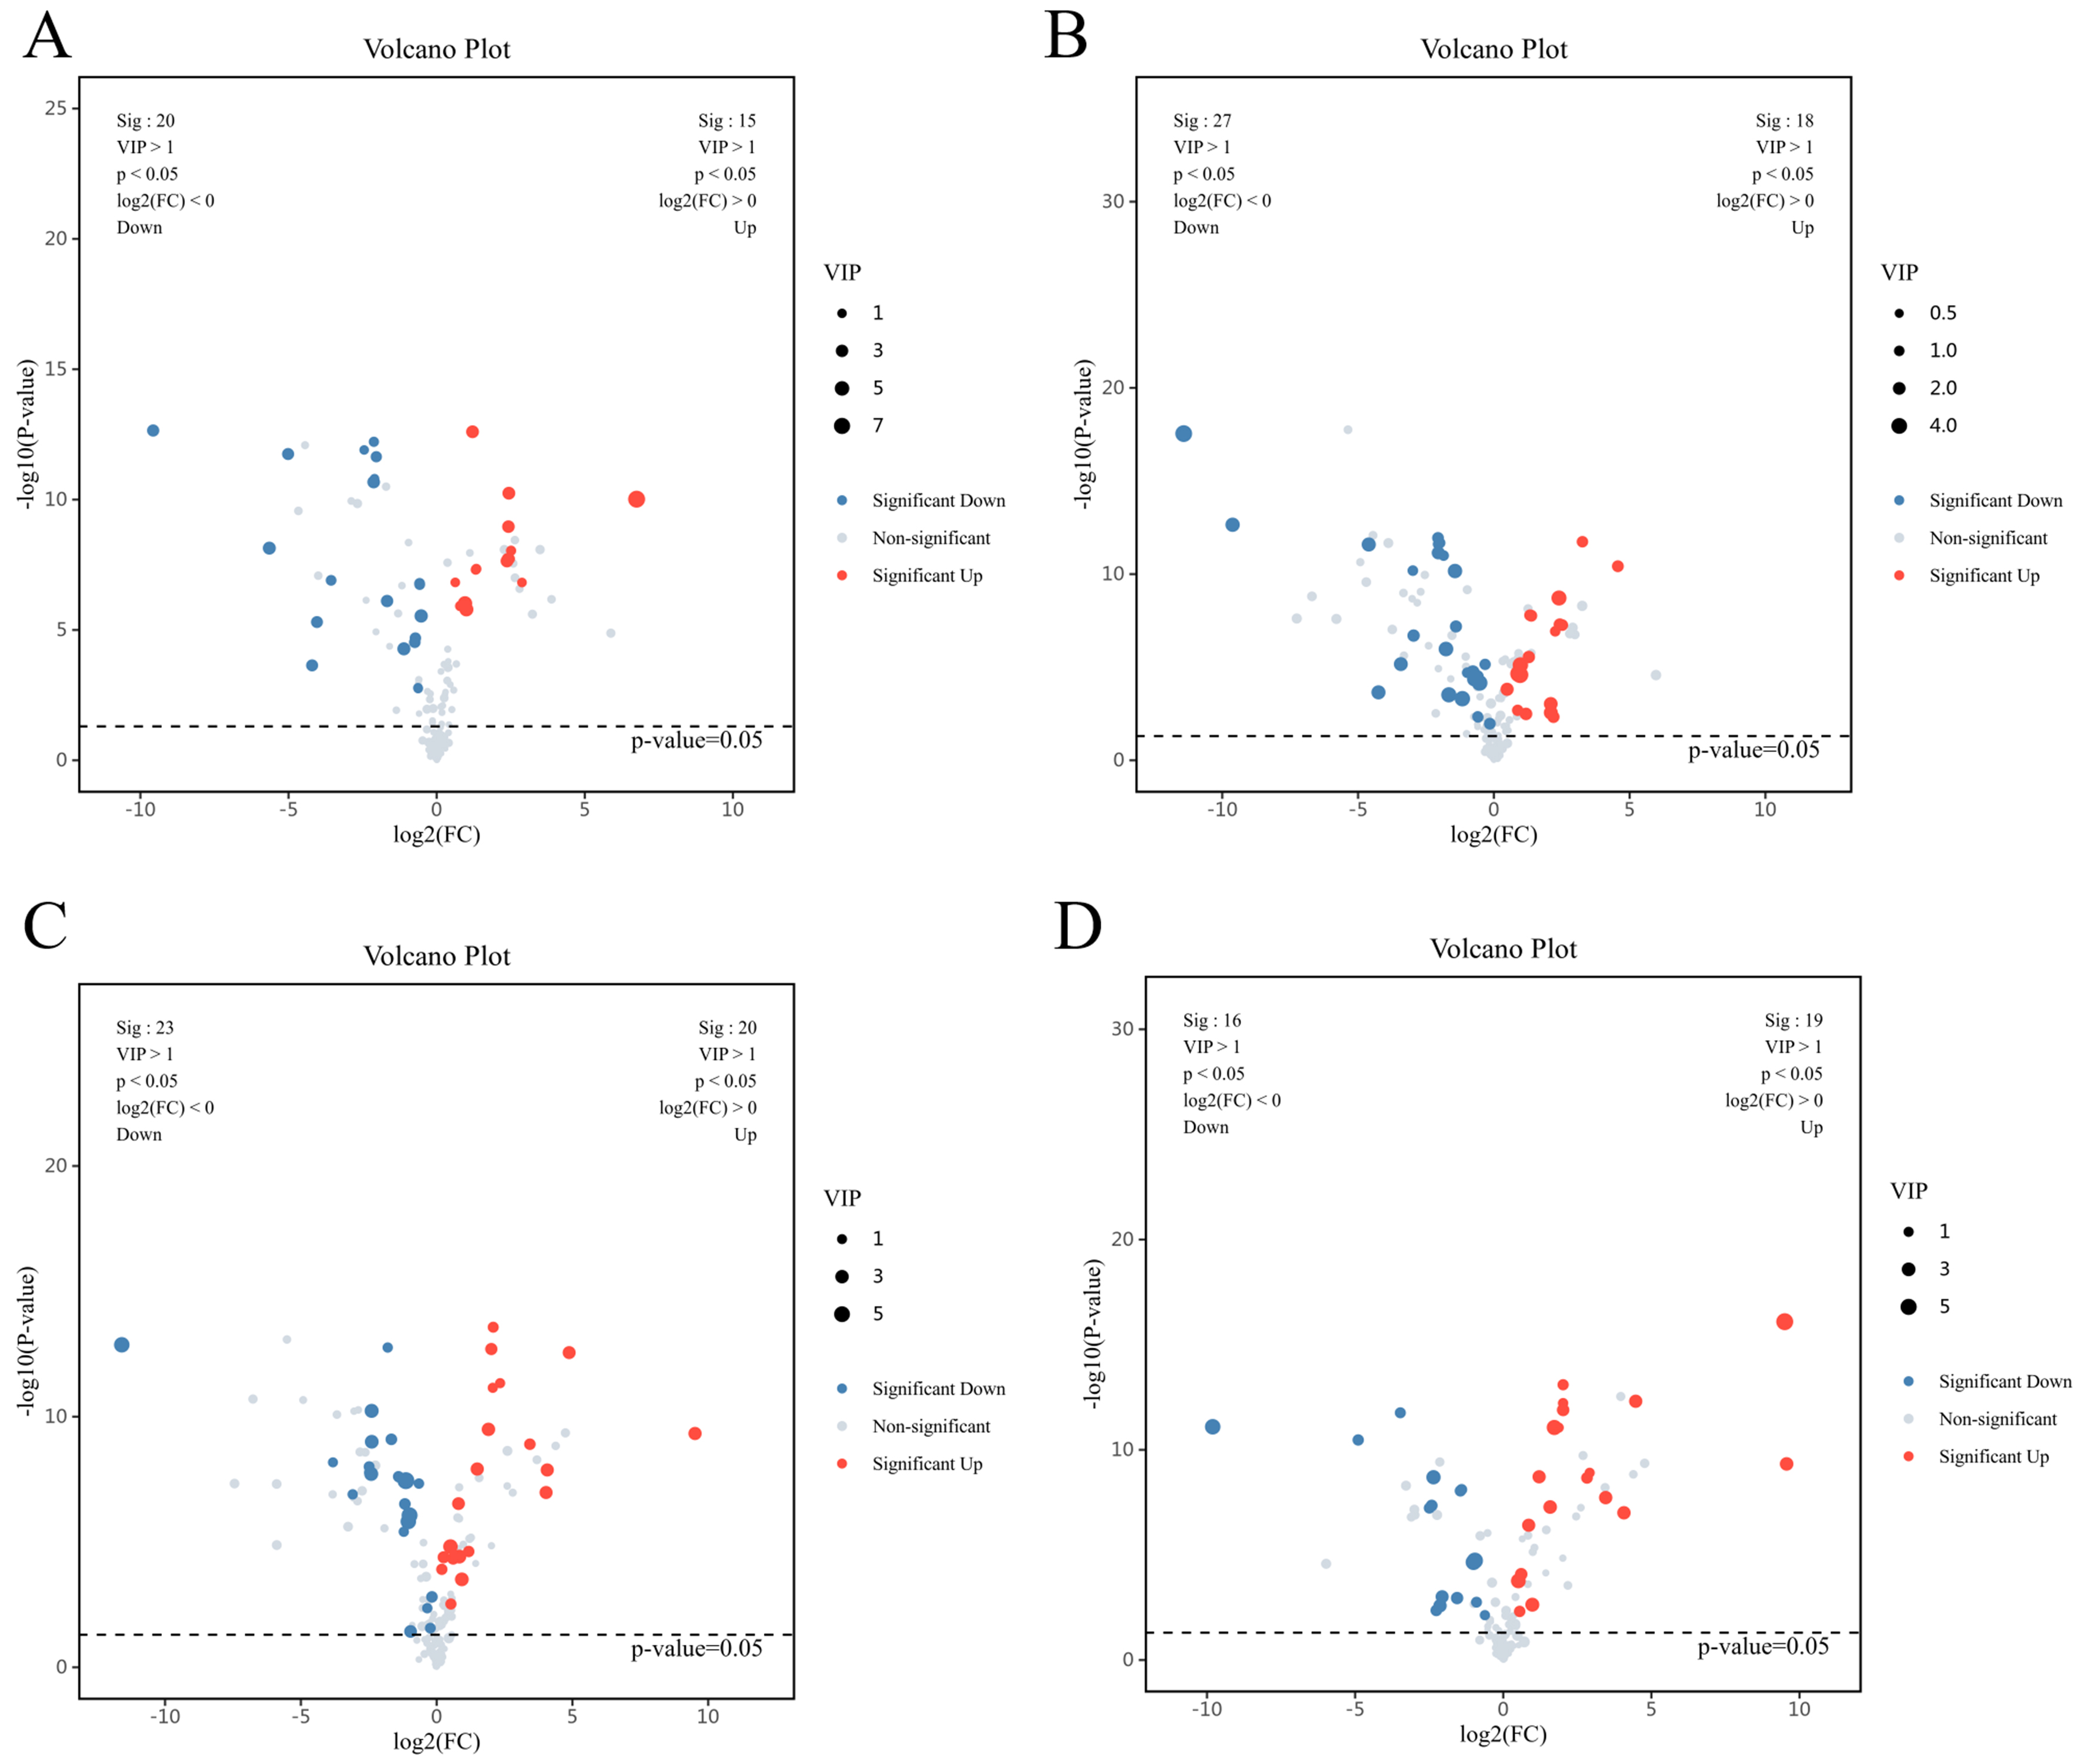
Figure 2. (A) Volcano plot illustrating differentially abundant metabolites between WAT and pre-WAT under C conditions. Dashed lines mark thresholds (|log2FC| > 1, FDR-adjusted P < 0.05); (B) Volcano plot identifying HG-induced cell-type-specific metabolic alterations (HG-treated WAT vs. HG-treated pre-WAT). Red/blue points denote metabolites significantly upregulated/downregulated in WAT; (C) Volcano plot revealing HG-responsive metabolites in mature adipocytes (HG-WAT vs. C-WAT). Annotated metabolites indicate key pathways perturbed by hyperglycemia; (D) Volcano plot highlighting glycemic stress-associated metabolic shifts in pre-WAT (HG-pre-WAT vs. C-pre-WAT). Grey dashed ellipse encloses metabolites with concerted regulation patterns. C: Control; FC: fold change; FDR: false discovery rate; HG: high glucose; pre-WAT: precursor white visceral adipocytes; WAT: mature white visceral adipocytes.
Metabolomic profiling revealed pronounced and stage-dependent remodeling of extracellular metabolites in visceral adipocytes under basal and HG conditions. Under basal glucose conditions, mature adipocytes exhibited a metabolite secretion profile clearly distinct from that of precursor cells, characterized by enrichment of aromatic- and amino-acid-related metabolites and concomitant reductions in redox-, nitrogen-, and purine-associated intermediates, including consistently lower levels of hypoxanthine [Table 1]. Exposure to high glucose elicited a markedly broader metabolic response in mature adipocytes. As summarized in Table 2, high glucose suppressed several aromatic amino-acid-derived metabolites while robustly increasing metabolites involved in purine and choline metabolism, with hypoxanthine emerging as one of the most strongly upregulated metabolites uniquely in mature cells. Direct comparison between HG- and basal-cultured mature adipocytes revealed the most extensive metabolic reorganization among all group contrasts, highlighted by pronounced induction of hypoxanthine, choline, and polyol-related metabolites alongside repression of aromatic amino-acid pathways [Table 3]. In contrast, precursor cells displayed a more restricted metabolic response to high glucose. As shown in Table 4, hyperglycemia primarily induced reductions in osmolytes, redox-associated metabolites, and hypoxanthine, suggesting that precursor cells predominantly mount osmotic and redox stress responses rather than the broad metabolic remodeling observed in mature adipocytes.
Differential metabolites identified between mature white adipocytes (WAT-C, n = 6) and preadipocytes (Pre-WAT-C, n = 6)
| Metabolites | KEGG | VIP | log2FoldChange | P-value | Q-value |
| Phenylalanine | 4.97 | 0.92 | 2.24E-05 | 9.80E-05 | |
| Leucine | 3.98 | -0.52 | 6.96E-05 | 2.60E-04 | |
| Glutamine | 3.77 | -1.16 | 4.90E-04 | 1.49E-03 | |
| Sulfate | 3.62 | -1.66 | 3.03E-04 | 9.71E-04 | |
| 3,4-Dihydroxyphenylpropionic acid | 3.50 | 2.40 | 1.92E-09 | 2.26E-08 | |
| Pantothenicacid(VitaminB5) | 3.22 | -1.76 | 1.05E-06 | 6.98E-06 | |
| Serine | C00065 | 3.08 | -1.43 | 6.83E-11 | 1.33E-09 |
| Indole-3-acetic acid | 3.00 | -9.62 | 2.23E-13 | 1.33E-11 | |
| Choline | 2.88 | -4.61 | 2.57E-12 | 7.66E-11 | |
| Hypoxanthine | C00262 | 2.85 | -4.25 | 2.24E-04 | 7.42E-04 |
| Indole-3-acrylic acid | 2.78 | 2.10 | 2.76E-03 | 7.28E-03 | |
| Tyrosine | C00082 | 2.64 | 2.09 | 9.34E-04 | 2.70E-03 |
| Pyroglutamic acid | C01879 | 2.52 | -0.74 | 4.53E-05 | 1.75E-04 |
| Mannitol | 2.27 | 0.49 | 1.53E-04 | 5.25E-04 | |
| N-Acetyl-L-cysteine | 2.25 | -2.05 | 7.23E-12 | 1.89E-10 | |
| Arginine | C00062 | 1.93 | 1.18 | 3.22E-03 | 8.37E-03 |
| Phenylalanine | 1.86 | 1.29 | 2.84E-06 | 1.65E-05 | |
| Urea | C00086 | 1.83 | -2.96 | 2.00E-07 | 1.45E-06 |
| Pantothenic acid | 1.71 | -1.39 | 6.48E-08 | 5.25E-07 | |
| Tryptophan | C00078 | 1.71 | 2.20 | 4.68E-03 | 1.16E-02 |
| Lysine | C00047 | 1.58 | 1.38 | 1.72E-08 | 1.60E-07 |
| sn-glycero-3-Phosphocholine | 1.57 | 4.57 | 3.78E-11 | 7.70E-10 | |
| N-Acetyl-L-cysteine | 1.53 | -2.06 | 1.14E-12 | 4.78E-11 | |
| Pipecolic acid | C00408 | 1.47 | 1.33 | 1.61E-08 | 1.53E-07 |
| Tyrosine | C00082 | 1.40 | 3.26 | 1.83E-12 | 6.64E-11 |
| chiro-inositol | 1.34 | -0.32 | 7.04E-06 | 3.68E-05 | |
| Valine | 1.17 | -0.59 | 4.47E-03 | 1.12E-02 | |
| Proline | C00148 | 1.09 | -1.98 | 2.11E-12 | 6.89E-11 |
| Pantolactone | 1.06 | -0.98 | 1.98E-05 | 8.78E-05 | |
| Glutamine | 1.05 | -1.85 | 1.01E-11 | 2.51E-10 | |
| LysoPC(0:0/16:0) | 1.04 | -2.98 | 6.50E-11 | 1.29E-09 | |
| Phenylacetic acid | C07086 | 1.00 | 2.26 | 1.18E-07 | 9.09E-07 |
Differential metabolites between high-glucose-treated mature white adipocytes (WAT-HG, n = 6) and high-glucose-treated preadipocytes (Pre-WAT-HG, n = 6)
| Metabolites | KEGG | VIP | log2FoldChange | P-value | Q-value |
| Iditol | C01697 | 6.13 | -1.13 | 3.57E-08 | 2.79E-07 |
| Phenylalanine | 5.17 | -1.00 | 8.61E-07 | 4.96E-06 | |
| Leucine | 3.86 | 0.51 | 1.52E-05 | 6.25E-05 | |
| 3,4-Dihydroxyphenylpropionic acid | 3.47 | -2.39 | 5.86E-11 | 1.14E-09 | |
| Indole-3-acrylic acid | 3.44 | -2.41 | 1.93E-08 | 1.69E-07 | |
| Glutamine | 3.24 | 0.93 | 3.09E-04 | 9.55E-04 | |
| Tyrosine | C00082 | 3.24 | -2.39 | 1.00E-09 | 1.31E-08 |
| Serine | C00065 | 3.01 | 1.91 | 3.21E-10 | 4.70E-09 |
| Indole-3-acetic acid | 2.86 | 9.51 | 4.69E-10 | 6.53E-09 | |
| Pantothenicacid(VitaminB5) | 2.86 | 1.49 | 1.23E-08 | 1.15E-07 | |
| Hypoxanthine | C00262 | 2.80 | 4.07 | 1.34E-08 | 1.23E-07 |
| Choline | 2.69 | 4.88 | 2.78E-13 | 1.29E-11 | |
| Sulfate | 2.51 | -0.96 | 3.70E-02 | 7.34E-02 | |
| Pyroglutamic acid | C01879 | 2.18 | 0.61 | 4.57E-05 | 1.66E-04 |
| N-Acetyl-L-cysteine | 2.17 | 2.01 | 2.00E-13 | 1.05E-11 | |
| Tryptophan | C00078 | 2.08 | -2.45 | 1.68E-08 | 1.51E-07 |
| Arginine | C00062 | 1.84 | -1.17 | 3.04E-07 | 1.88E-06 |
| Pantothenic acid | 1.82 | -1.67 | 8.03E-10 | 1.08E-08 | |
| Urea | C00086 | 1.76 | 3.43 | 1.25E-09 | 1.56E-08 |
| Phenylalanine | 1.70 | 1.18 | 2.39E-05 | 9.28E-05 | |
| chiro-inositol | 1.63 | 0.19 | 1.23E-04 | 4.03E-04 | |
| Lysine | C00047 | 1.53 | -1.41 | 2.45E-08 | 2.07E-07 |
| N-Acetyl-L-cysteine | 1.48 | 2.08 | 2.70E-14 | 3.76E-12 | |
| Pipecolic acid | C00408 | 1.44 | -1.39 | 2.55E-08 | 2.13E-07 |
| Pyroglutamic acid | 1.17 | -0.35 | 4.37E-03 | 1.10E-02 | |
| Tyrosine | C00082 | 1.17 | -3.09 | 1.26E-07 | 8.48E-07 |
| Pantolactone | 1.16 | -1.21 | 3.90E-06 | 1.87E-05 | |
| Glutamine | 1.15 | -1.80 | 1.75E-13 | 9.73E-12 | |
| Proline | C00148 | 1.06 | 2.34 | 4.61E-12 | 1.48E-10 |
| sn-glycero-3-Phosphocholine | 1.03 | -3.82 | 6.65E-09 | 6.77E-08 |
Differential metabolites between high-glucose-treated mature white adipocytes (WAT-HG, n = 6) and normal medium-cultured mature white adipocytes (WAT-C, n = 6)
| Metabolites | KEGG | VIP | log2FoldChange | P-value | Q-value |
| Iditol | C01697 | 5.77 | 9.50 | 8.06E-17 | 3.37E-14 |
| Phenylalanine | 5.01 | -0.96 | 1.87E-05 | 1.09E-04 | |
| Mannitol | 4.47 | -9.81 | 8.03E-12 | 2.62E-10 | |
| chiro-inositol | 4.17 | 1.72 | 8.69E-12 | 2.62E-10 | |
| Leucine | 3.84 | 0.51 | 1.72E-04 | 8.06E-04 | |
| 3,4-Dihydroxyphenylpropionic acid | 3.46 | -2.35 | 2.02E-09 | 2.52E-08 | |
| Glutamine | 3.22 | 0.98 | 2.33E-03 | 9.21E-03 | |
| Pantothenicacid(VitaminB5) | 2.95 | 1.58 | 5.27E-08 | 4.78E-07 | |
| Indole-3-acetic acid | 2.91 | 9.57 | 4.69E-10 | 7.12E-09 | |
| Hypoxanthine | C00262 | 2.80 | 4.07 | 9.89E-08 | 8.43E-07 |
| Choline | 2.72 | 4.47 | 4.90E-13 | 2.92E-11 | |
| Serine | C00065 | 2.69 | 1.21 | 1.92E-09 | 2.43E-08 |
| Pyroglutamic acid | 2.67 | 0.86 | 3.87E-07 | 2.94E-06 | |
| Tyrosine | C00082 | 2.61 | -2.06 | 9.74E-04 | 4.09E-03 |
| N-Acetyl-L-cysteine | 2.21 | 2.02 | 1.28E-12 | 6.66E-11 | |
| Pyroglutamic acid | C01879 | 2.20 | 0.61 | 8.26E-05 | 4.13E-04 |
| Arginine | C00062 | 2.14 | -1.56 | 1.13E-03 | 4.63E-03 |
| Urea | C00086 | 1.74 | 2.83 | 2.17E-09 | 2.63E-08 |
| Tryptophan | C00078 | 1.71 | -2.26 | 4.35E-03 | 1.63E-02 |
| Lysine | C00047 | 1.59 | -1.45 | 8.99E-09 | 9.04E-08 |
| sn-glycero-3-Phosphocholine | 1.57 | -4.90 | 3.41E-11 | 7.36E-10 | |
| N-Acetyl-L-cysteine | 1.50 | 2.02 | 8.05E-14 | 7.59E-12 | |
| Pipecolic acid | C00408 | 1.48 | -1.40 | 7.80E-09 | 8.05E-08 |
| Tyrosine | C00082 | 1.40 | -3.47 | 1.74E-12 | 8.52E-11 |
| Indole | C00463 | 1.05 | -0.62 | 7.32E-03 | 2.60E-02 |
| Proline | C00148 | 1.03 | 1.87 | 8.81E-12 | 2.62E-10 |
| LysoPC(0:0/16:0) | 1.01 | 2.92 | 1.24E-09 | 1.72E-08 |
Differential metabolites identified between preadipocytes cultured in high-glucose (Pre-WAT-HG, n = 6) and normal medium (Pre-WAT-C, n = 6)
| Metabolites | KEGG | VIP | log2FoldChange | P-value | Q-value |
| Iditol | C01697 | 8.02 | 6.75 | 9.61E-11 | 1.87E-09 |
| Phenylalanine | 4.90 | 0.96 | 9.55E-07 | 6.49E-06 | |
| Leucine | 3.82 | -0.52 | 2.90E-06 | 1.72E-05 | |
| Glutamine | 3.60 | -1.11 | 5.29E-05 | 2.51E-04 | |
| Mannitol | 3.51 | -5.65 | 7.26E-09 | 8.08E-08 | |
| 3,4-Dihydroxyphenylpropionic acid | 3.35 | 2.44 | 5.67E-11 | 1.13E-09 | |
| chiro-inositol | 3.34 | 1.21 | 2.50E-13 | 1.30E-11 | |
| Indole-3-acrylic acid | 3.30 | 2.37 | 2.27E-08 | 2.13E-07 | |
| Serine | C00065 | 3.20 | -2.13 | 2.12E-11 | 4.78E-10 |
| Tyrosine | C00082 | 3.13 | 2.42 | 1.09E-09 | 1.54E-08 |
| Pantothenicacid(VitaminB5) | 2.98 | -1.67 | 7.76E-07 | 5.40E-06 | |
| Indole-3-acetic acid | 2.81 | -9.57 | 2.23E-13 | 1.24E-11 | |
| Choline | 2.71 | -5.01 | 1.78E-12 | 6.20E-11 | |
| Hypoxanthine | C00262 | 2.80 | -4.20 | 2.28E-04 | 9.93E-04 |
| Pyroglutamic acid | C01879 | 2.38 | -0.74 | 2.96E-05 | 1.45E-04 |
| N-Acetyl-L-cysteine | 2.11 | -2.04 | 2.27E-12 | 7.09E-11 | |
| Tryptophan | C00078 | 1.99 | 2.39 | 1.84E-08 | 1.81E-07 |
| Urea | C00086 | 1.76 | -3.56 | 1.25E-07 | 1.00E-06 |
| Arginine | C00062 | 1.54 | 0.80 | 1.21E-06 | 7.81E-06 |
| Lysine | C00047 | 1.45 | 1.34 | 4.55E-08 | 3.88E-07 |
| N-Acetyl-L-cysteine | 1.45 | -2.12 | 6.05E-13 | 2.66E-11 | |
| Pipecolic acid | C00408 | 1.36 | 1.32 | 4.87E-08 | 4.11E-07 |
| Valine | 1.16 | -0.63 | 1.65E-03 | 6.34E-03 | |
| Tyrosine | C00082 | 1.12 | 2.88 | 1.51E-07 | 1.18E-06 |
| Proline | C00148 | 1.07 | -2.45 | 1.24E-12 | 4.72E-11 |
Effects of high glucose on the expression of purine metabolism-related enzymes
To investigate the molecular mechanism underlying high glucose-induced hypoxanthine accumulation, we examined the expression levels of key enzymes involved in purine metabolism by Western blot. The results showed that HG treatment did not significantly alter the protein expression levels of XDH or AMPD2 in either preadipocytes or mature adipocytes. Notably, HG treatment significantly reduced the protein expression level of HGPRT, and this effect reached statistical significance in both mature adipocytes and preadipocytes [Supplementary Figure 1]. HGPRT is a critical salvage pathway enzyme responsible for converting hypoxanthine back into inosine monophosphate (IMP). Its downregulation likely impairs the reutilization of hypoxanthine, thereby contributing to its accumulation under HG conditions. This finding provides a potential molecular explanation for hypoxanthine accumulation observed under glucotoxic stress.
Metabolomic profiling
Metabolomic profiling revealed striking differentiation stage-dependent responses to HG stress. Venn diagram analysis [Figure 3A] showed that significantly altered metabolites (FDR < 0.05) in mature adipocytes (WAT-HG vs. WAT-C) vastly outnumbered those in precursor cells (Pre-WAT-HG vs. Pre-WAT-C), with minimal overlap (n = 3). Hierarchical clustering [Figure 3B] confirmed this divergence, as mature adipocytes under high glucose formed a distinct cluster from controls, whereas precursor cells showed no clear segregation. Kyoto Encyclopedia of Genes and Genomes (KEGG) pathway enrichment analysis revealed distinct metabolic responses to high glucose in mature and precursor white adipocytes [Figure 4]. In mature white adipocytes (WAT), high glucose significantly upregulated pathways associated with amino acid and nucleotide metabolism, including D-Amino acid metabolism, Arginine biosynthesis, and Purine metabolism [Figure 4A], while downregulating lipid metabolism pathways such as glycerophospholipid and sphingolipid metabolism [Figure 4B]. In contrast, precursor white adipocytes (pre-WAT) exhibited a highly specific upregulation of aromatic amino acid biosynthesis (Phenylalanine, tyrosine and tryptophan biosynthesis) upon HG stimulation [Figure 4C], followed by broad suppression of core amino acid metabolic pathways [Figure 4D]. These findings demonstrate a differentiation-stage-specific metabolic remodeling program in white adipocytes in response to hyperglycemic stress.
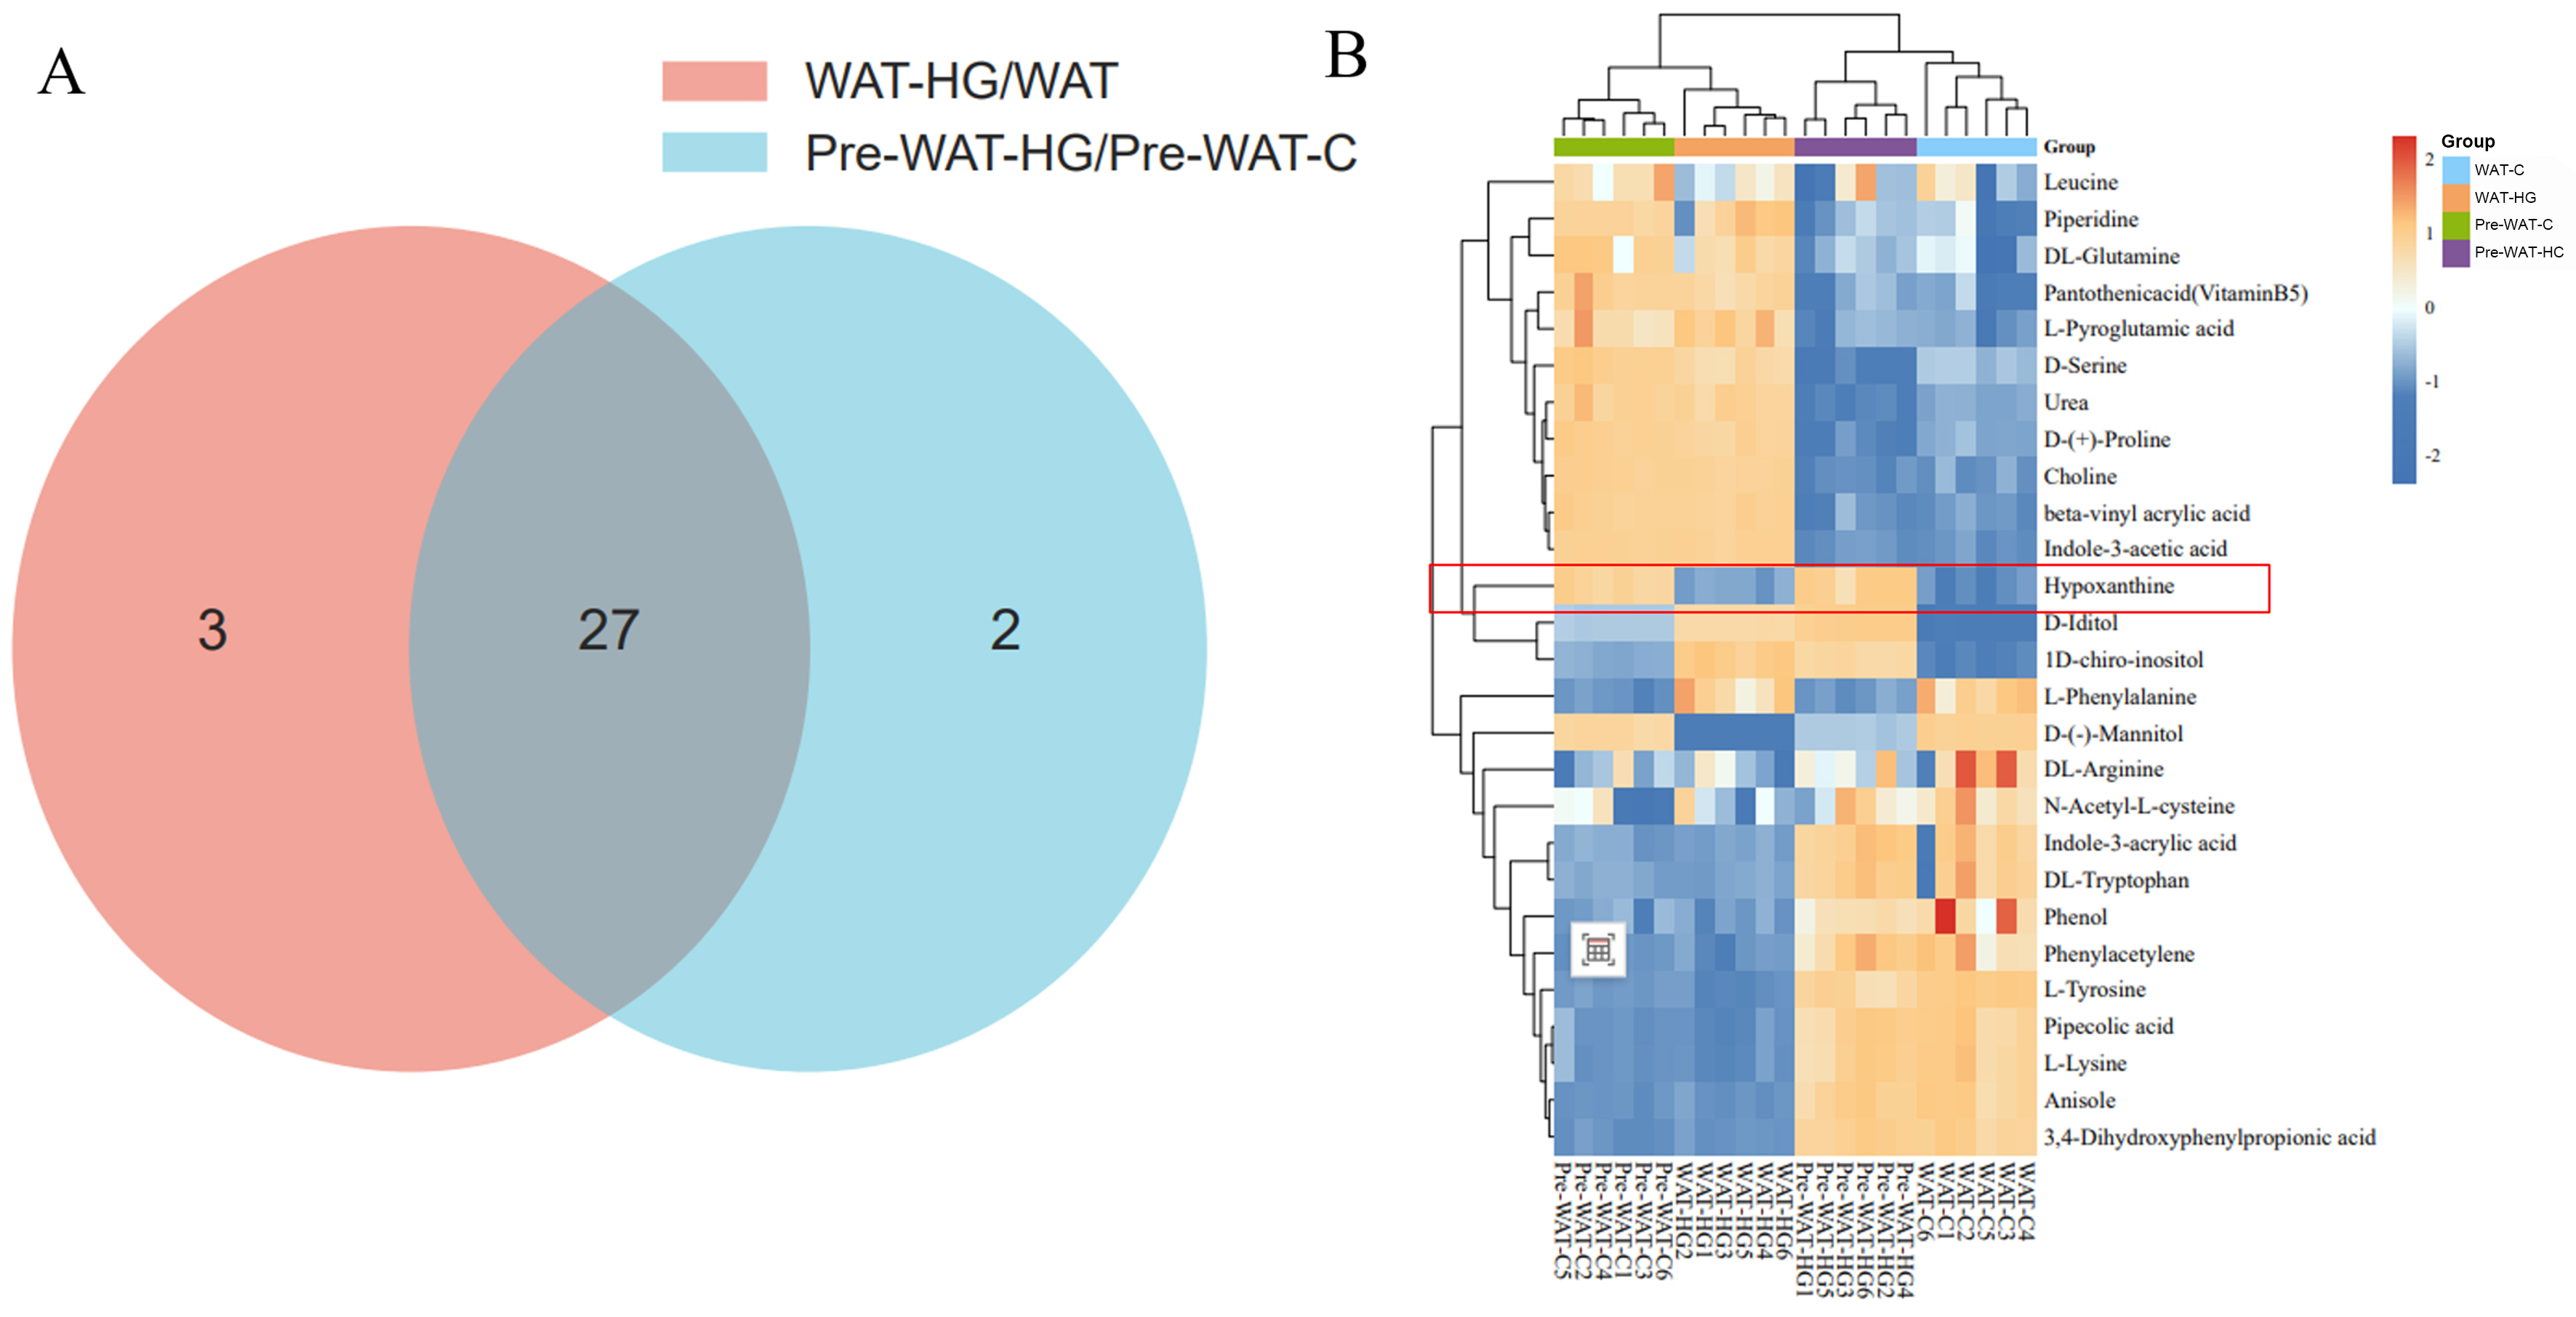
Figure 3. (A) Venn diagram analysis of dysregulated metabolites, showing significantly altered metabolites (FDR < 0.05) in WAT-HG vs. WAT-C and pre-WAT-HG vs. pre-WAT-C under high-glucose stimulation; (B) Hierarchical clustering of differentially abundant metabolites. C: Control; FDR: false discovery rate; HG: high glucose; pre-WAT: precursor white visceral adipocytes; WAT: mature white visceral adipocytes.
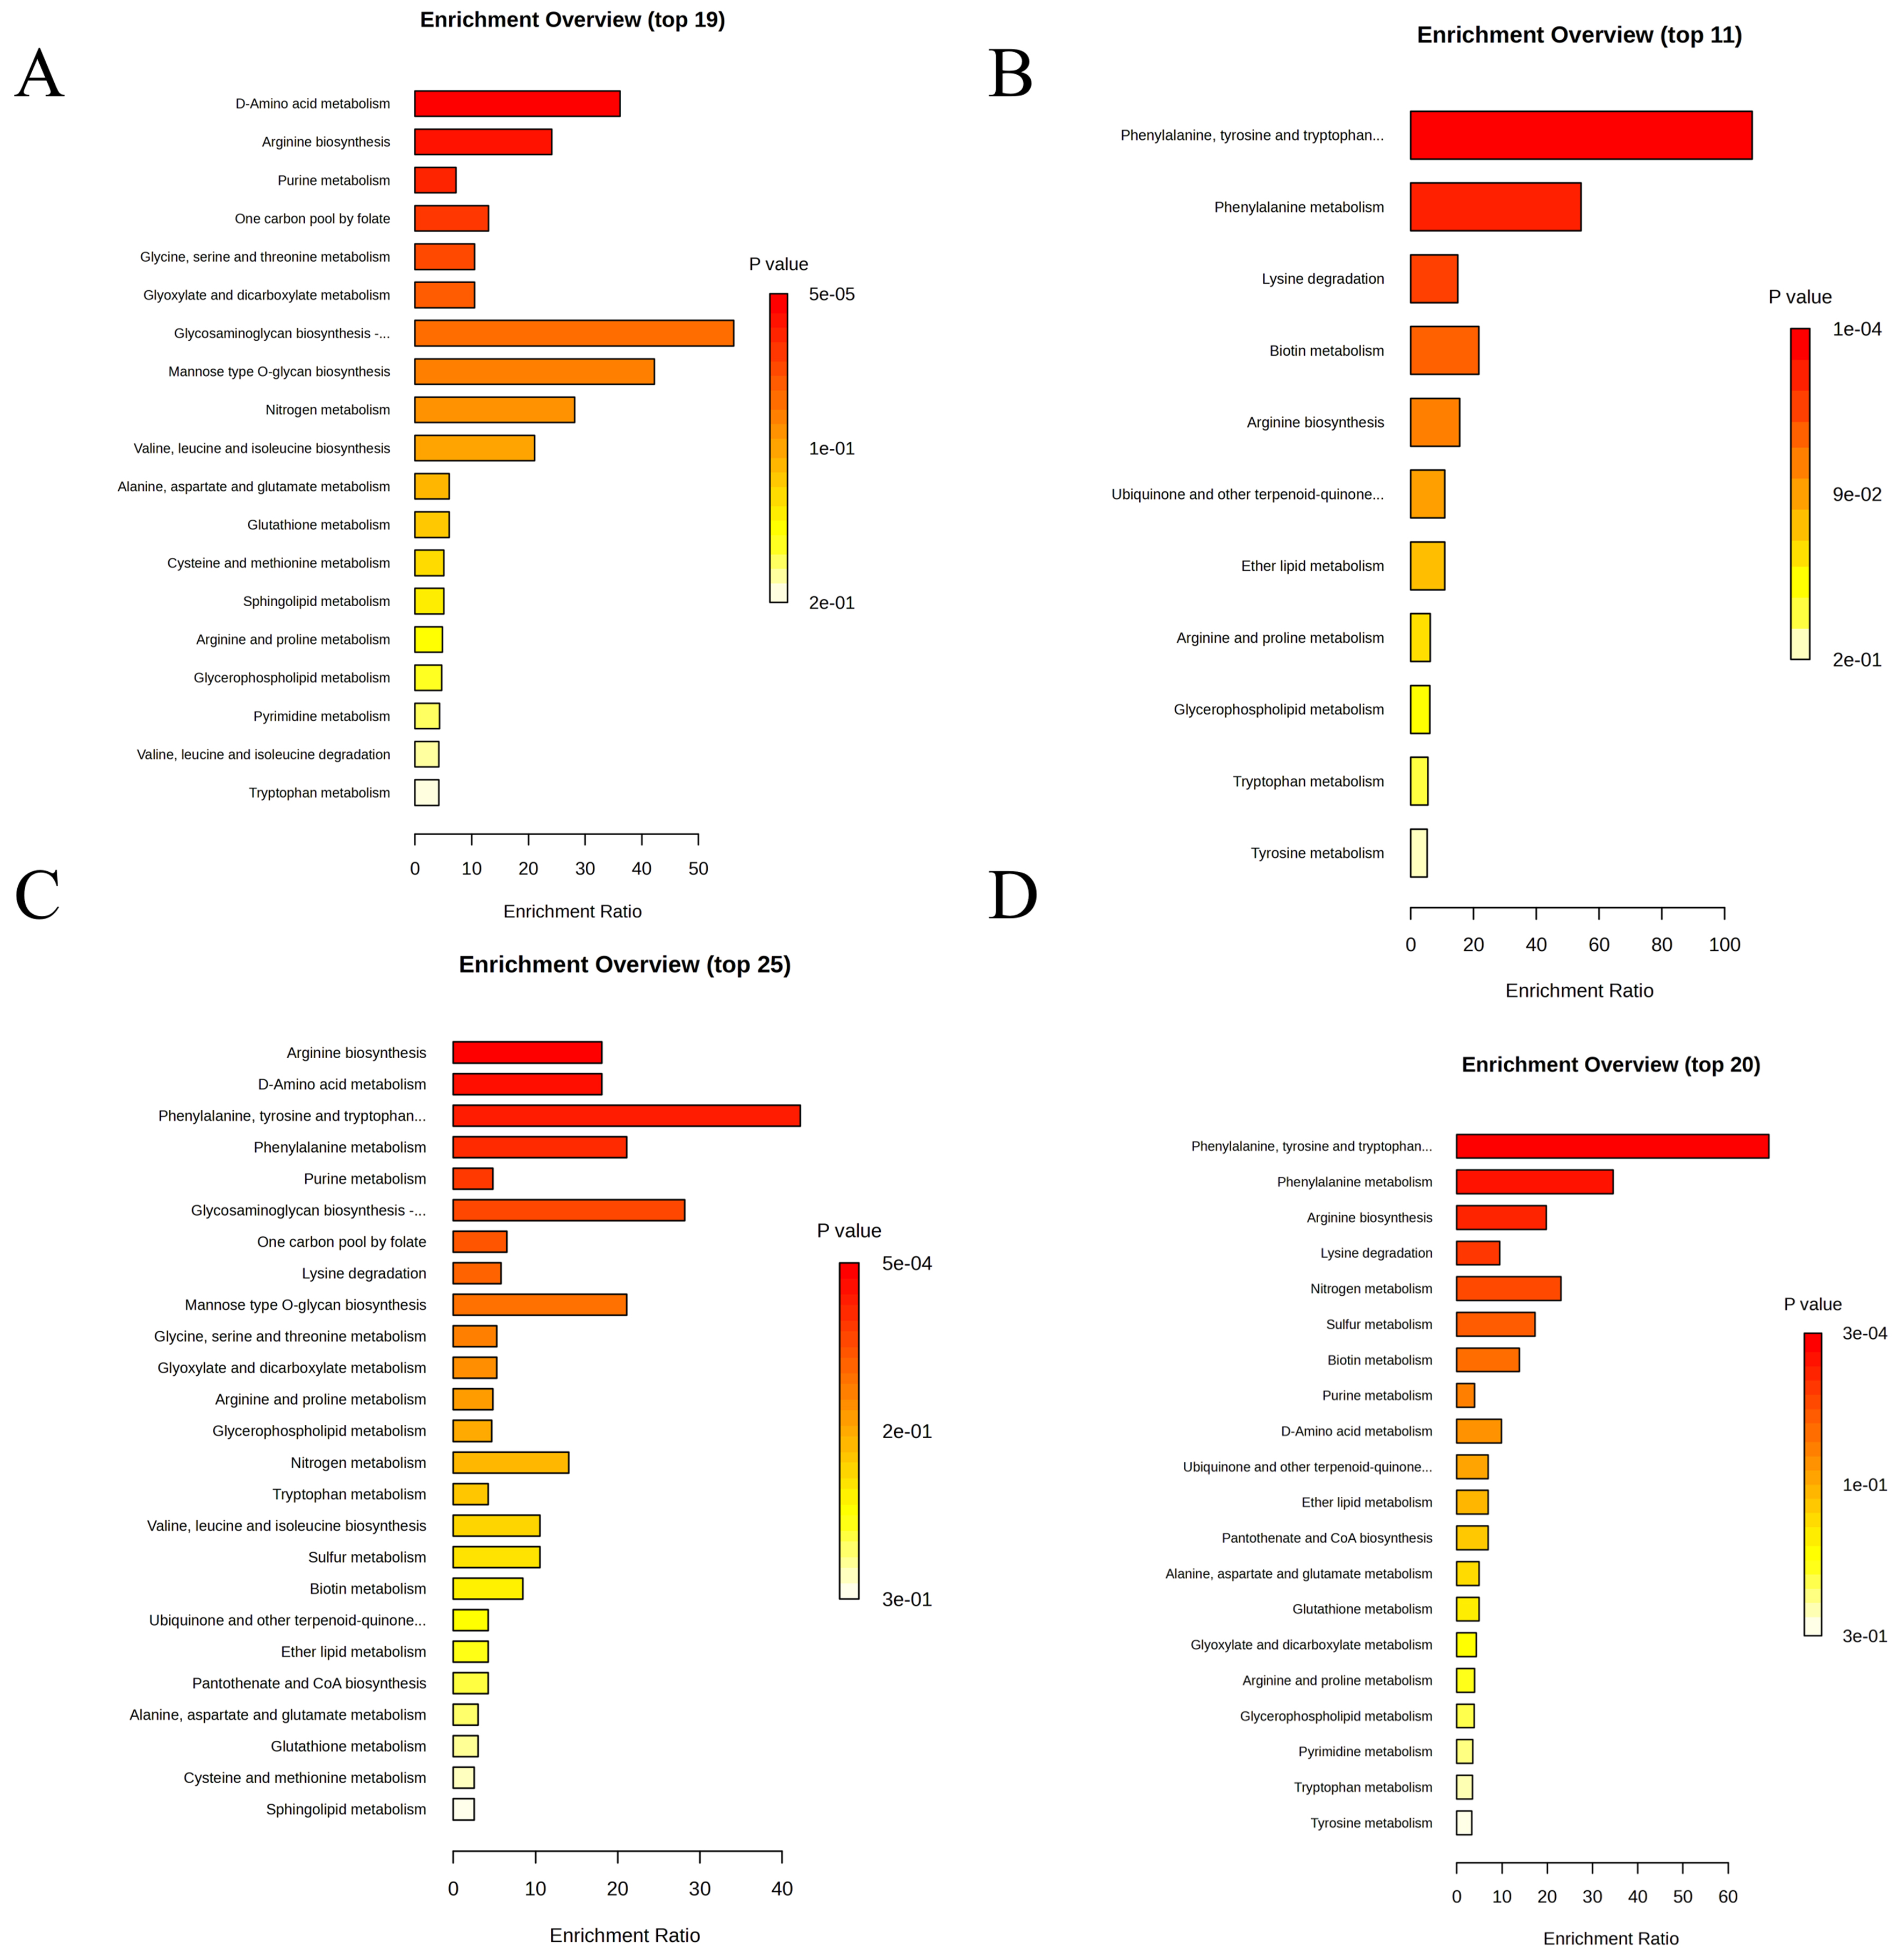
Figure 4. KEGG pathway enrichment analysis of DEGs in mature and precursor white adipocytes under high-glucose stimulation. (A) Significantly upregulated KEGG pathways in high-glucose-stimulated WAT (WAT-HG vs. WAT-C Up); (B) Significantly downregulated KEGG pathways in high-glucose-exposed WAT (WAT-HG vs. WAT-C Down); (C) Significantly upregulated KEGG pathways in high-glucose-stimulated pre-WAT (pre-WAT-HG vs. pre-WAT-C Up); (D) Significantly downregulated KEGG pathways in high-glucose-exposed pre-WAT (pre-WAT-HG vs. pre-WAT-C Down). C: Control; DEGs: differentially expressed genes; HG: high glucose; KEGG: Kyoto Encyclopedia of Genes and Genomes; pre-WAT: precursor white visceral adipocytes; WAT: mature white visceral adipocytes.
Hypoxanthine metabolic dysregulation links impaired purine salvage to type 2 diabetes pathogenesis
Integrated analysis of hypoxanthine metabolism and its clinical relevance revealed critical insights into purine pathway dysregulation in metabolic disease. The hypoxanthine metabolic pathway [Figure 5A] highlights its role as a purine degradation intermediate, primarily salvaged via HGPRT to regenerate IMP, a key node in nucleotide recycling. Notably, impaired HGPRT activity or oxidative stress may disrupt this salvage mechanism, leading to hypoxanthine accumulation-a phenomenon implicated in metabolic disorders. Clinically, serum hypoxanthine levels were significantly elevated in patients with T2DM compared to healthy controls (Figure 5B, P < 0.01). Quantitative analysis demonstrated a marked increase in circulating hypoxanthine [error bars: standard error of the mean (SEM), n = 15 per group], suggesting systemic dysregulation of purine metabolism in T2DM.
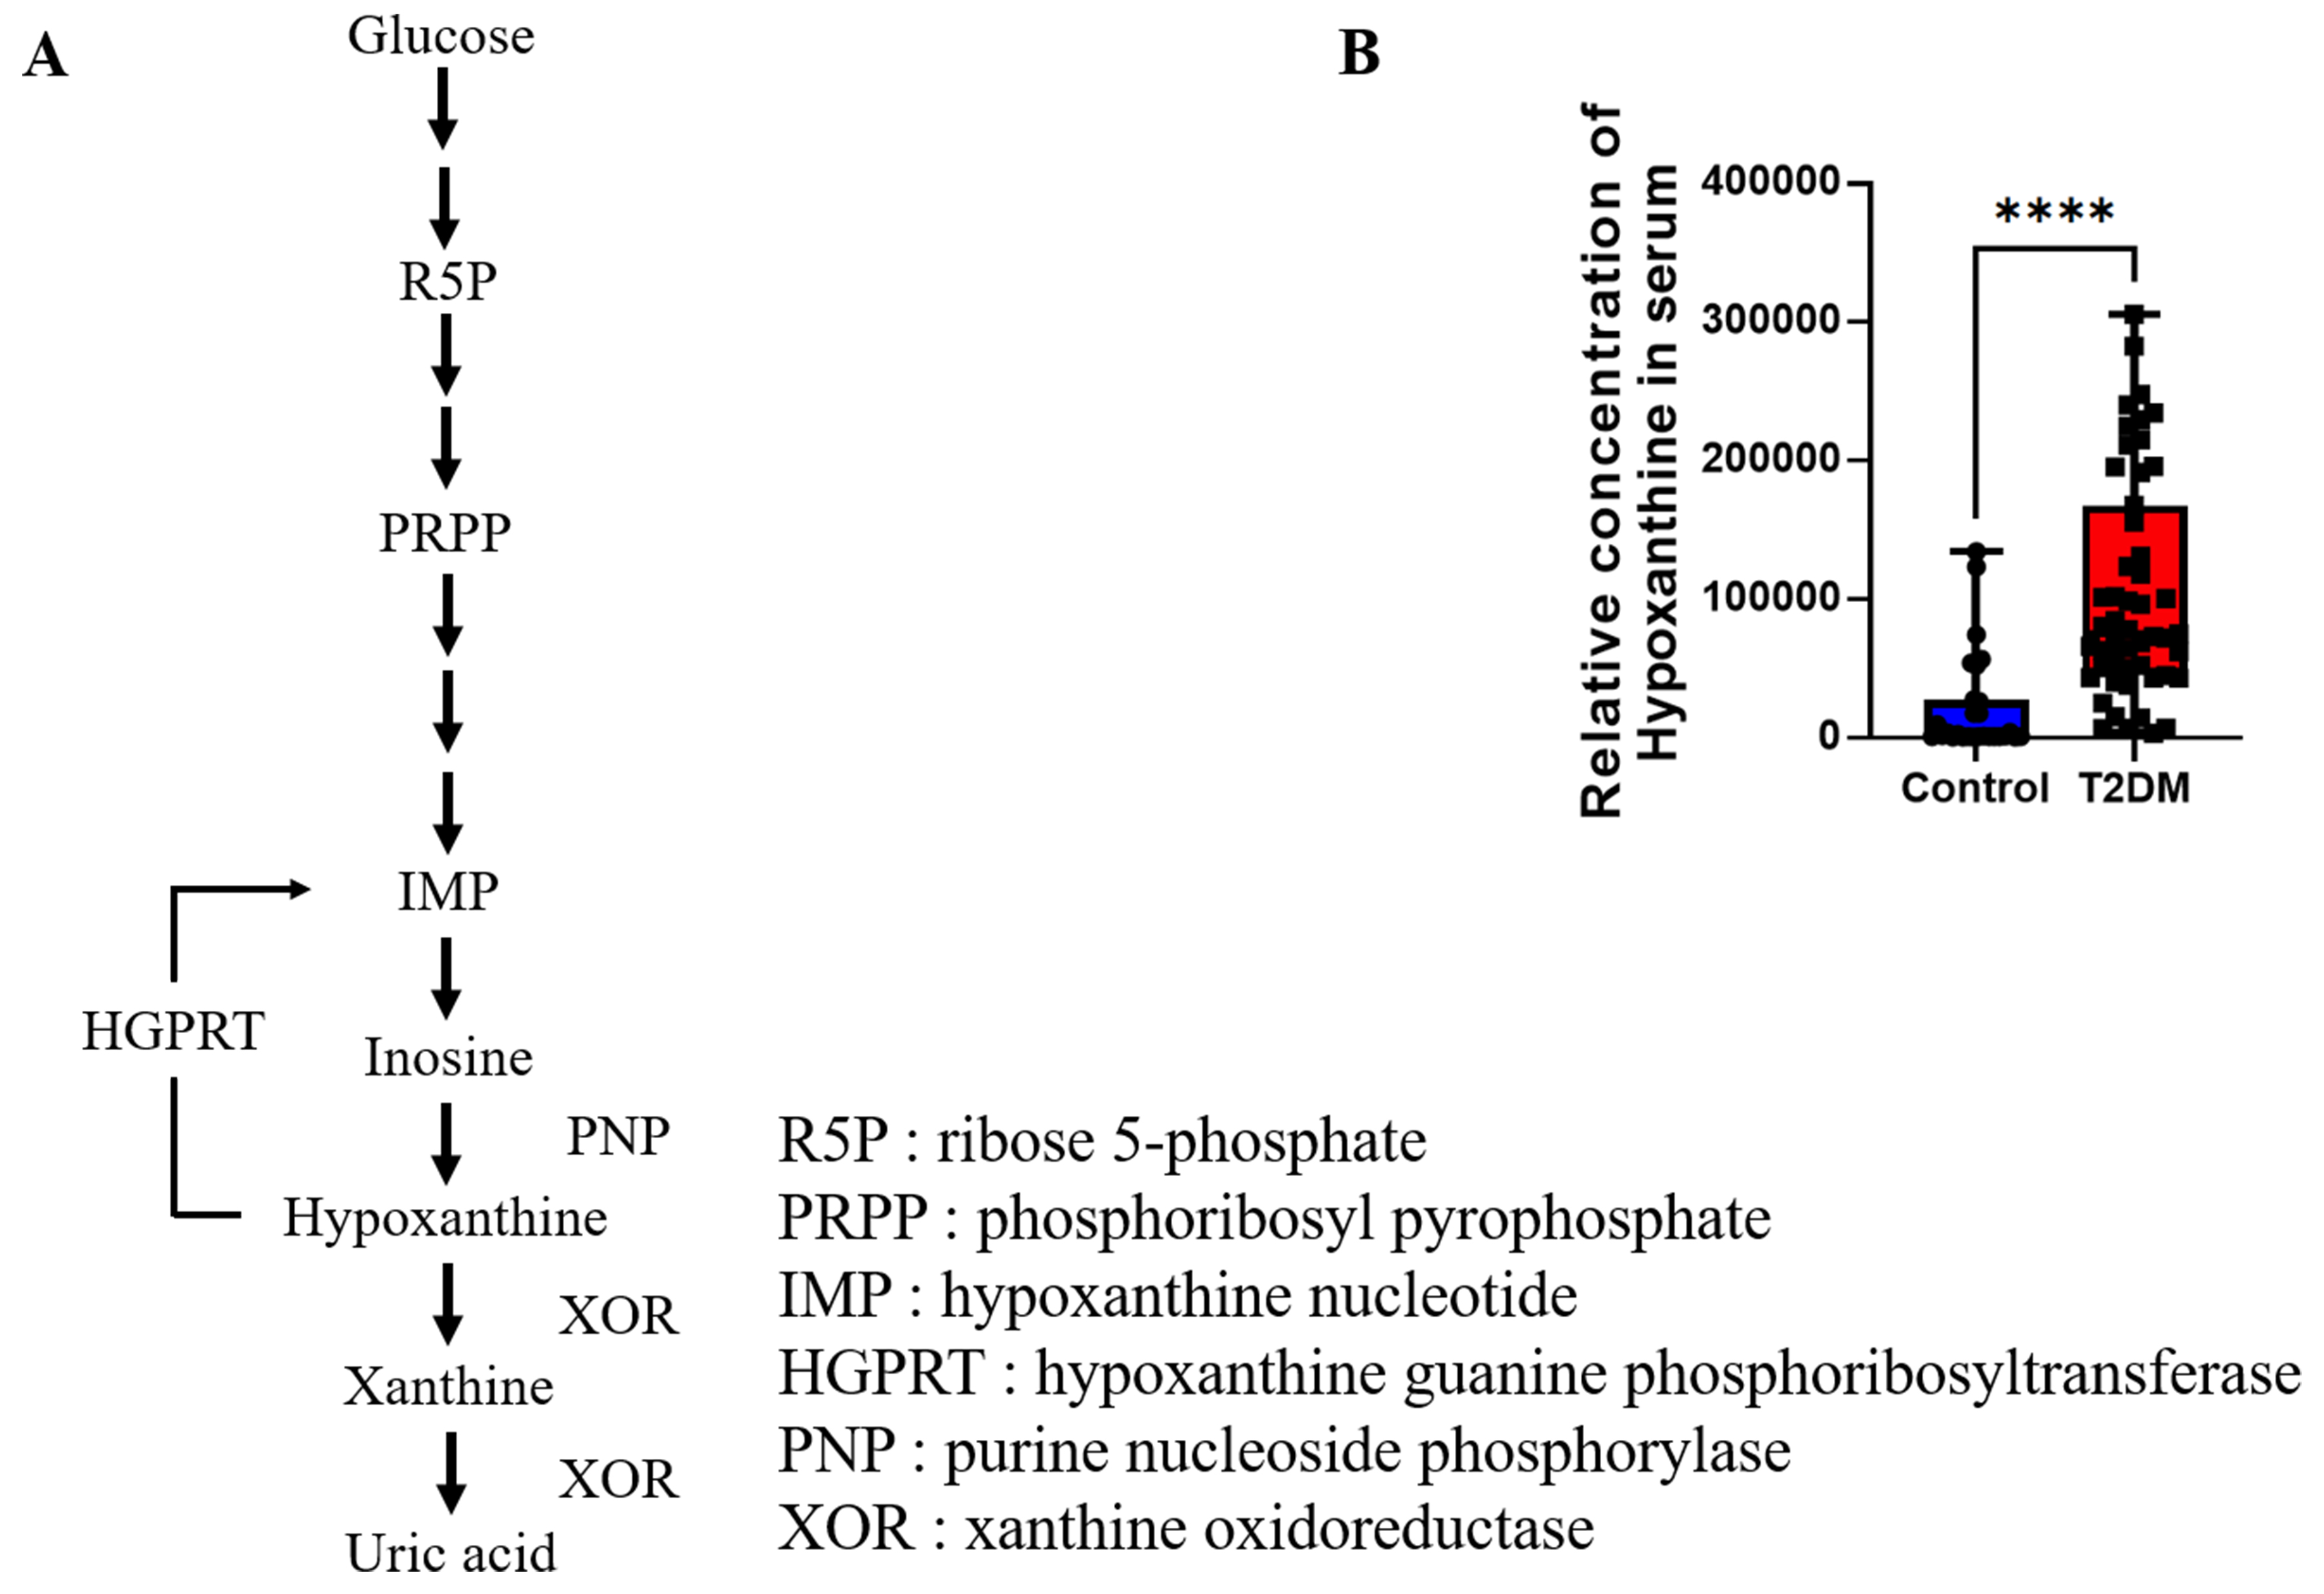
Figure 5. (A) Hypoxanthine metabolic pathway. The schematic illustrates the metabolic fate of hypoxanthine, a purine degradation product. Hypoxanthine is primarily salvaged by HGPRT to regenerate IMP, a critical step in the purine salvage pathway. Dysregulation of HGPRT activity or oxidative stress may lead to hypoxanthine accumulation, as observed in metabolic disorders; (B) Serum hypoxanthine levels in T2DM. The bar graph compares serum hypoxanthine concentrations between healthy controls and T2DM patients. Quantitative analysis reveals a statistically significant elevation (****P < 0.0001) of hypoxanthine in T2DM subjects, potentially reflecting impaired purine metabolism, increased xanthine oxidase activity, or systemic oxidative stress associated with diabetic pathophysiology. Error bars represent SEM (n = 15 per group). HGPRT: hypoxanthine-guanine phosphoribosyltransferase; IMP: inosine monophosphate; SEM: standard error of the mean; T2DM: type 2 diabetes mellitus; R5P: ribose 5-phosphate; PRPP: phosphoribosyl pyrophosphate; IMP: hypoxanthine nucleotide; HGPRT: hypoxanthine guanine phosphoribosyltransferase; PNP: purine nucleoside phosphorylase; XOR: xanthine oxidoreductase.
Hypoxanthine functional studies
In vitro experiments demonstrated hypoxanthine’s dual regulatory roles in adipocyte biology. As shown in Figure 6A, Hx significantly promoted adipogenic differentiation of white preadipocytes. A schematic diagram illustrating the treatment regimen of 100 μM Hx during adipogenic induction of white adipocyte precursors. In precursor white adipocytes, treatment with 100 μM hypoxanthine during adipogenic induction significantly promoted lipid accumulation, as shown by ORO staining [Figure 6B], with OD520 quantification confirming a significant increase in the Hx-treated group (1.65 ± 0.03) compared to control (1.48 ± 0.02) (P < 0.01). Additionally, Hx treatment significantly upregulated the messenger ribonucleic acid (mRNA) expression of key adipogenic regulators, including CEBPα, CCAAT/enhancer-binding protein-beta (C/EBPβ), perilipin-1 (PLIN1), and PPARγ [Figure 6C] (P < 0.05). These findings indicate that hypoxanthine effectively enhances adipogenic differentiation of precursor white adipocytes.
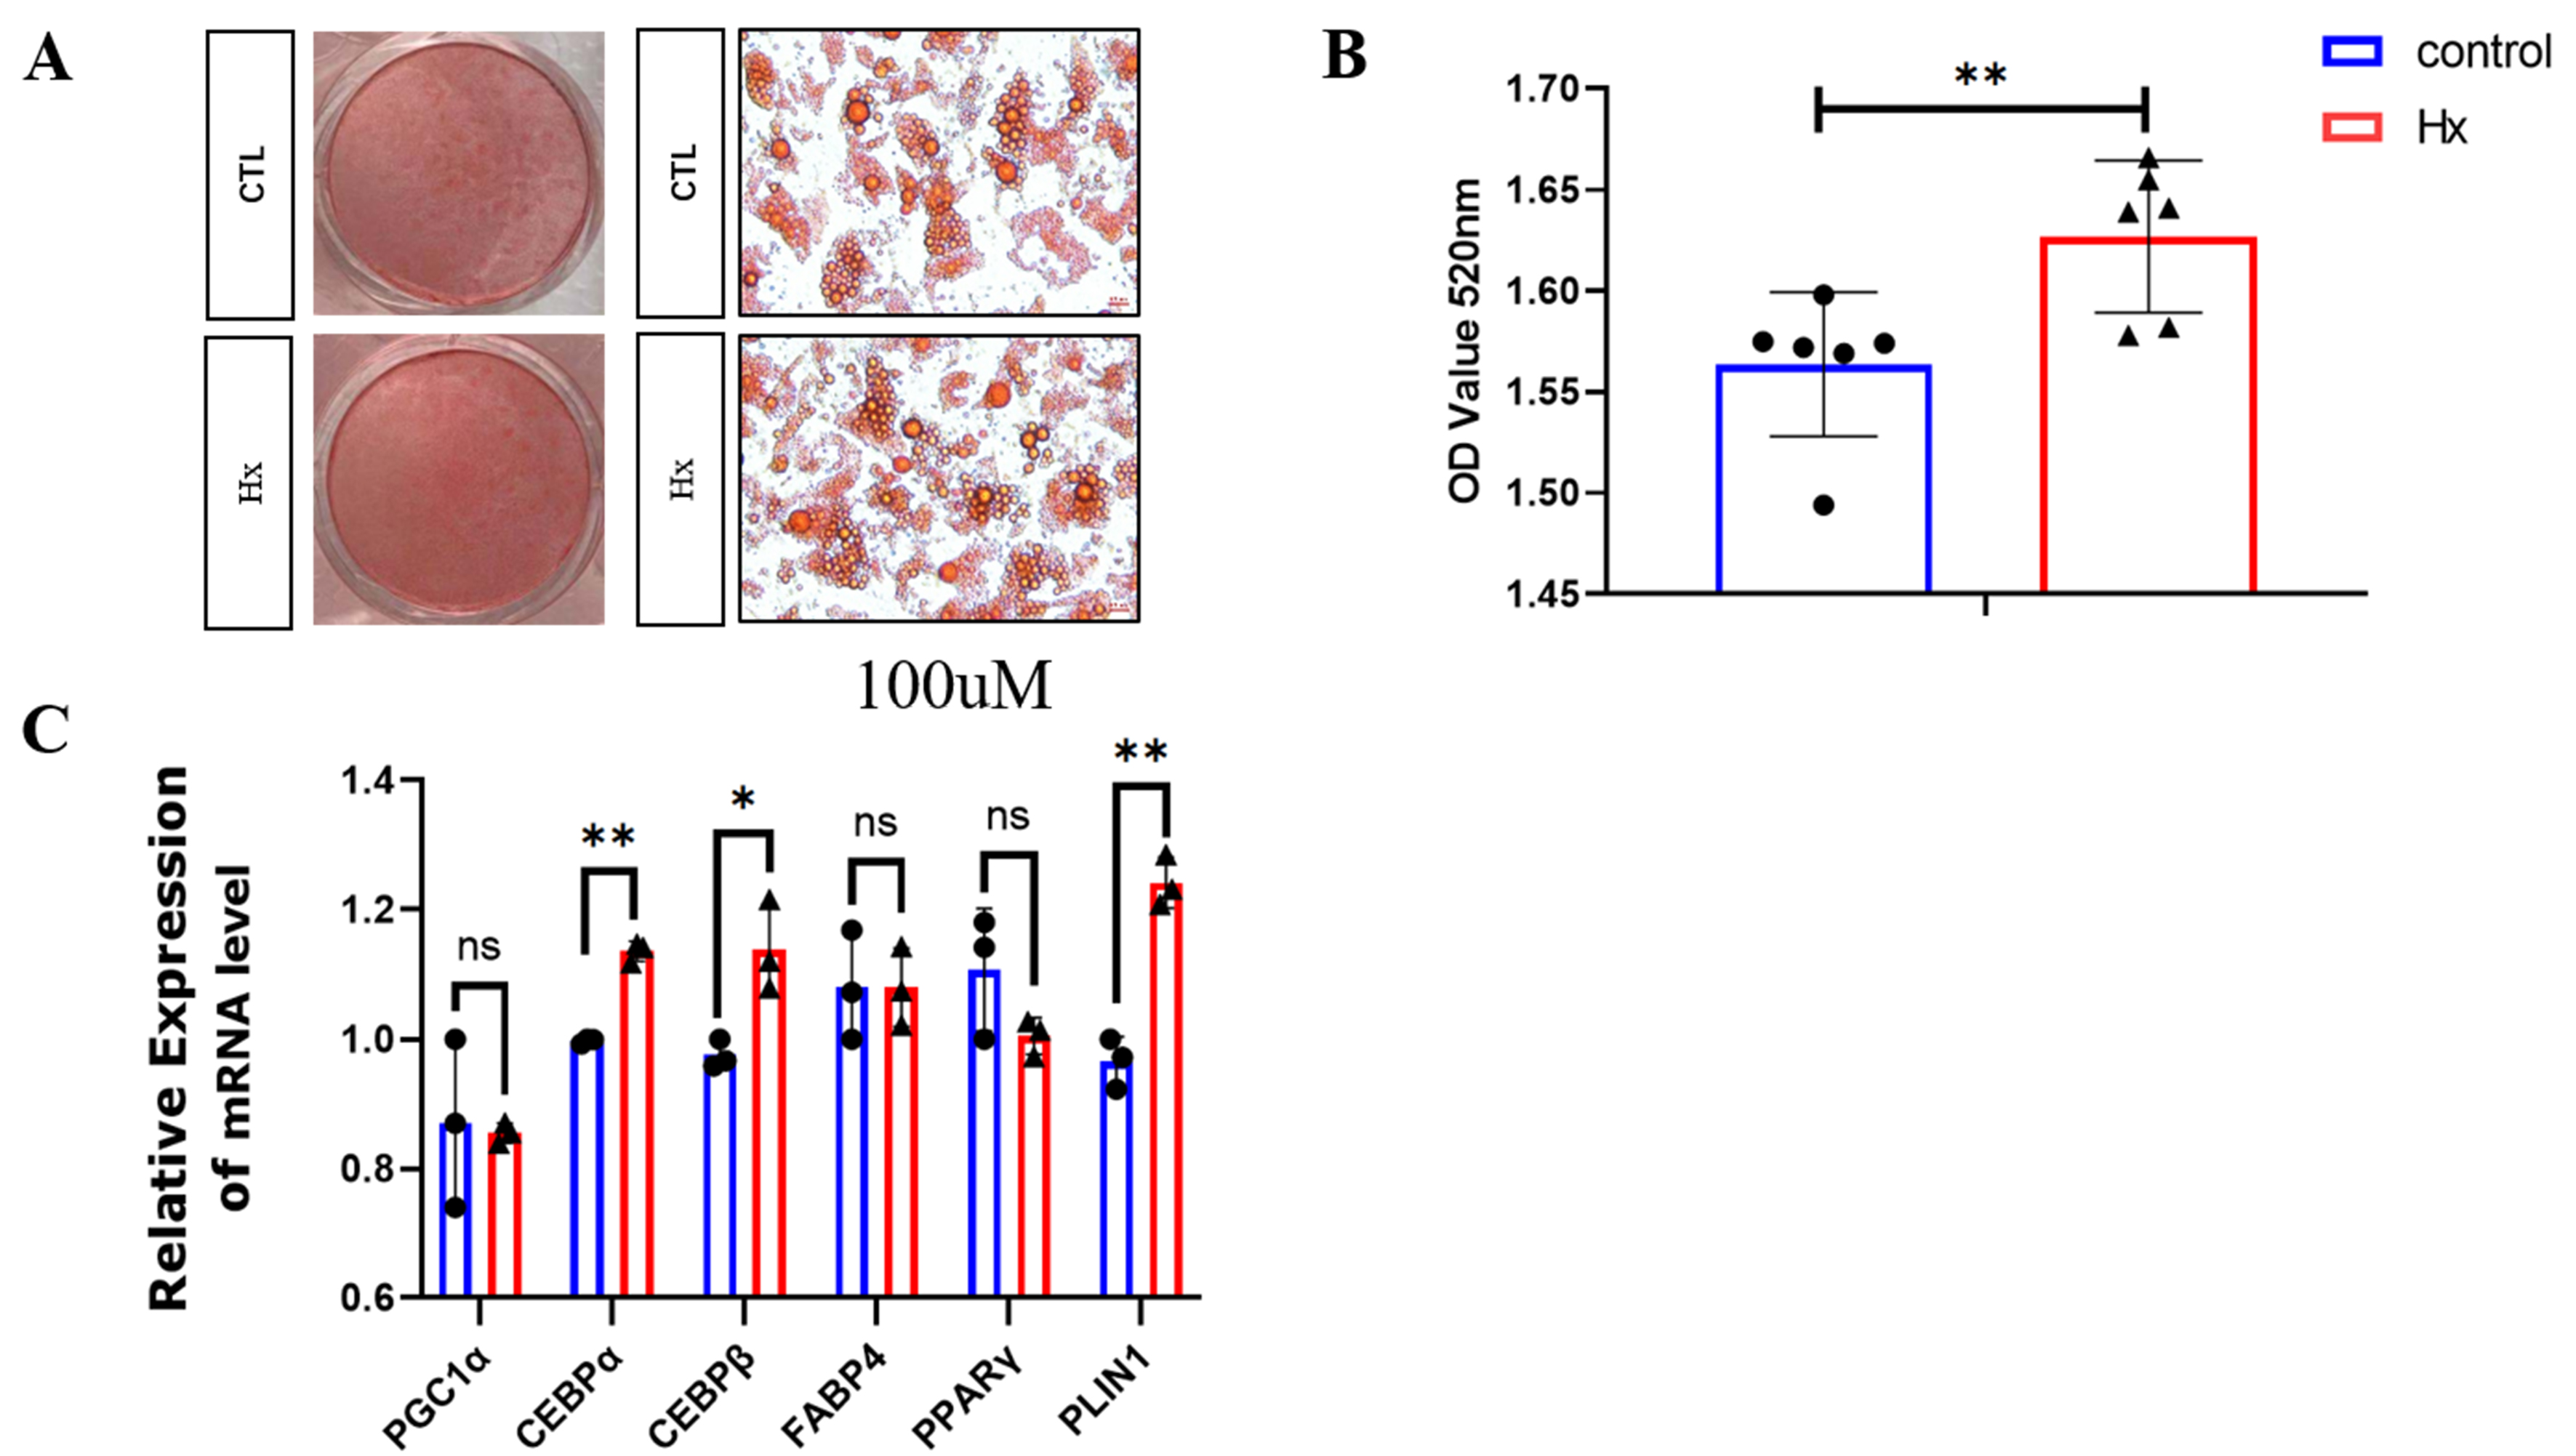
Figure 6. (A) Hypoxanthine (Hx) enhances adipogenic differentiation in precursor white adipocytes. Schematic representation of 100 μM Hx treatment during adipogenic induction in precursor white adipocytes; (B) Oil Red O staining quantification. OD520 values demonstrate significantly increased lipid accumulation in Hx-treated adipocytes (**P < 0.01 vs. control), with mean OD values of 1.65 ± 0.03 (Hx, n = 6) vs. 1.48 ± 0.02 (control, n = 6). Representative images show enhanced intracellular lipid droplet formation (red staining) under Hx stimulation; (C) Upregulation of adipogenic marker genes by Hx. Relative mRNA expression levels of key adipogenic regulators: CEBPα, CEBPβ, PLIN1, and PPARγ (*P < 0.05, **P < 0.01, n = 6). CEBP: CCAAT/enhancer-binding protein; Hx: hypoxanthine; OD: optical density; PLIN1: perilipin 1; PPARγ: peroxisome proliferator-activated receptor gamma.
In mature white visceral adipocytes, 100 μM hypoxanthine modulated key molecular programs. Western blot analysis revealed upregulation of adipogenic markers PPARγ and CEBPα, accompanied by downregulation of thermogenic effectors UCP1 and peroxisome proliferator-activated receptor gamma coactivator-1-alpha (PGC-1α) [Figure 7A], with densitometric quantification confirming these opposing effects [Figure 7B]. Functionally, Hx impaired mitochondrial energy dissipation, as demonstrated by real-time oxygen consumption rate profiling [Figure 7C]. Hx-treated adipocytes showed a 35% reduction in basal respiration (P < 0.01), with maximal respiration and adenosine triphosphate(ATP)-linked respiration decreased by 42% and 38%, respectively [Figure 7D] (P < 0.01). Collectively, these data indicate that Hx promotes lipid-storage phenotypes by activating adipogenic transcription factors while repressing mitochondrial thermogenesis in mature adipocytes.
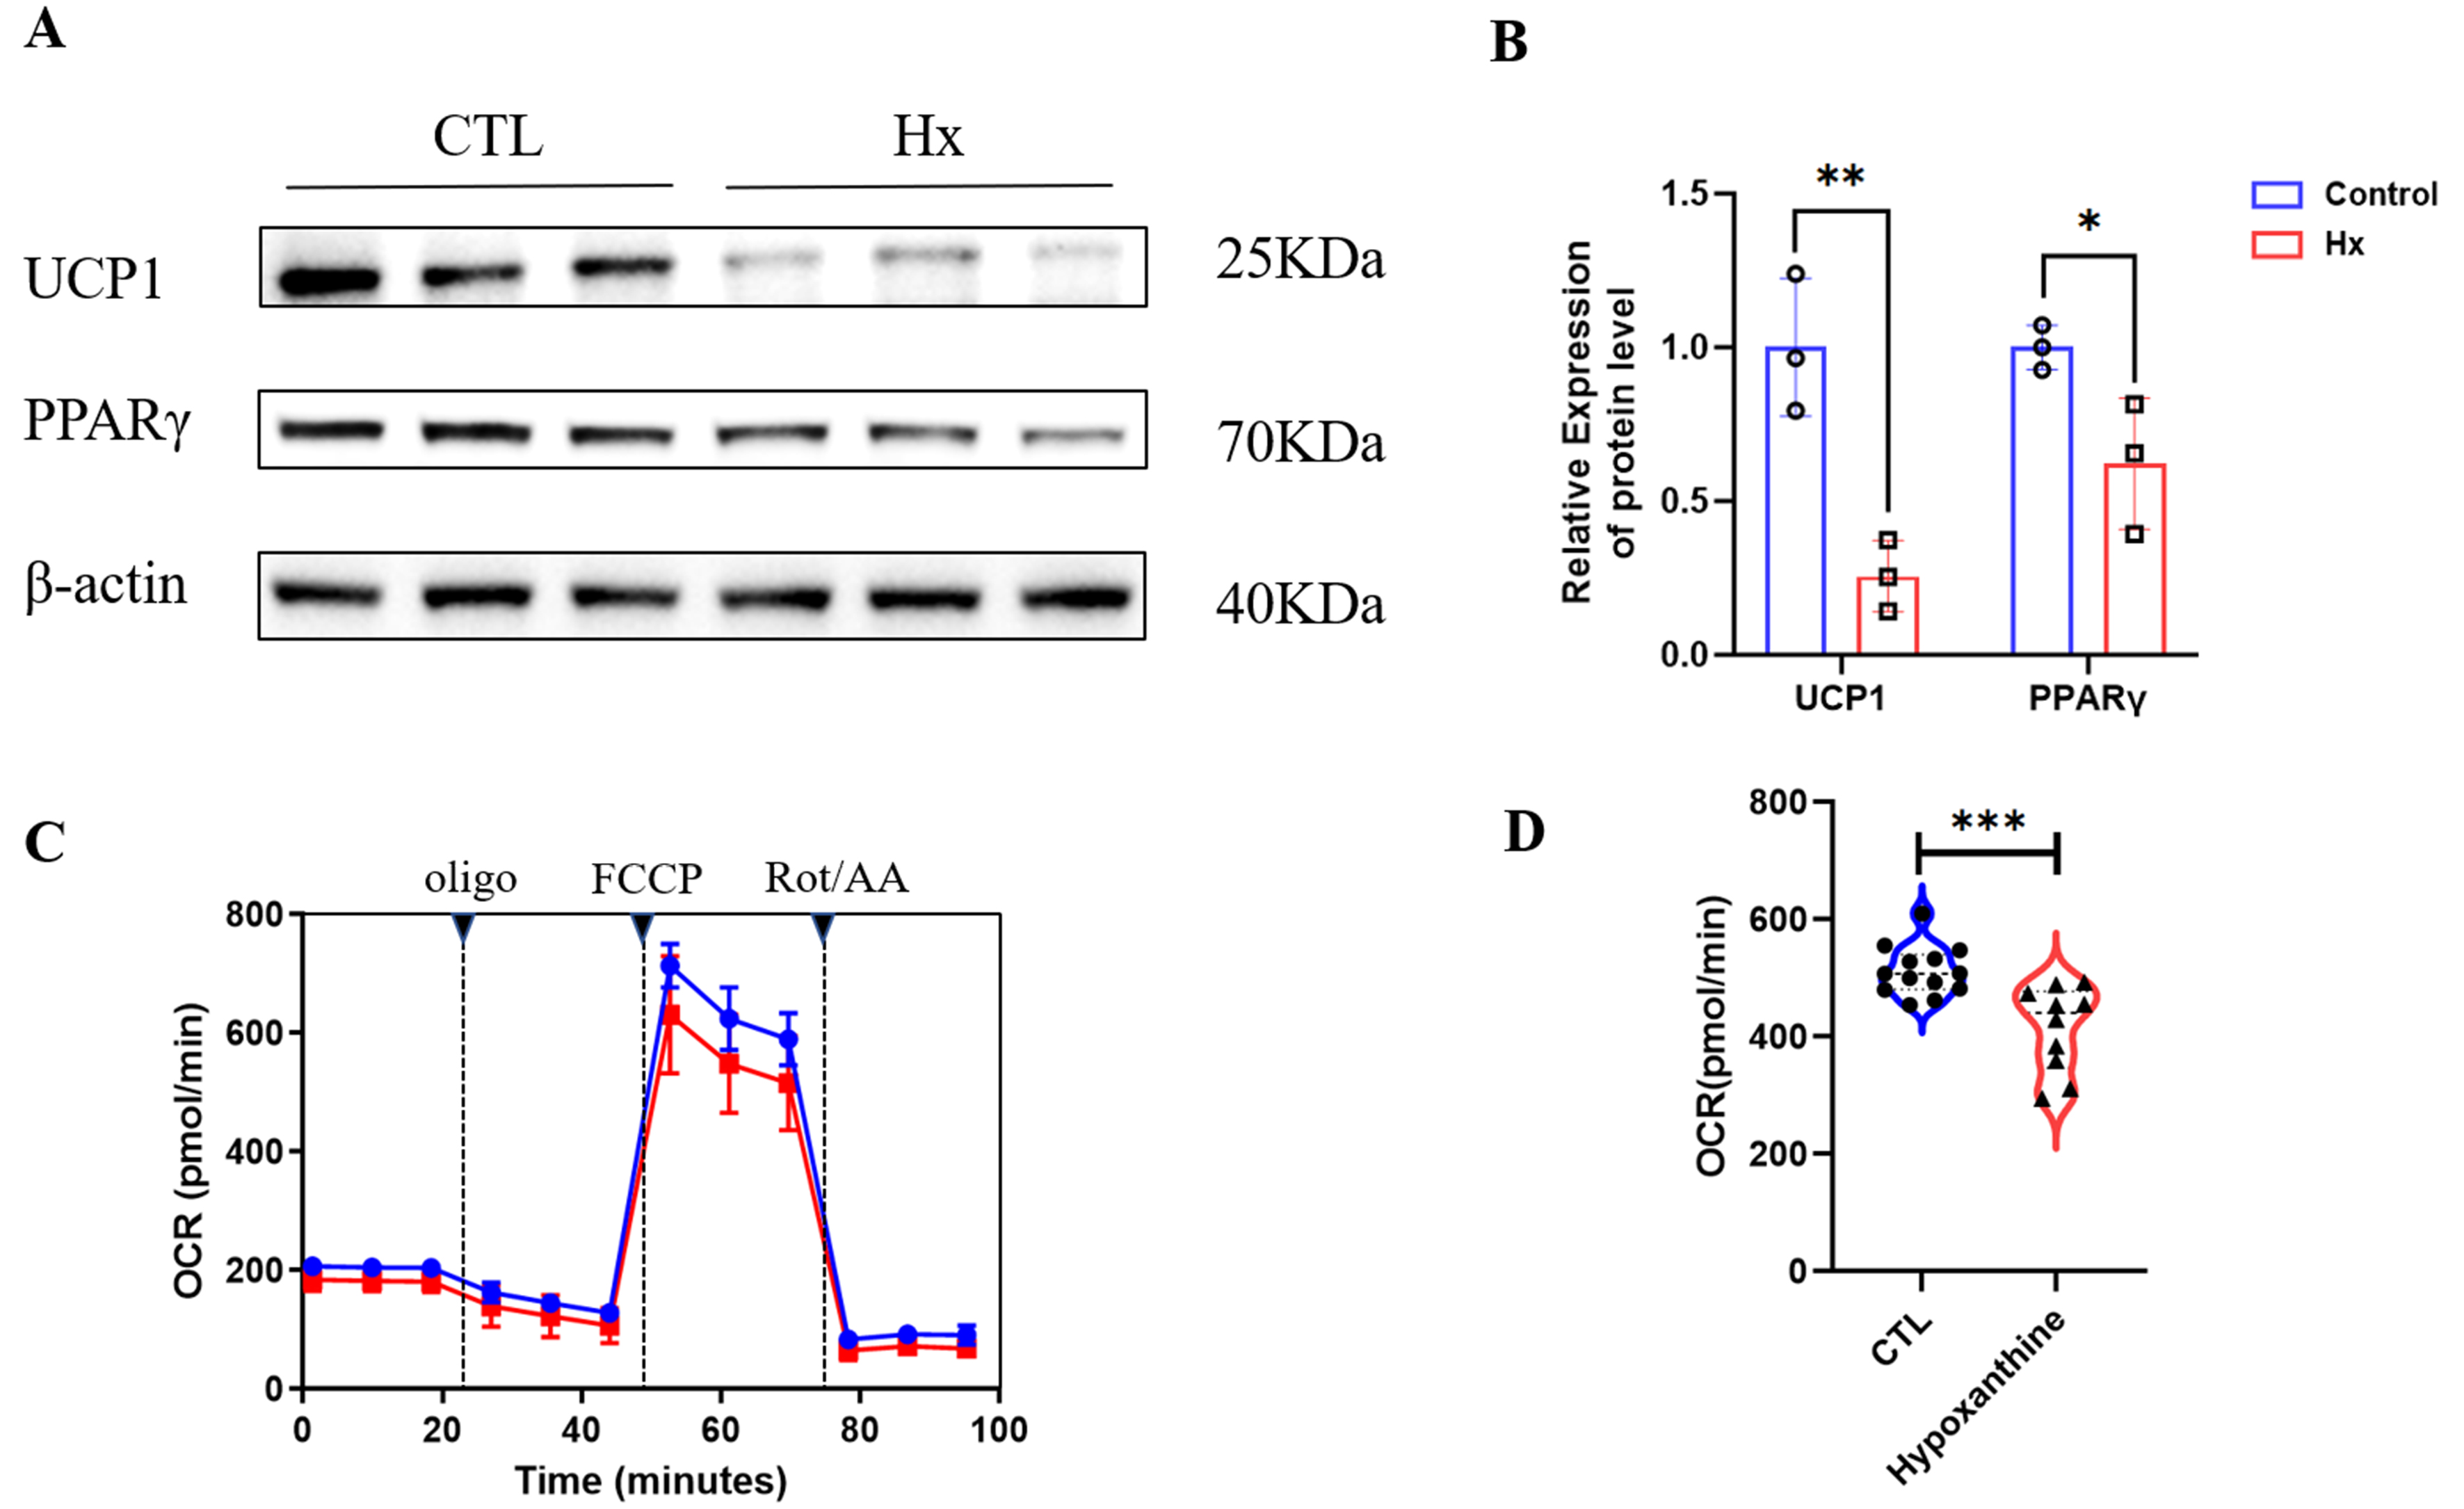
Figure 7. (A and B) Hypoxanthine (Hx) modulates adipogenic and thermogenic programs in mature white adipocytes. (A) Western blot analysis of adipogenic markers (PPARγ, CEBPα) and thermogenic markers (UCP1, PGC1α) in mature WAT treated with 100 μM Hx (n = 3); (B) Densitometric quantification of protein expression normalized to β-actin (Western blot experiments were performed with biological replicates, n = 3, *P < 0.05, **P < 0.01); (C and D) Hx suppresses mitochondrial thermogenesis in mature WAT. (C) Real-time OCR profiles demonstrating Hx-induced inhibition of mitochondrial respiration. Basal OCR decreased by 35% (*P < 0.01) in Hx-treated adipocytes; (D) Quantitative analysis of OCR parameters. Maximal respiration and ATP-linked respiration were reduced by 42% and 38%, respectively (*P < 0.01 vs. control). Error bars represent SEM (n = 8 replicates). ***P < 0.001. CEBPα: CCAAT/enhancer-binding protein alpha; Hx: hypoxanthine; OCR: oxygen consumption rate; PGC1α: peroxisome proliferator-activated receptor gamma coactivator 1-alpha; PPARγ: peroxisome proliferator-activated receptor gamma; SEM: standard error of the mean; UCP1: uncoupling protein 1; WAT: mature white visceral adipocytes.
Hypoxanthine amplifies lipid deposition under high-fat diet in zebrafish
Zebrafish larvae were subjected to a HFD with concomitant 200 µM Hx treatment from 4 to 6 dpf [Figure 8A]. Zebrafish embryos were treated with different concentrations of hypoxanthine (0, 50, 100, 250, and 500 μM) for three days. Representative images of zebrafish larvae following Hx exposure are shown in Figure 8B. Dose-escalation studies (0-500 µM Hx) revealed no significant mortality in embryos [Figure 8C], but Hx dose-dependently suppressed hatching rates at 72 hpf (P < 0.05 for 250/500 µM vs. control; n = 40-50 embryos/group, 3 replicates) [Figure 8D]. In HFD-fed larvae, Hx (200 µM) markedly amplified lipid deposition: Nile Red staining [Figure 8E] and ORO analysis [Figure 8F] demonstrated intensified neutral lipid fluorescence (> 2-fold vs. control) and stratified lipid accumulation (high-intensity group: 78% HFD + Hx vs. 32% HFD-only; n = 45/group). These findings indicate that Hx potentiates HFD-driven steatosis while exhibiting embryotoxicity only at supraphysiological concentrations (> 250 µM).
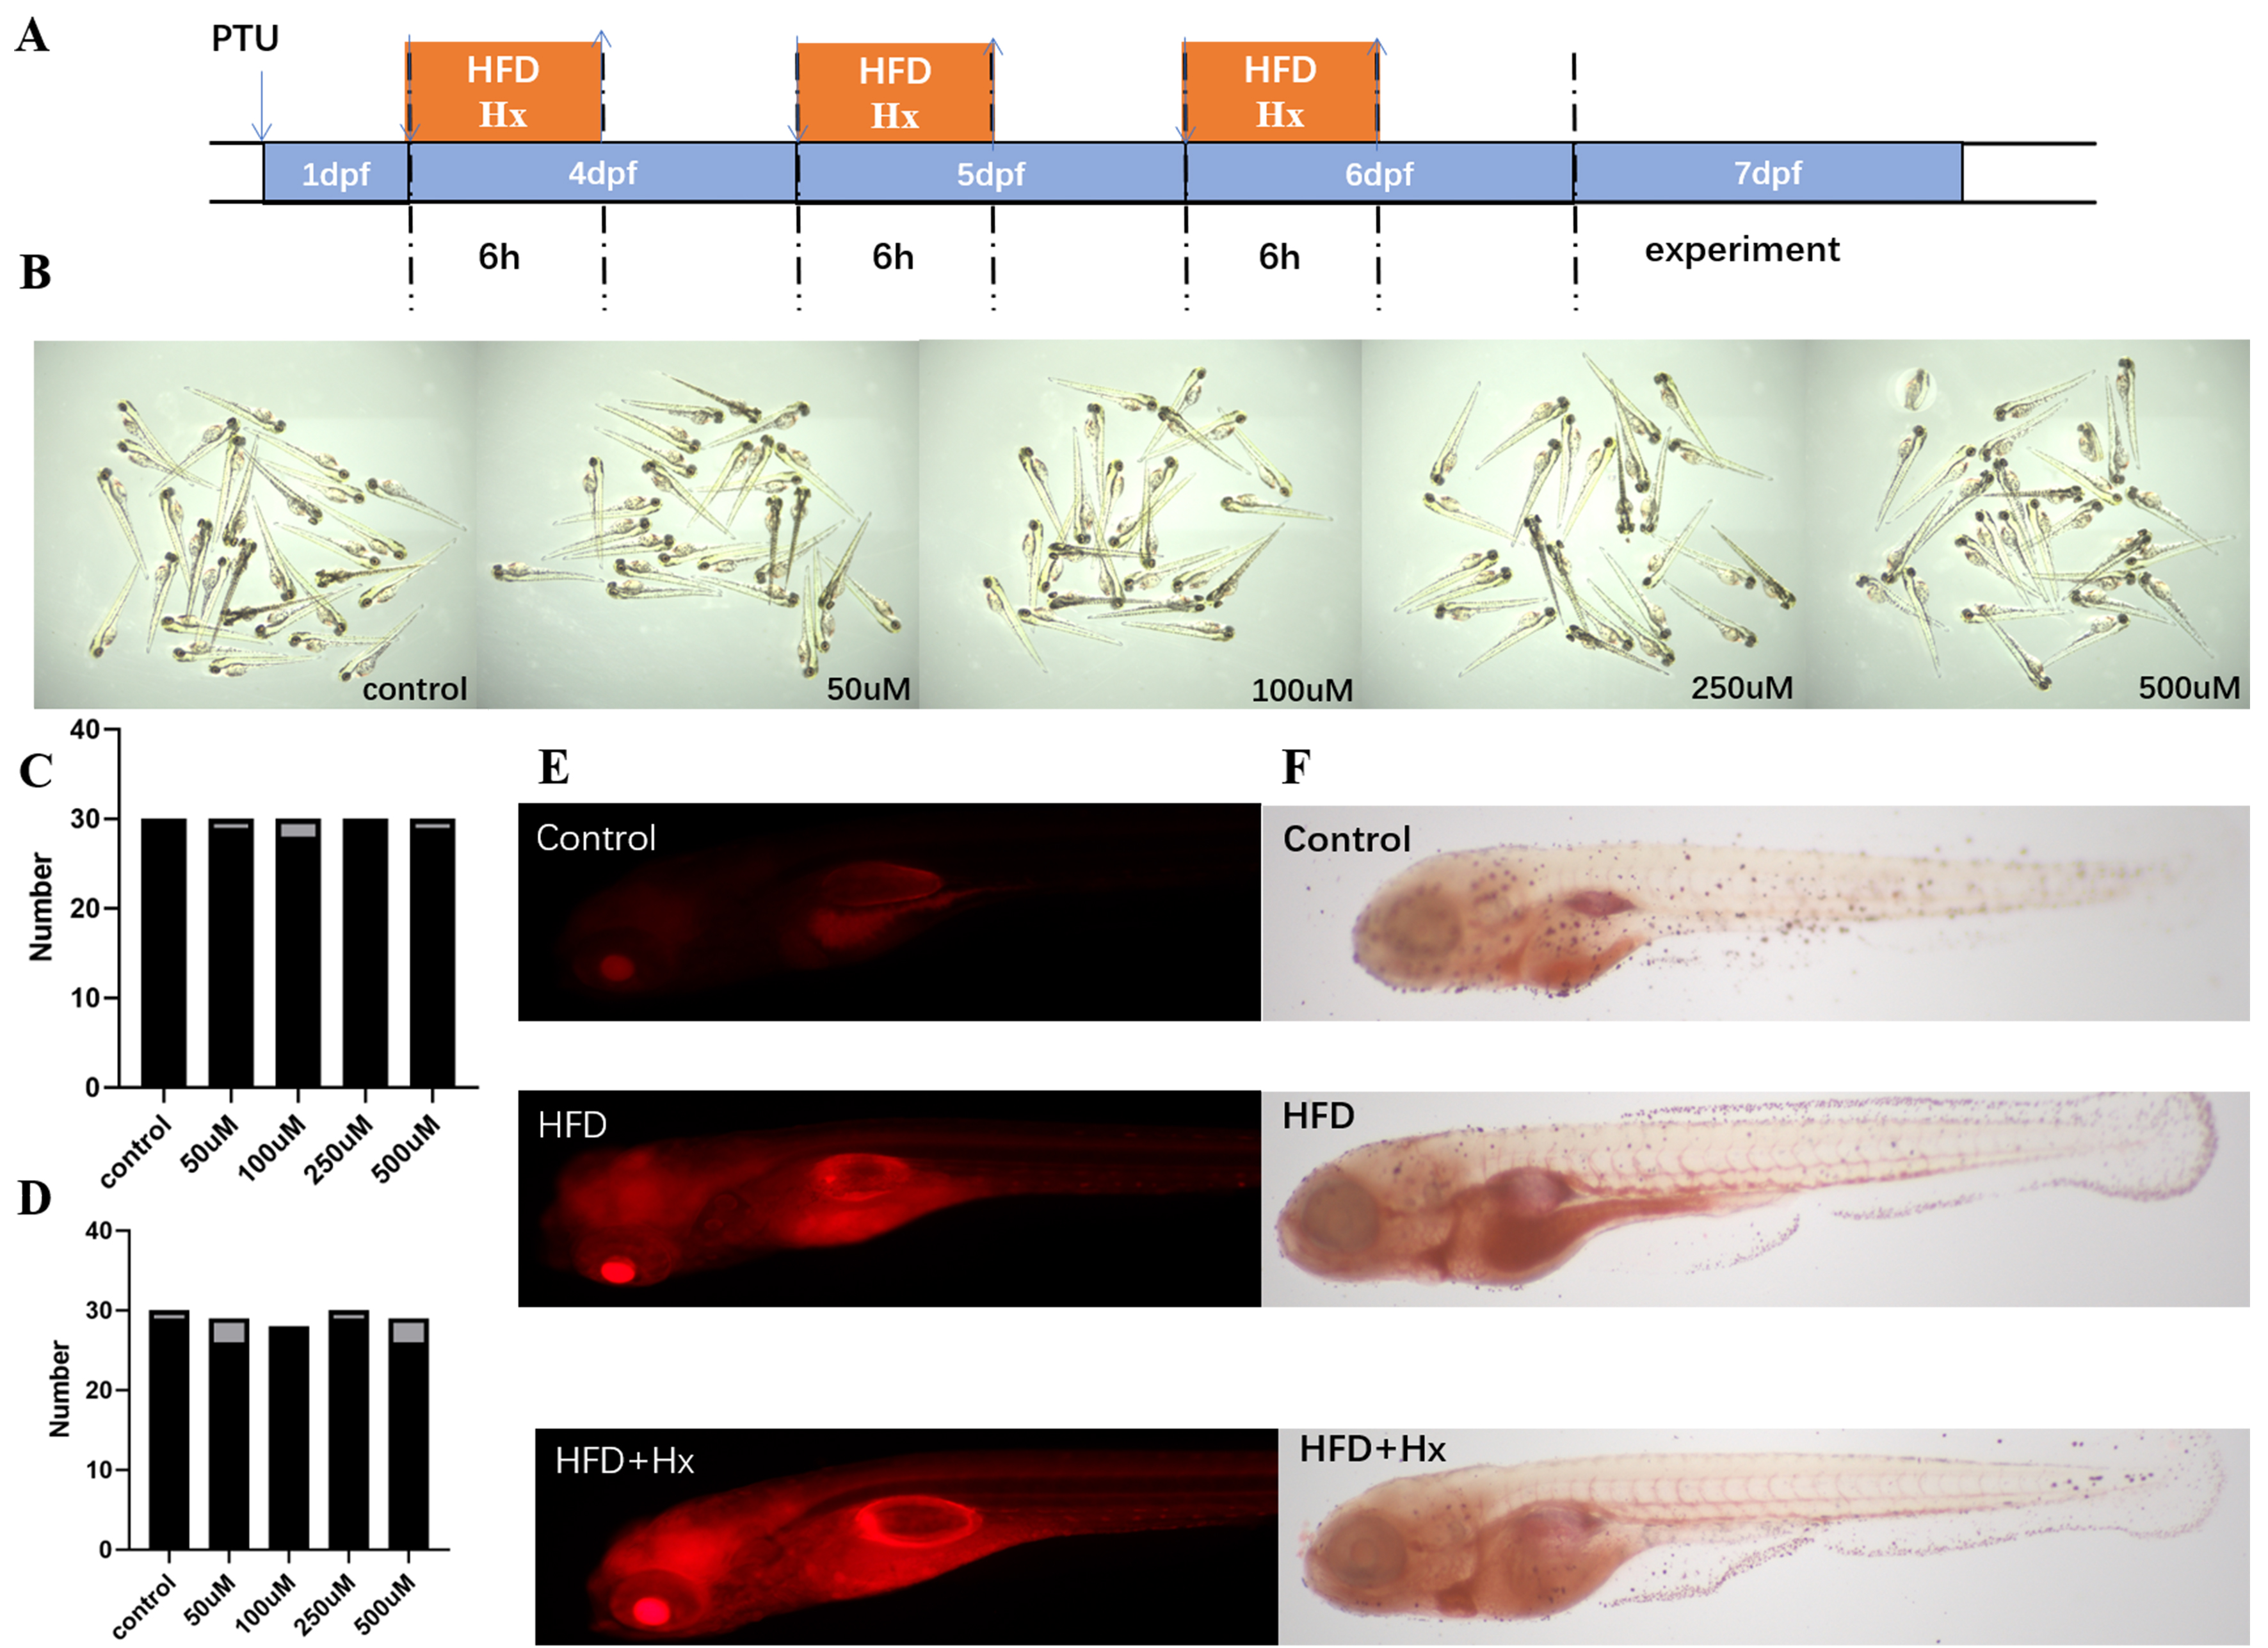
Figure 8. (A) Schematic representation of the protocol used for examination of the effect of Hx treatment against HFD effects. Control: zebrafish larvae were fed with a standard diet or HFD for 6 h each day from 4 to 6 dpf. Hx treatment: zebrafish larvae were treated with Hx during each control or HFD consumption period; (B) Zebrafish embryos were treated in each well with different concentrations of Hx (0, 50, 100, 250, and 500 μM Hx) for 3 days; (C) Dose-dependent toxicity of Hx in zebrafish embryos. The survival percentage of zebrafish embryos and larvae after embryonic exposure to various concentrations of Hx was not statistically significant; (D) Dose-dependent suppression of zebrafish embryo hatching by Hx. Bar graph quantifies hatched embryos at 72 hpf following exposure to increasing Hx concentrations (0, 50, 100, 250, and 500 μM). Values represent mean number of hatched embryos per experimental group (n = 40-50 embryos/concentration from 3 independent replicates); (E) Nile Red staining in 7 dpf zebrafish larvae. Brightfield images (4×) and representative fluorescent micrographs of head/yolk regions captured by immunofluorescence microscopy; (F) Brightfield images (4×) of 7 dpf larvae stained with Oil Red O (representative of n = 45/group). Quantification of lipid accumulation intensity (low/medium/high) in response to control vs. HFD with concurrent 200 μM Hx treatment. dpf: Days post fertilization; HFD: high-fat diet; hpf: hours post fertilization; Hx: hypoxanthine.
Hypoxanthine orchestrates transcriptomic reprogramming in white adipocytes to promote lipid anabolism and suppress mitochondrial energy dissipation
Transcriptomic analysis revealed that Hx induces pronounced, stage-dependent transcriptional reprogramming in visceral adipocytes. To further elucidate the potential molecular mechanisms underlying the functional changes induced by hypoxanthine in mature white adipocytes, we performed KEGG pathway enrichment analysis on DEGs between hypoxanthine-treated and control groups. The results revealed that DEGs were significantly enriched in multiple metabolism-related pathways. Supplementary Table 1 lists the top ten most significantly enriched pathways. Among these, the most significantly enriched pathways included Tyrosine metabolism, Terpenoid backbone biosynthesis, extracellular matrix (ECM)-receptor interaction, and Glycolysis/Gluconeogenesis. In addition, Glycolipid metabolism and the PPAR signaling pathway were also significantly enriched, suggesting that hypoxanthine may participate in adipocyte functional remodeling by regulating pathways involved in lipid metabolism and energy metabolism. These enrichment results provide important insights into the molecular mechanisms by which hypoxanthine acts in adipocytes.
DISCUSSION
The present study provides a comprehensive analysis of the effects of high glucose on human visceral white adipocytes at different stages of differentiation. Our findings demonstrate that high glucose exerts stage-specific effects, impairing preadipocyte differentiation while enhancing lipid accumulation in mature adipocytes. These divergent effects may be attributed to the differential regulation of key adipogenic transcription factors, such as PPARγ and CEBPα, under HG conditions.
The comprehensive metabolomic profiling reveals three tiers of metabolic reprogramming during adipocyte maturation and HG exposure. In WAT-C vs. Pre-WAT-C [Table 1], mature adipocytes exhibited downregulation of endocrine disruptors. This suggests maturation suppresses xenobiotic metabolism while enhancing amino acid flux for lipid synthesis or signaling. WAT-HG vs. Pre-WAT-HG [Table 2] showed pronounced downregulation of carbohydrate derivatives (D-iditol) but upregulated branched-chain amino acids (leucine), implying that high glucose disrupts carbohydrate homeostasis in mature adipocytes while promoting proteolysis for energy salvage. Conversely, WAT-HG vs. WAT-C [Table 3] highlighted the dramatic accumulation of D-iditol and hypoxanthine, indicating glucose overload may drive polyol pathway activation and purine degradation, potentially linked to oxidative stress. Notably, Pre-WAT-HG vs. Pre-WAT-C [Table 4] mirrored D-iditol upregulationand mannitol depletion, suggesting osmotic stress in preadipocytes under high glucose. Cross-group trends - e.g., consistent leucine elevation [Tables 1-3] and 3,4-dihydroxyphenylpropionic acid suppression [Tables 1-3] - highlight conserved metabolic adaptations to glucose, possibly mediating insulin resistance via mechanistic target of rapamycin (mTOR) activation or antioxidant depletion. These shifts collectively underscore glucose-driven dysregulation of redox balance, energy metabolism, and adipokine signaling, which may exacerbate adipocyte dysfunction in hyperglycemic environments.
KEGG pathway analysis [Figure 4] further confirmed that high glucose triggers divergent metabolic programs in mature vs. precursor white adipocytes. The activation of amino acid and nucleotide metabolism in mature adipocytes [Figure 4A] suggests an adaptive anabolic response to hyperglycemic stress, while the suppression of lipid metabolism pathways [Figure 4B] may contribute to impaired adipocyte function. Notably, the extreme enrichment of aromatic amino acid biosynthesis in precursor cells [Figure 4C] highlights a unique metabolic vulnerability in undifferentiated adipocytes, which may underpin their distinct response to high glucose compared to mature cells.
The metabolomic analysis across different experimental groups highlights significant metabolic alterations driven by HG conditions and adipocyte maturation. Mature adipocytes (WAT-C vs. Pre-WAT-C) demonstrated downregulation of xenobiotic metabolism and elevated amino acids such as leucine, suggesting enhanced anabolic pathways for lipid synthesis. HG-treated mature adipocytes (WAT-HG vs. WAT-C) exhibited activation of the polyol pathway (e.g., D-iditol accumulation) and purine degradation (hypoxanthine), indicative of oxidative stress. Preadipocytes under high glucose (Pre-WAT-HG vs. Pre-WAT-C) showed osmotic stress markers, including mannitol depletion. Persistent leucine upregulation across groups and reduced antioxidant metabolites imply glucose-induced mTOR activation and redox imbalance, potentially exacerbating insulin resistance. These findings underscore glucose-driven metabolic dysregulation in adipocytes, characterized by perturbed energy homeostasis, oxidative damage, and adaptive stress responses.
In addition to the above findings, we have identified key metabolites from the pool of differential metabolites. Our study identifies hypoxanthine as a critical metabolite linking high glucose to adipocyte dysfunction in mature visceral white adipocytes. The accumulation of hypoxanthine under HG conditions promotes adipogenesis and lipid storage while suppressing thermogenesis, highlighting its dual role in modulating adipocyte function. Emerging evidence implicates purine metabolites, such as hypoxanthine, in adipose dysfunction. Hypoxanthine, a pivotal purine metabolite, exhibits multifaceted roles across physiological and pathological contexts. In diabetic states, elevated hypoxanthine levels demonstrate potential associations with insulin resistance and metabolic syndrome. Mechanistic studies reveal that hypoxanthine ameliorates diet-induced insulin resistance through coordinated modulation of hepatic lipid metabolism and gluconeogenesis, a process mediated via the adenosine 5’-monophosphate-activated protein kinase (AMPK)/mTOR/peroxisome proliferator-activated receptor alpha (PPARα) signaling axis[22]. Notably, hypoxanthine has been identified as a metabolic signature inducing endothelial cell proptosis during ischemic stroke, suggesting its pathophysiological involvement in cerebral injury mechanisms[23]. Obesity-associated metabolic perturbations significantly alter hypoxanthine homeostasis. Experimental evidence indicates that HFD regimens promote hepatic hypoxanthine accumulation, potentially contributing to non-alcoholic fatty liver disease (NAFLD) progression through oxidative stress and inflammatory cascades[24]. Furthermore, the interplay between hypoxanthine metabolism and uric acid dynamics in obesity may indirectly influence hepatic pathophysiology.
The pleiotropic bioactivities of hypoxanthine manifest in cell-type-specific responses. Preclinical studies demonstrate its rapid antidepressant effects and its suppression of peripheral and hippocampal inflammation[25]. In adipocytes, hypoxanthine appears to modulate lipid metabolic pathways, though the precise mechanistic underpinnings remain to be fully elucidated. Hypoxanthine emerges as a multifunctional metabolic regulator with context-dependent roles in diabetes, obesity, and related disorders. Its dynamic level alterations and tissue-specific bioactivities provide novel insights into disease pathogenesis. Future investigations should prioritize delineating adipocyte-specific mechanisms of hypoxanthine action and evaluating its therapeutic potential through targeted metabolic interventions.
Hypoxanthine as a pro-adipogenic factor
The observed upregulation of PPARγ and CEBPα in response to hypoxanthine treatment suggests that hypoxanthine activates transcriptional pathways driving adipocyte differentiation and lipid accumulation. This is consistent with previous studies implicating purine metabolites in adipogenesis. The ability of hypoxanthine to enhance lipid storage in both preadipocytes and mature adipocytes underscores its potential contribution to adipose tissue expansion and obesity.
Hypoxanthine as a suppressor of thermogenesis
UCP1 expression and mitochondrial respiration by hypoxanthine provide mechanistic insight into its role in impairing thermogenesis. UCP1 is essential for uncoupling oxidative phosphorylation to generate heat, and its downregulation in response to hypoxanthine may contribute to reduced energy expenditure and increased fat accumulation. This finding aligns with the notion that impaired thermogenesis is a hallmark of adipocyte dysfunction in metabolic disorders.
Our findings have important implications for understanding the pathophysiology of metabolic diseases. The accumulation of hypoxanthine in response to high glucose may contribute to the development of insulin resistance and adipose tissue dysfunction by promoting lipid storage and suppressing energy expenditure. Future studies should explore the molecular mechanisms by which hypoxanthine regulates adipocyte function and investigate the potential of hypoxanthine-targeted interventions to improve metabolic health.
Limitations
A key limitation of this study is the lack of extensive clinical validation. Our findings are primarily based on in vitro cell models and zebrafish larvae, with only a small-scale serum comparison performed. Further validation using large-scale clinical cohorts and human tissues is warranted to strengthen the translational significance of our results. Future studies characterizing the dose- and time-dependence of hypoxanthine’s effects are warranted.
In conclusion, this study reveals that high glucose induces hypoxanthine accumulation in mature visceral white adipocytes, promoting adipogenesis, and suppresses thermogenesis. These findings establish hypoxanthine as a key mediator of high glucose-induced adipocyte dysfunction and suggest that modulating hypoxanthine metabolism may offer a promising approach to obesity and related metabolic disorders.
DECLARATIONS
Acknowledgments
We thank all participants involved in this study for their generous cooperation.
Authors’ contributions
Conceptualization: Guo X, Gao J
Methodology: Zhang Z
Software: Li Y
Validation: Zhang Z, Li Y, Zhan S
Formal analysis: Zhang Z
Investigation: Zhang Z, Lin C
Resources: Du J
Data curation: Lin C, Zhan S
Writing - original draft preparation: Zhang Z
Writing - review and editing: Guo X, Gao J
Visualization: Li Y
Supervision: Guo X, Gao J
Project administration: Gao J
Funding acquisition: Guo X
All authors have read and agreed to the published version of the manuscript.
Availability of data and materials
The datasets generated and/or analyzed during the current study are available from the corresponding author on reasonable request.
AI and AI-assisted tools statement
During the preparation of this manuscript, the AI tool DeepSeek was used solely for language editing. The tool did not influence the study design, data collection, analysis, interpretation, or the scientific content of the work. All authors take full responsibility for the accuracy, integrity, and final content of the manuscript.
Financial support and sponsorship
This work was supported by the National Key Research and Development Program of China (grant numbers 2021YFC2701900, 2021YFC2701903), the National Natural Science Foundation of China (grant numbers 82100915, 82170869), the Key Supporting Disciplines of Shanghai Health System (No. 2023ZDFC0403) and the Research Fund of Shanghai Tongren Hospital, Shanghai Jiaotong University School of Medicine (TRYJ2024LC03).
Conflicts of interest
All authors declared that there are no conflicts of interest.
Ethical approval and consent to participate
Animal procedures were approved by Tongren Hospital Animal Ethics Committee (Ref: A2022-016-01; 10/27/2022). The clinical study was approved by the Internal Review and Ethics Boards of Tongren Hospital, affiliated with Shanghai Jiao Tong University School of Medicine (Approval No. 2022-049-01). All animal protocols are followed by the Animal Ethics Committee of Tongren Hospital, China.
Consent for publication
Not applicable.
Copyright
© The Author(s) 2026.
Supplementary Materials
REFERENCES
1. Boutari C, Mantzoros CS. A 2022 update on the epidemiology of obesity and a call to action: as its twin COVID-19 pandemic appears to be receding, the obesity and dysmetabolism pandemic continues to rage on. Metabolism. 2022;133:155217.
2. Du W, Wang H, Su C, Jia X, Zhang B. Thirty-year urbanization trajectories and obesity in modernizing China. Int J Environ Res Public Health. 2022;19:1943.
3. 2021 Adult BMI Collaborators. Global, regional, and national prevalence of adult overweight and obesity, 1990-2021, with forecasts to 2050: a forecasting study for the Global Burden of Disease Study 2021. Lancet. 2025;405:813-38.
4. Olm M, Stark RG, Beck N, Röger C, Leidl R. Impact of interventions to reduce overnutrition on healthcare costs related to obesity and type 2 diabetes: a systematic review. Nutr Rev. 2020;78:412-35.
5. Choo YN, Ravi RN, Subramaniyan V. Insulin resistance induced by obesity: Mechanisms, metabolic implications and therapeutic approaches. Mol Biol Rep. 2026;53:357.
6. Zatterale F, Longo M, Naderi J, et al. Chronic adipose tissue inflammation linking obesity to insulin resistance and type 2 diabetes. Front Physiol. 2019;10:1607.
7. Sancar G, Birkenfeld AL. The role of adipose tissue dysfunction in hepatic insulin resistance and T2D. J Endocrinol. 2024;262:e240115.
8. Kochumon S, Malik MZ, Sindhu S, et al. Gut dysbiosis shaped by cocoa butter-based sucrose-free HFD leads to steatohepatitis, and insulin resistance in mice. Nutrients. 2024;16:1929.
9. Ahmed B, Sultana R, Greene MW. Adipose tissue and insulin resistance in obese. Biomed Pharmacother. 2021;137:111315.
10. Takeuchi N, Higashida K, Li X, Nakai N. Glucose enhances catecholamine-stimulated lipolysis via increased glycerol-3-phosphate synthesis in 3T3-L1 adipocytes and rat adipose tissue. Mol Biol Rep. 2021;48:6269-76.
11. Palacios-Ortega S, Varela-Guruceaga M, Martínez JA, de Miguel C, Milagro FI. Effects of high glucose on caveolin-1 and insulin signaling in 3T3-L1 adipocytes. Adipocyte. 2016;5:65-80.
12. Rharass T, Lucas S. High glucose level impairs human mature bone marrow adipocyte function through increased ROS production. Front Endocrinol. 2019;10:607.
13. Tang L, Huang X, Li P. High glucose triggers macrophage senescence through mitochondrial dysfunction and mitophagy impairment. Cell Biochem Funct. 2026;44:e70211.
14. Świderska E, Podolska M, Strycharz J, et al. Hyperglycemia changes expression of key adipogenesis markers (C/EBPα and PPARy) and morphology of differentiating human visceral adipocytes. Nutrients. 2019;11:1835.
15. Jiang N, Yang M, Han Y, Zhao H, Sun L. PRDM16 regulating adipocyte transformation and thermogenesis: a promising therapeutic target for obesity and diabetes. Front Pharmacol. 2022;13:870250.
16. Delcourt M, Tagliatti V, Delsinne V, Colet JM, Declèves AE. Influence of nutritional intake of carbohydrates on mitochondrial structure, dynamics, and functions during adipogenesis. Nutrients. 2020;12:2984.
17. Achari AE, Jain SK. L-Cysteine supplementation increases adiponectin synthesis and secretion, and GLUT4 and glucose utilization by upregulating disulfide bond A-like protein expression mediated by MCP-1 inhibition in 3T3-L1 adipocytes exposed to high glucose. Mol Cell Biochem. 2016;414:105-13.
18. Tsuchiya A, Nagaya H, Kanno T, Nishizaki T. Oleic acid stimulates glucose uptake into adipocytes by enhancing insulin receptor signaling. J Pharmacol Sci. 2014;126:337-43.
19. Jiang S, Zhang G, Miao J, et al. Transcriptome and metabolome analyses provide insight into the glucose-induced adipogenesis in porcine adipocytes. Curr Issues Mol Biol. 2024;46:2027-42.
20. Qiao Q, Bouwman FG, Renes J, Mariman ECM. An in vitro model for hypertrophic adipocytes: time-dependent adipocyte proteome and secretome changes under high glucose and high insulin conditions. J Cell Mol Med. 2020;24:8662-73.
21. Cao Y, Zhao R, Guo K, et al. Potential metabolite biomarkers for early detection of stage-I pancreatic ductal adenocarcinoma. Front Oncol. 2021;11:744667.
22. Huang S, Liang H, Chen Y, et al. Hypoxanthine ameliorates diet-induced insulin resistance by improving hepatic lipid metabolism and gluconeogenesis via AMPK/mTOR/PPARα pathway. Life Sci. 2024;357:123096.
23. Ye J, Bi X, Deng S, et al. Hypoxanthine is a metabolic biomarker for inducing GSDME-dependent pyroptosis of endothelial cells during ischemic stroke. Theranostics. 2024;14:6071-87.
24. Toledo-Ibelles P, Gutiérrez-Vidal R, Calixto-Tlacomulco S, Delgado-Coello B, Mas-Oliva J. Hepatic accumulation of hypoxanthine: a link between hyperuricemia and nonalcoholic fatty liver disease. Arch Med Res. 2021;52:692-702.
Cite This Article
How to Cite
Download Citation
Export Citation File:
Type of Import
Tips on Downloading Citation
Citation Manager File Format
Type of Import
Direct Import: When the Direct Import option is selected (the default state), a dialogue box will give you the option to Save or Open the downloaded citation data. Choosing Open will either launch your citation manager or give you a choice of applications with which to use the metadata. The Save option saves the file locally for later use.
Indirect Import: When the Indirect Import option is selected, the metadata is displayed and may be copied and pasted as needed.
About This Article
Special Topic
Copyright

Data & Comments
Data
0


Comments
Comments must be written in English. Spam, offensive content, impersonation, and private information will not be permitted. If any comment is reported and identified as inappropriate content by OAE staff, the comment will be removed without notice. If you have any queries or need any help, please contact us at [email protected].