


fig2
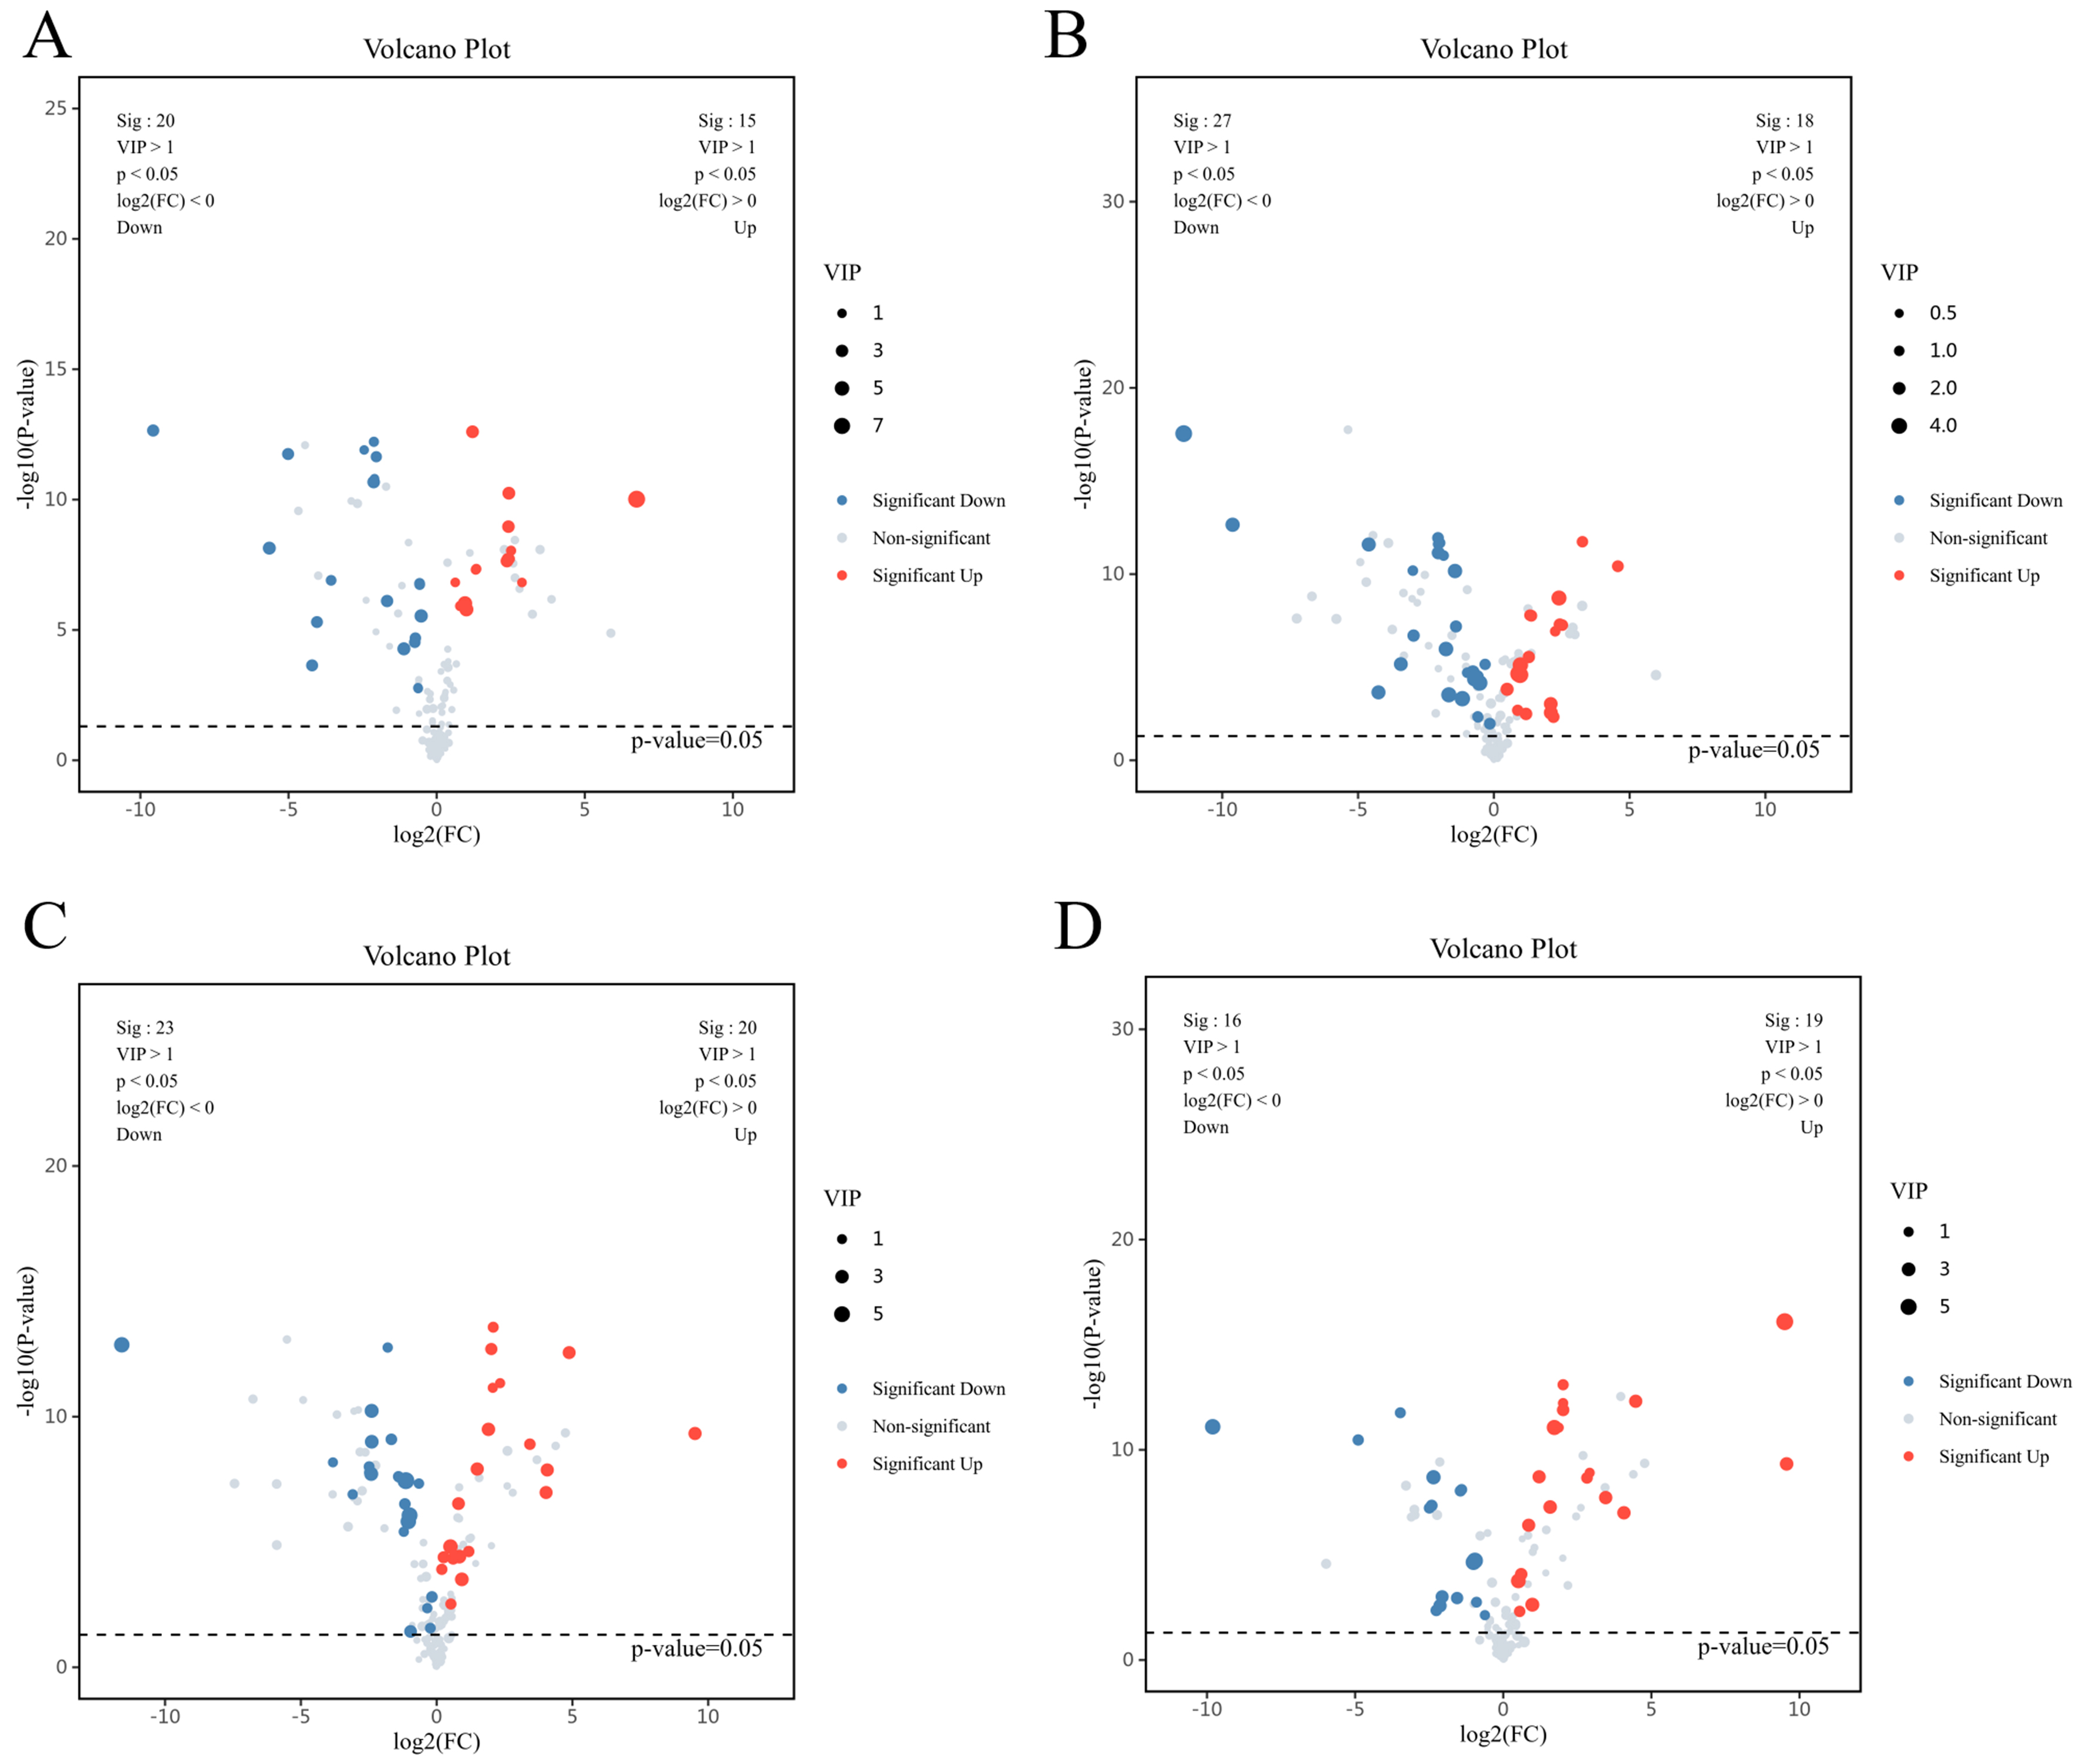
Figure 2. (A) Volcano plot illustrating differentially abundant metabolites between WAT and pre-WAT under C conditions. Dashed lines mark thresholds (|log2FC| > 1, FDR-adjusted P < 0.05); (B) Volcano plot identifying HG-induced cell-type-specific metabolic alterations (HG-treated WAT vs. HG-treated pre-WAT). Red/blue points denote metabolites significantly upregulated/downregulated in WAT; (C) Volcano plot revealing HG-responsive metabolites in mature adipocytes (HG-WAT vs. C-WAT). Annotated metabolites indicate key pathways perturbed by hyperglycemia; (D) Volcano plot highlighting glycemic stress-associated metabolic shifts in pre-WAT (HG-pre-WAT vs. C-pre-WAT). Grey dashed ellipse encloses metabolites with concerted regulation patterns. C: Control; FC: fold change; FDR: false discovery rate; HG: high glucose; pre-WAT: precursor white visceral adipocytes; WAT: mature white visceral adipocytes.


