


fig3
From: High glucose induces hypoxanthine accumulation, linking hyperglycemia to adipocyte dysfunction
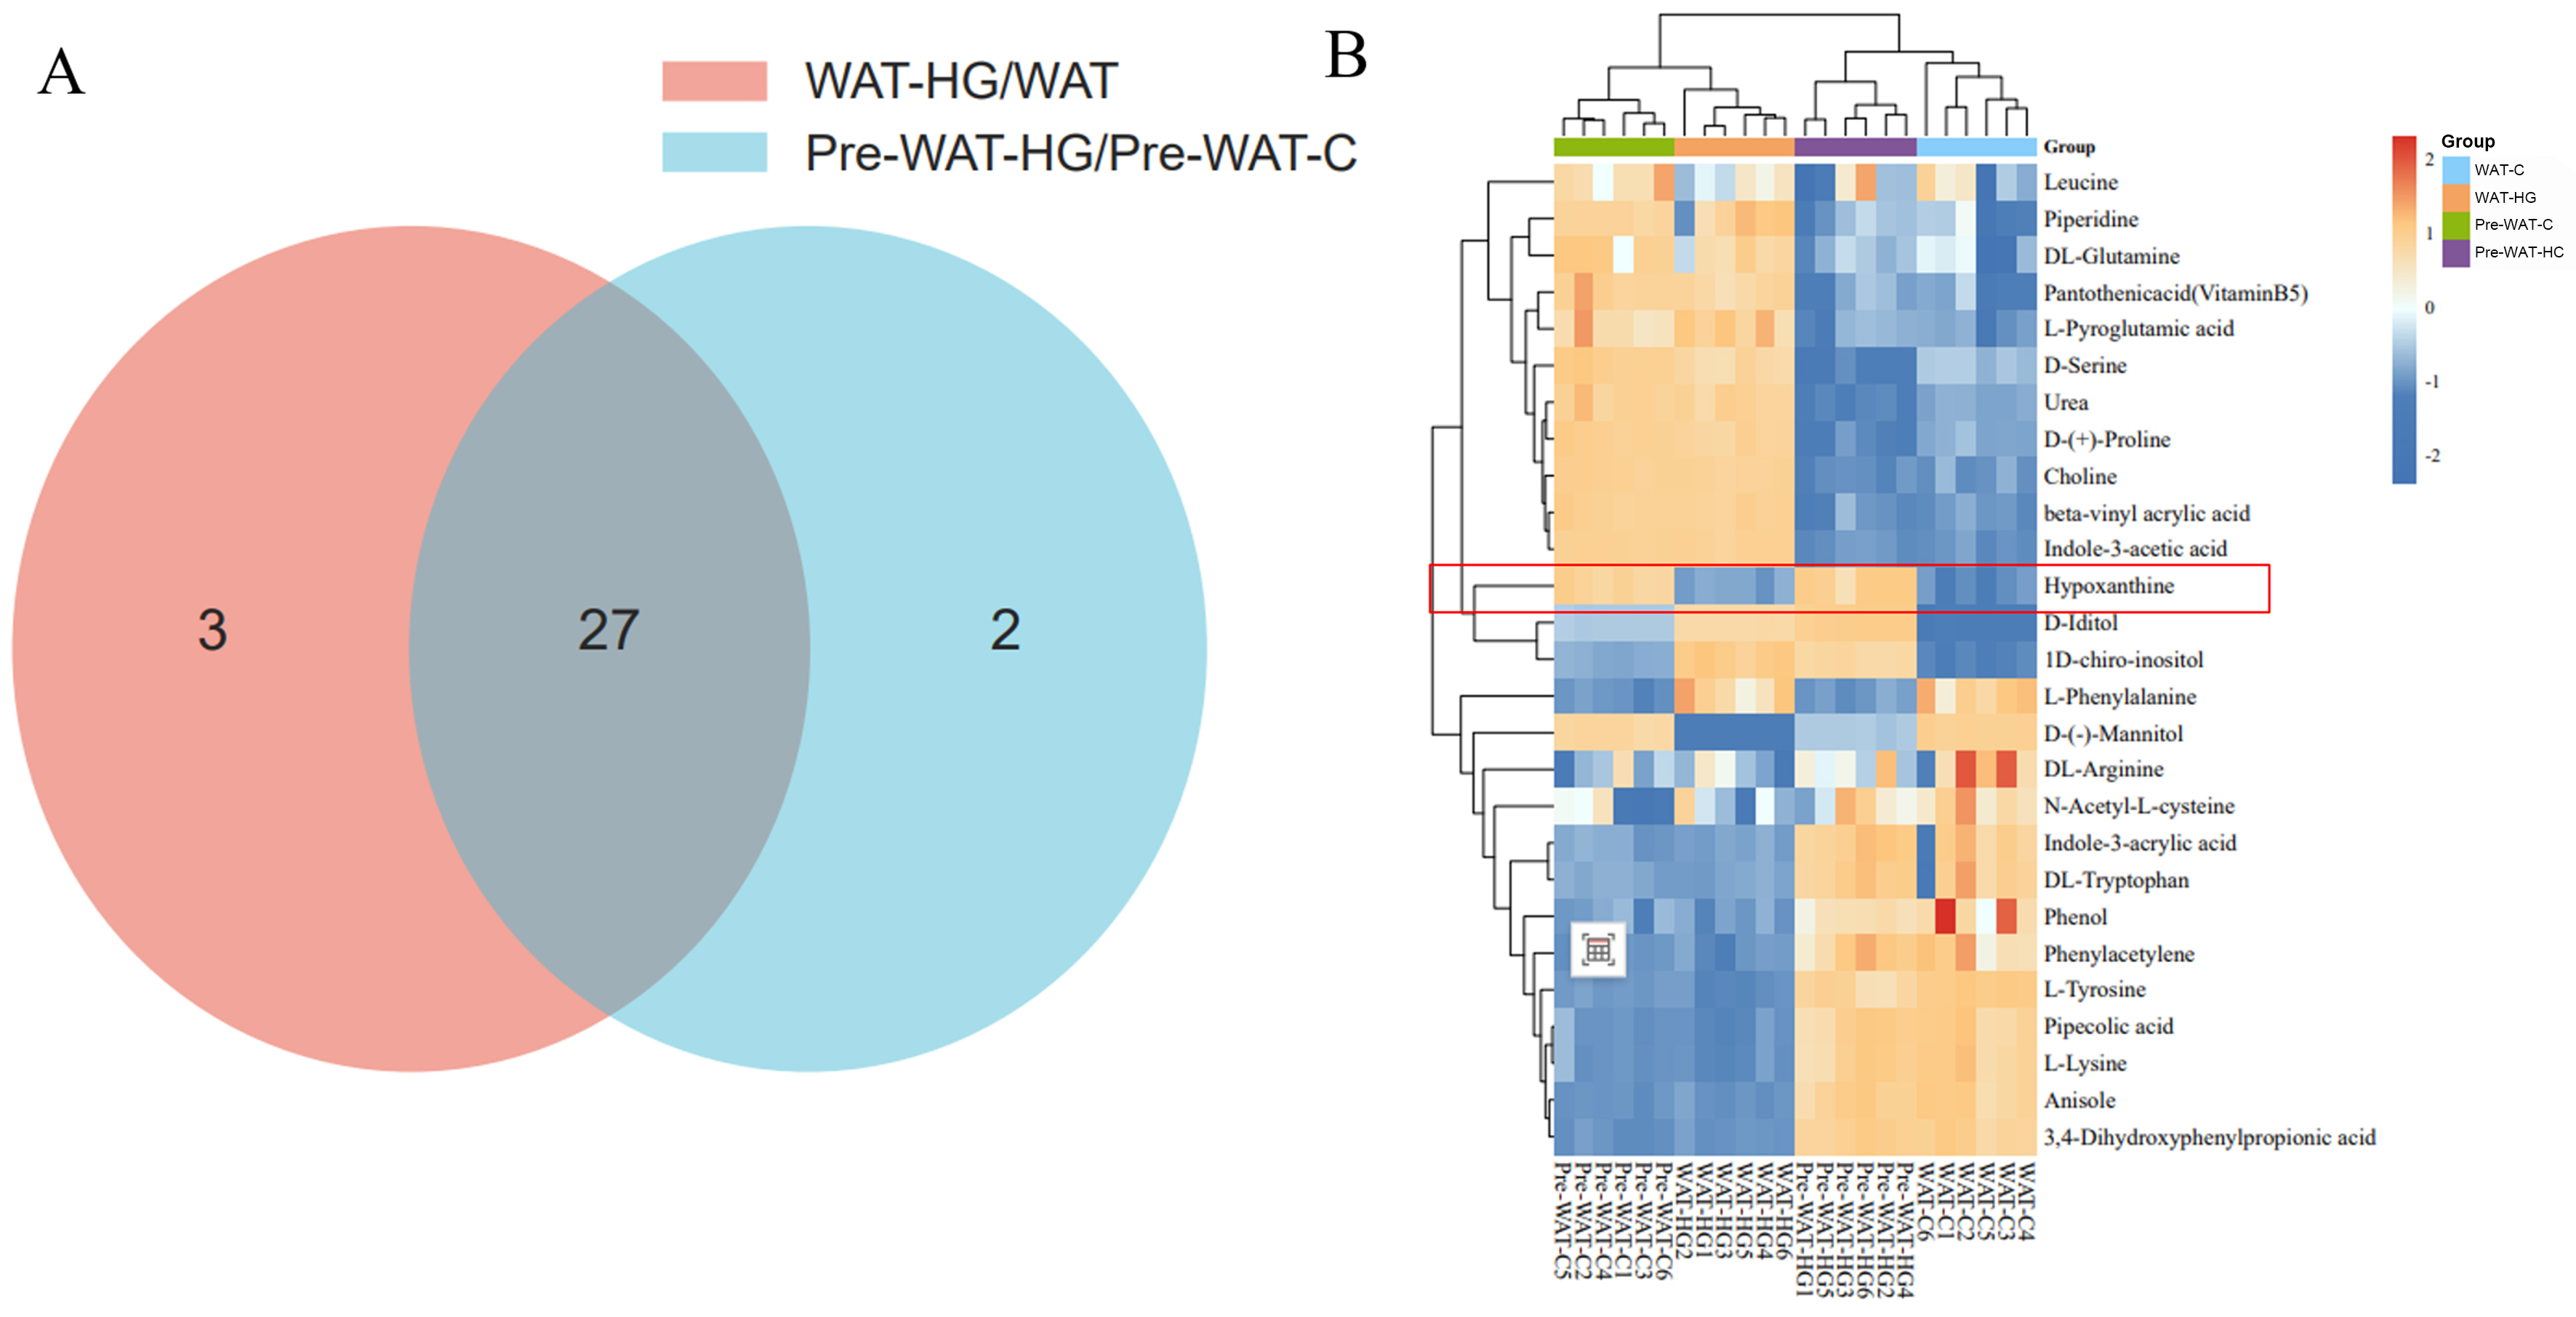
Figure 3. (A) Venn diagram analysis of dysregulated metabolites, showing significantly altered metabolites (FDR < 0.05) in WAT-HG vs. WAT-C and pre-WAT-HG vs. pre-WAT-C under high-glucose stimulation; (B) Hierarchical clustering of differentially abundant metabolites. C: Control; FDR: false discovery rate; HG: high glucose; pre-WAT: precursor white visceral adipocytes; WAT: mature white visceral adipocytes.


