


fig1
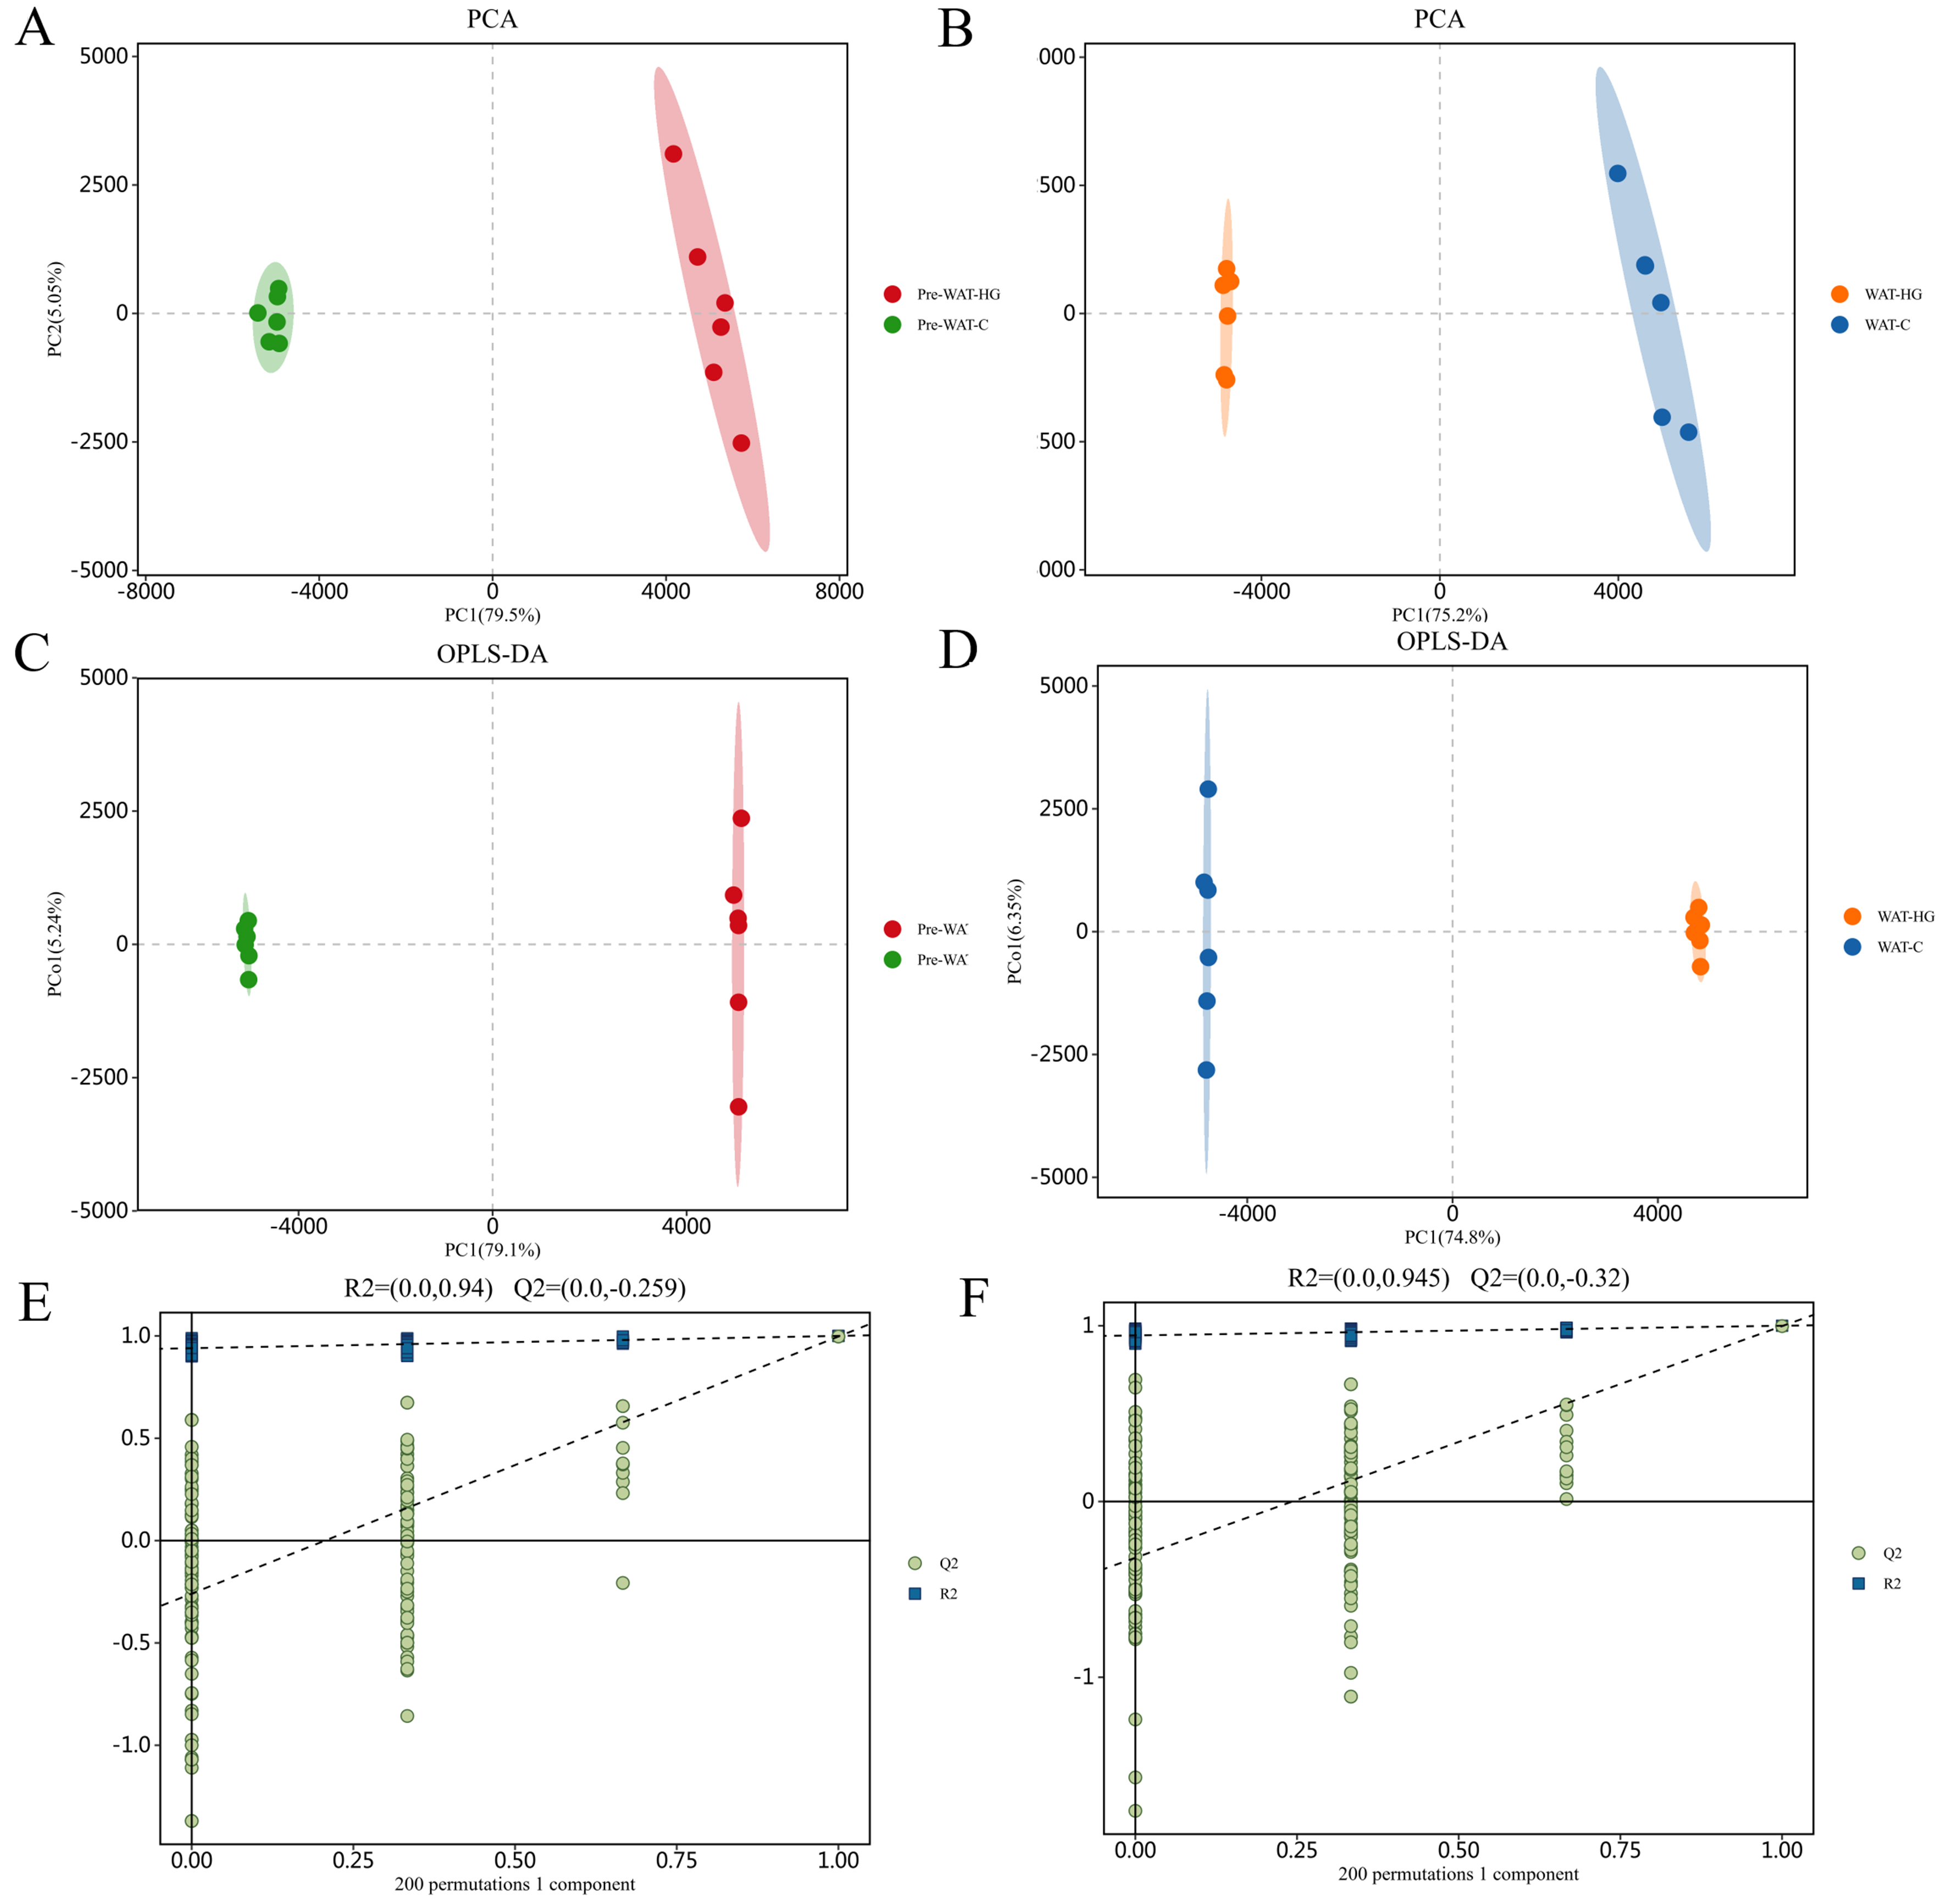
Figure 1. (A) PCA score plot revealing differential metabolic states of pre-WAT cultured under HG vs. C (n = 6 per group); (B) PCA score plot delineating HG-induced metabolic remodeling in WAT compared to C-maintained WAT; (C) OPLS-DA score plot contrasting metabolic divergence of HG-exposed WAT vs. HG-exposed pre-WAT, with explicit discrimination along predictive component; (D) OPLS-DA score plot revealing intervention-specific variance in HG-treated WAT compared to C-maintained WAT cohorts; (E) Permutation test confirming condition-specific discrimination in pre-WAT cultured under HG vs. C environments (95% confidence interval of permuted models shown in shaded area); (F) Validation plot for HG-induced metabolic perturbations in WAT vs. C-maintained WAT cohorts, with permuted Q2 values (-0.259) distinctly lower than original model (blue). C: Control; HG: high glucose; OPLS-DA: orthogonal partial least squares discriminant analysis; PCA: principal component analysis; pre-WAT: precursor white visceral adipocytes; Q2: predictive ability parameter; WAT: mature white visceral adipocytes.


