




Effect of trace rare earth La on the thermal stability of oxygen-free copper
 0
0 Abstract
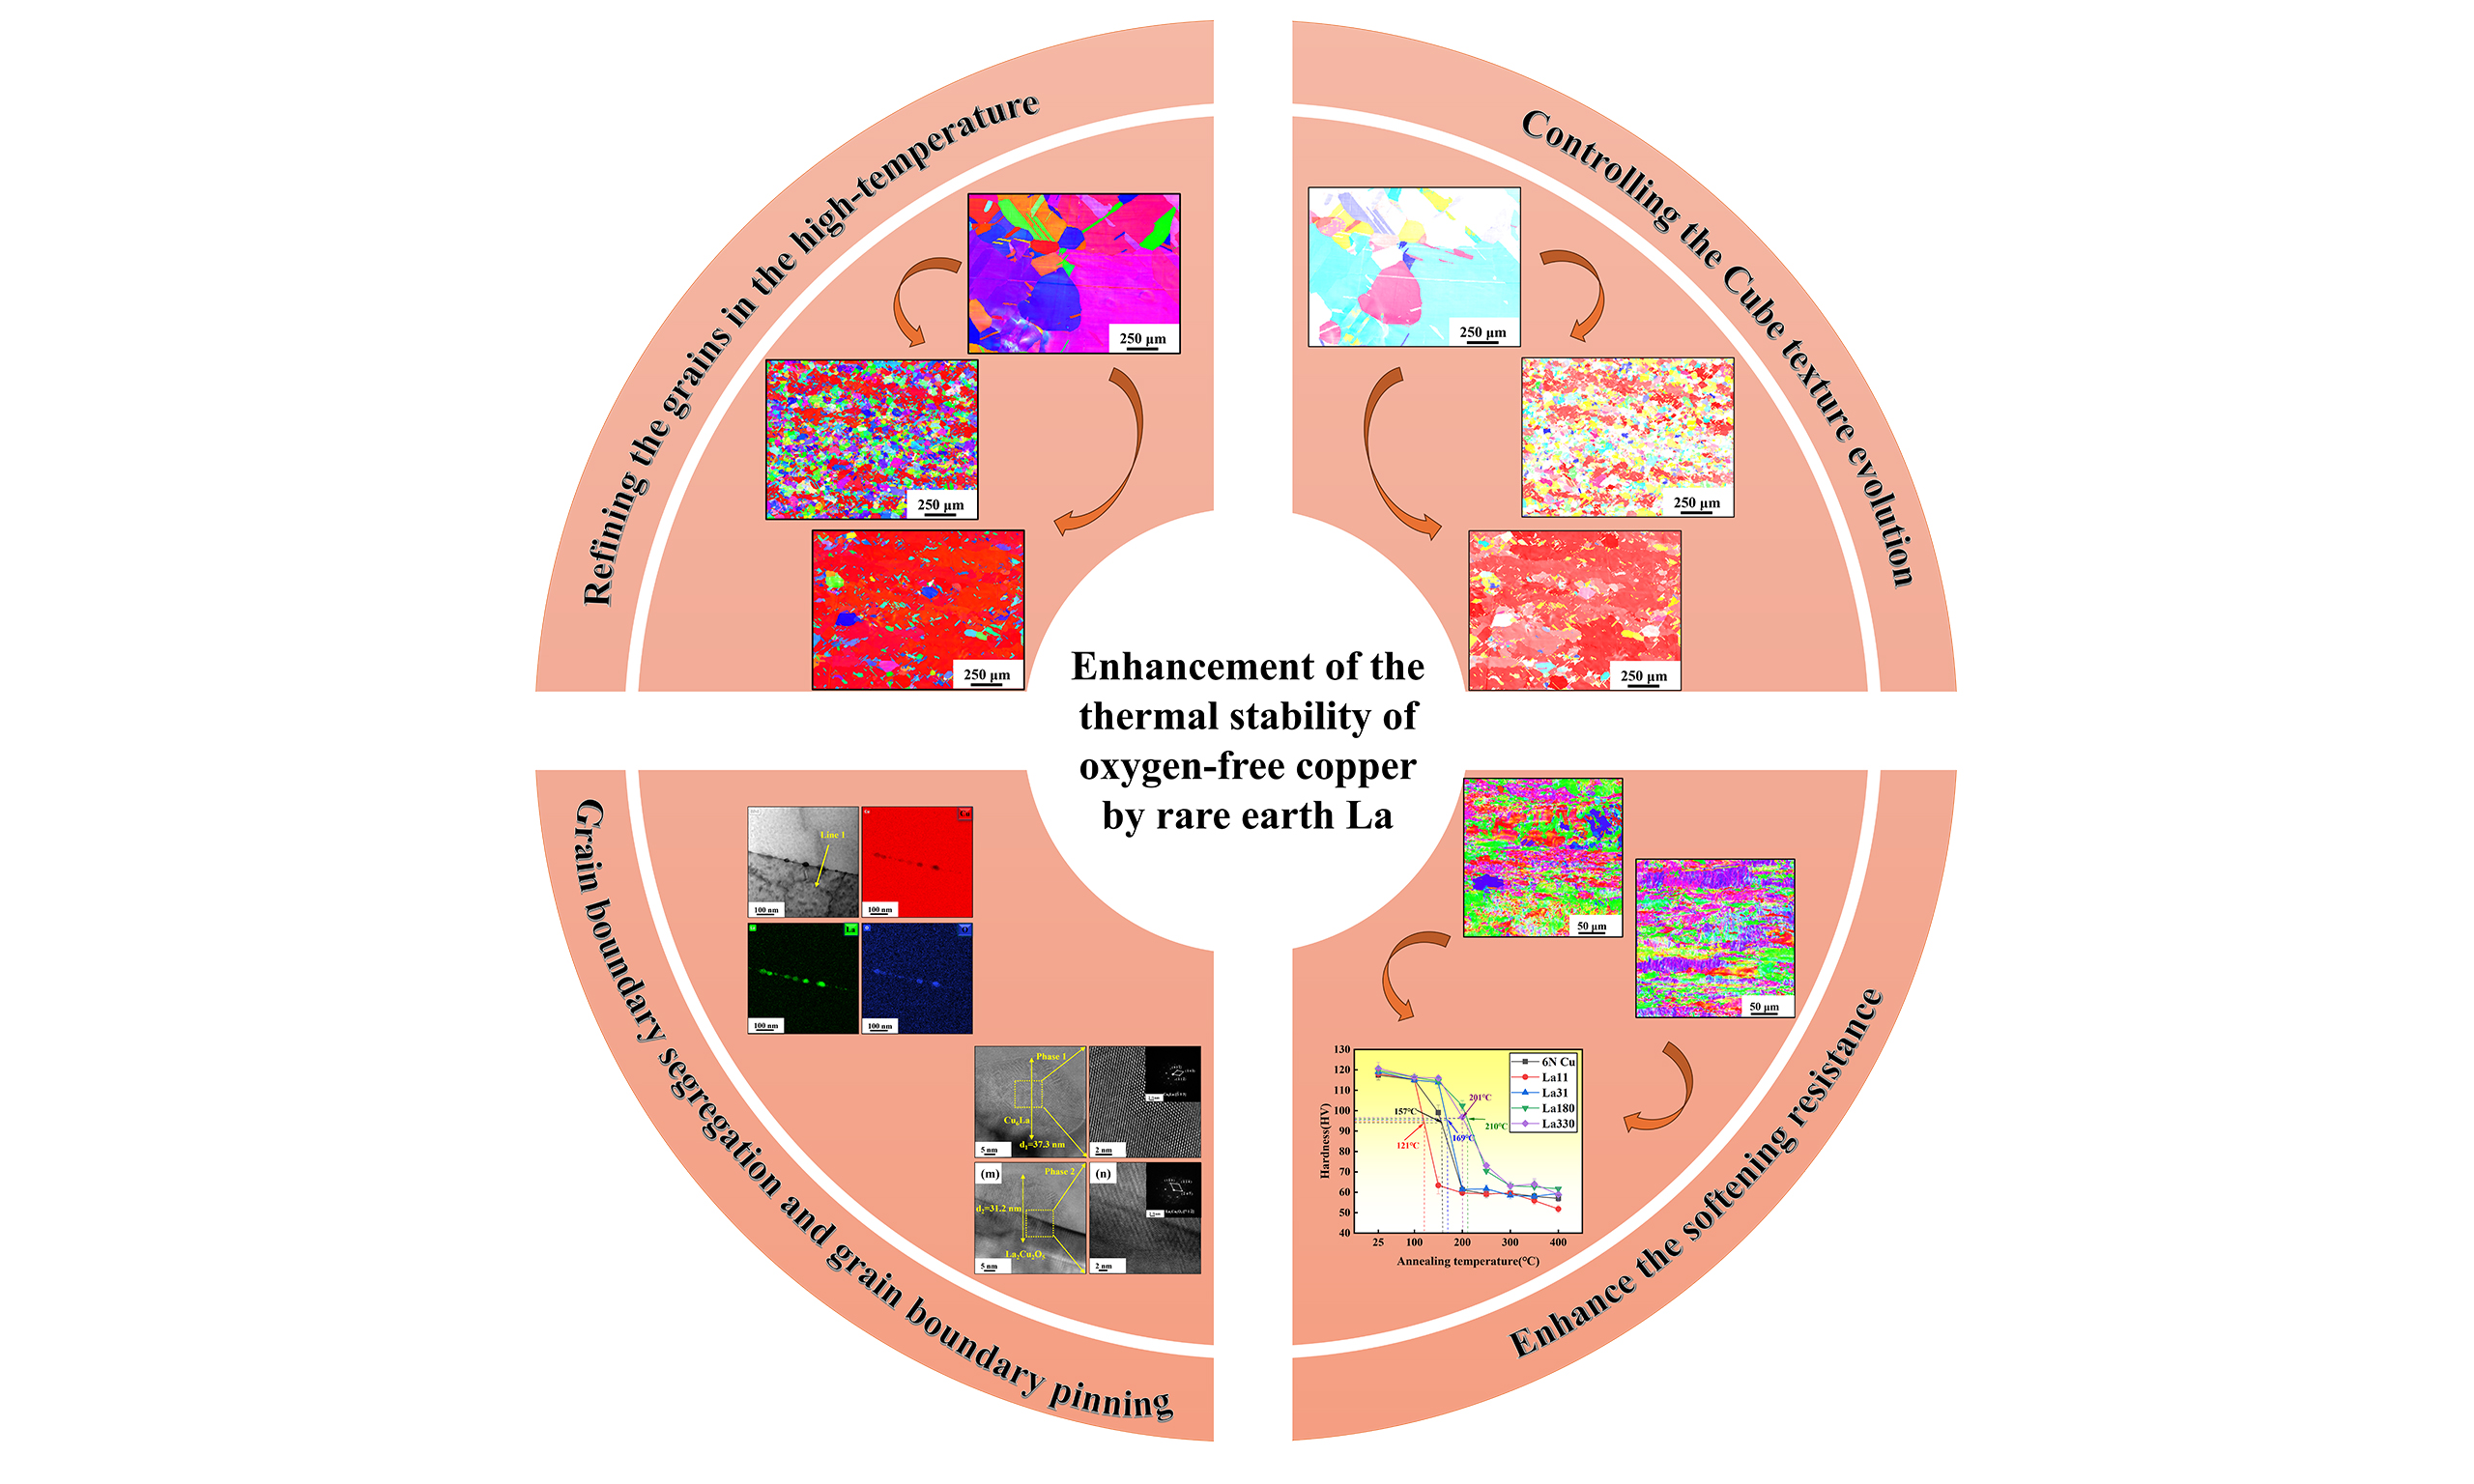
This study elucidates how rare-earth lanthanum (La) content regulates the thermal stability of oxygen-free copper (OFC). The stability was systematically assessed by investigating the influence of La on grain size, texture evolution, electrical conductivity, hardness, and softening temperature following high-temperature annealing. The results demonstrate that higher La contents (La180 and La330) significantly enhance the thermal stability of OFC. This is achieved by triggering multi-scale La-rich secondary phase precipitation and grain boundary segregation, which synergistically refine the grain structure through dual mechanisms of "promoting nucleation" and "inhibiting grain growth”. Consequently, high electrical conductivity is maintained alongside a remarkable increase in hardness. Among them, La180 exhibits the most significant increase in softening temperature, reaching 210 °C, and also achieves the finest grain size of 38.64 μm after high-temperature annealing, suppressing grain coarsening and abnormal grain growth, markedly improving the "orange-peel" defect, and promoting the transition from Brass-Rec texture to Cube texture. Meanwhile, La180 maintains a high electrical conductivity of 101.3 %IACS after high-temperature annealing, providing a critical theoretical basis and a compositional design window for developing OFC materials that combine ultra-high electrical conductivity with excellent high-temperature softening resistance, suitable for high-reliability direct bonded copper devices.
Keywords
INTRODUCTION
The insulated gate bipolar transistor (IGBT) serves as a critical power device in modern power electronic systems[1,2], whose performance and reliability heavily depend on the quality of the direct bonded copper (DBC) substrate within the package module. Oxygen-free copper (OFC), owing to its superior electrical and thermal conductivity, excellent ductility, and compatibility with ceramic substrates, has been established as the material of choice for the copper layer in DBC substrates. It finds extensive application in high-end power electronic equipment such as new energy vehicles, rail transit, smart grids, marine vessels, and aerospace systems[3-6]. A robust bond with the ceramic substrate is formed via a high-temperature bonding process, ensuring efficient heat dissipation and structural integrity of the module to meet the demanding service requirements of high-power density and high reliability in power electronic devices. However, the DBC bonding process requires the copper and ceramic layers to be joined and held at 800-1,000 °C[7-10]. At these temperatures, processes such as dislocation annihilation, recrystallization, and grain growth[11-13] readily induce abnormal grain coarsening and anomalous orientation in OFC. This leads to the formation of a characteristic "orange peel" defect[14,15], which increases surface roughness[16,17], degrades the mechanical properties of the copper layer, and reduces its thermal cycling stability[18], thereby severely compromising the long-term service safety and reliability of the IGBT module. Wang et al.[19] found that grain coarsening and the change of texture type are the key microstructural factors inducing the "orange peel" defect. When the grain size increases to a magnitude comparable to the material thickness, the influence of the deformation behavior of individual grains on the surface morphology is significantly amplified. Meanwhile, the presence of different crystallographic orientations in the matrix (e.g., Copper-oriented twins penetrating the Goss-textured matrix) further exacerbates the deformation incompatibility between grains and impedes the continuity of dislocation slip, thereby promoting the formation of the orange-peel defect. Therefore, achieving a single crystallographic orientation (e.g., Cube texture) through texture control can mitigate this defect. Hence, suppressing abnormal grain coarsening during high-temperature processing, optimizing the uniformity of texture components, ameliorating the orange-peel defect, and enhancing the thermal stability of OFC under DBC process conditions constitute a critical materials bottleneck that must be overcome for the advancement of high-end power electronics technology.
Currently, microalloying stands as one of the primary and most effective strategies for enhancing the thermal stability of copper and its alloys[20]. The primary functions of microalloying elements in copper alloys encompass grain refinement strengthening, substructure strengthening, and dispersion strengthening via precipitate formation. By forming second-phase particles that pin grain boundaries, these added elements inhibit grain growth, thereby improving resistance to grain coarsening at elevated temperatures. In industrial production and technical applications, there is a difference in thermal stability between commercially pure copper (e.g., 3N, 4N, or even lower purity copper) and high-purity copper. Sakai et al.[21] found that compared with 3N and 4N copper of relatively lower purity, 6N ultra-high-purity copper exhibits more pronounced grain growth due to the lack of impurity-atom pinning at grain boundaries, and its dynamically recrystallized grains undergo faster static softening at high temperatures, resulting in relatively weaker resistance to high-temperature softening. This implies that during the annealing of pure copper, second-phase elements play a critical role in pinning grain boundaries and suppressing grain growth. Sun et al.[22] reported that Zr and Mn microalloying improved the high-temperature resistance to coarsening and mechanical properties of a high-temperature Al-Cu alloy. Their results indicated that microalloying with Zr and Mn plays a crucial role in stabilizing the primary strengthening metastable θ′ phase under high-temperature conditions. Jiang et al.[23] found that adding 0.1 at.% Zr to Cu followed by high-temperature heat treatment prevented catastrophic microstructural and property degradation. This was attributed to low grain boundary mobility and the relaxation of non-equilibrium grain boundaries, maintaining a yield strength comparable to that of ultrafine-grained copper. Hornbuckle et al.[24] discovered that adding 0.5 at. % Li to a Cu-3Ta alloy led to the formation of coherent, ordered Cu3Li precipitates enveloped by a Ta-rich bilayer interphase boundary. This modified the interphase boundary and transformed the nanoprecipitate morphology from spherical to cubic, resulting in nanostructured precipitates with exceptional resistance to thermal coarsening, strength, and creep resistance. Although such microalloyed copper alloys exhibit high thermal stability and maintain excellent mechanical properties under high-temperature service conditions, their electrical conductivity often falls short of the stringent requirements for high-end electronic components like DBC substrates. Consequently, the key technological challenge in the field of copper-based electronic materials lies in further enhancing thermal stability while preserving the excellent electrical conductivity intrinsic to OFC. Tailoring the microstructure of copper alloys by doping with rare earth elements, which have a minimal impact on electrical conductivity, offers a promising route to significantly improve thermal stability while largely retaining conductive properties.
Rare earth elements such as Sc, Ce, and lanthanum (La) have been extensively investigated in copper and copper alloys[25,26]. The influence of rare earth elements on the thermal stability of OFC is mainly reflected in increasing the recrystallization temperature, inhibiting high-temperature grain growth, and optimizing microstructural evolution. By doping with rare earth elements that have a minor impact on electrical conductivity to regulate the microstructure of OFC, it is expected to improve the thermal stability of OFC while ensuring that its electrical conductivity is essentially not compromised. These elements can enhance thermal stability by mechanisms including solute drag, solute segregation at grain boundaries, and pinning by second-phase particles, all of which reduce grain boundary migration rates at elevated temperatures.
Among various rare earth elements, La has garnered significant attention and application due to its abundant natural reserves and relatively low production cost[29]. The solid solubility of La in OFC is extremely low. Trace amounts of La do not exist as solute atoms within the copper lattice; instead, they form second-phase compounds with copper or impurity elements (e.g., O, P, S), which purify the matrix and help maintain high electrical conductivity[30]. Furthermore, La can form second-phase particles that strongly impede grain boundary migration via dual mechanisms involving solute drag and Zener pinning, thereby enhancing thermal stability.
In the present work, five OFC specimens containing varying trace levels of rare-earth La were prepared based on 6N (> 99.9999%) OFC. The thermal stability of the materials was systematically evaluated by determining the softening temperature and conducting a comprehensive analysis of the microstructure, texture evolution, and mechanical and electrical properties after annealing at 900 °C. The microstructure and morphology of the materials were analyzed using electron backscatter diffraction (EBSD) and transmission electron microscopy (TEM). This revealed the influence mechanism of trace La on the evolution of microstructural morphology and texture in OFC after high-temperature annealing, clarified the mechanism by which La affects the softening temperature of OFC, and focused on analyzing the mechanism by which multi-scale La precipitation and grain boundary segregation enhance thermal stability. This work provides a foundational theoretical basis and an effective compositional design approach for engineering OFC materials which simultaneously exhibit high electrical conductivity and excellent thermal stability. The relevant findings are particularly applicable to power electronic devices (e.g., DBC substrates) and high-power functional electronic devices that undergo high-temperature processing or long-term service, demonstrating broad application prospects. This research also holds significant importance for promoting the entry of copper sheet and strip products into the high-end international market.
MATERIALS AND METHODS
Melting was conducted using a H20-04-type model induction vacuum furnace, with a charge mass of roughly 3 kg per batch. The raw materials used in the smelting process comprised electrolytic copper plates of 99.9999% (6N) purity together with high-purity La metal. The impurity contents in the initial 6N Cu master batch were determined by glow discharge mass spectrometry (GDMS) and a N/O gas analyzer, with the following results: P < 0.001 ppm wt%, S < 0.005 ppm wt% (measured by GDMS), and O < 5 ppm wt% (measured by the nitrogen/oxygen gas analyzer). After melting, the ingots were extruded at elevated temperature into 10-mm-thick plates, and specimens were then taken for compositional analysis via a 5110SVDV ICP-OES instrument, with the resulting compositions listed in Table 1. The samples were then subjected to cold rolling: first, an initial cold rolling with a reduction of 85% was performed using a two-roll mill to obtain OFC sheets with a thickness of 1.5 mm, subsequently, recrystallization annealing was carried out at 400 °C for 1 h to obtain a fine and uniform equiaxed grain structure. Afterward, a second cold rolling was applied to the samples, reducing them to a final thickness of 0.3 mm. The rolled samples were then used for softening temperature testing and high-temperature annealing treatments, respectively.
Mass fraction of rare earth element La in various OFC (wt.%)
| Specimen | La addition/% | La content by measurement/% |
| 6N Cu | - | - |
| La11 | 0.01 | 0.0011 |
| La31 | 0.03 | 0.0031 |
| La180 | 0.05 | 0.0180 |
| La330 | 0.15 | 0.0330 |
Electrical conductivity testing: Electrical conductivity measurements were performed using a Sigma 2008 series portable digital eddy current conductivity meter, with a measurement range of 0.51-112 %IACS. After the instrument is turned on, the probe is preheated for approximately 10 min to ensure measurement accuracy. For each sample, the conductivity is measured 5 times, and the average value is taken as the conductivity of the specimen measured.
Hardness testing: Hardness testing was performed using an HV-10MPTA Vickers hardness tester. Vickers hardness was measured at room temperature, with a test force of 0.3 kgf (i.e., 2.942 N) and a dwell time of
Softening temperature testing: According to the Chinese standard GB/T 33370-2016 for determining the softening temperature of copper and copper alloys, the softening temperature is defined as the holding temperature at which the hardness of the material decreases to 80% of its original value after being held for
High-temperature annealing: The samples after the second cold rolling were subjected to high-temperature annealing at 900 °C for 30 min. After holding, the samples were taken out and air-cooled. During annealing, a mixed gas of N2 (93%) and O2 (7%) was introduced to simulate the typical mild oxidation environment during high-temperature bonding of DBC substrates. Under this oxygen partial pressure, a dense Cu2O layer preferentially forms on the copper surface during annealing at 900 °C; this oxide layer serves as an active layer for the subsequent eutectic reaction with the ceramic interface, promoting metallurgical bonding. If the oxygen content is too low (e.g., below 1%), insufficient Cu2O is generated, which may lead to poor interfacial bonding; conversely, if the oxygen content is too high (e.g., 21% in air atmosphere), a loose, non-conductive CuO layer forms on the copper surface, accompanied by possible spallation, severely degrading the interfacial performance.
EBSD analysis was performed using two field-emission scanning electron microscopes (FESEMs): a Carl Zeiss SIGMA 500 equipped with an OXFORD C-Nano EBSD detector, and a Thermo Fisher Scientific Apreo 2C equipped with an OXFORD Symmetry S3 EBSD detector. For the Carl Zeiss SIGMA 500 FESEM, the operating conditions were: an accelerating voltage of 20 kV, a sample tilt angle of 70°, and a scan step size of
A detailed flowchart summarizing the experimental procedures and parameters is provided in Figure 1.
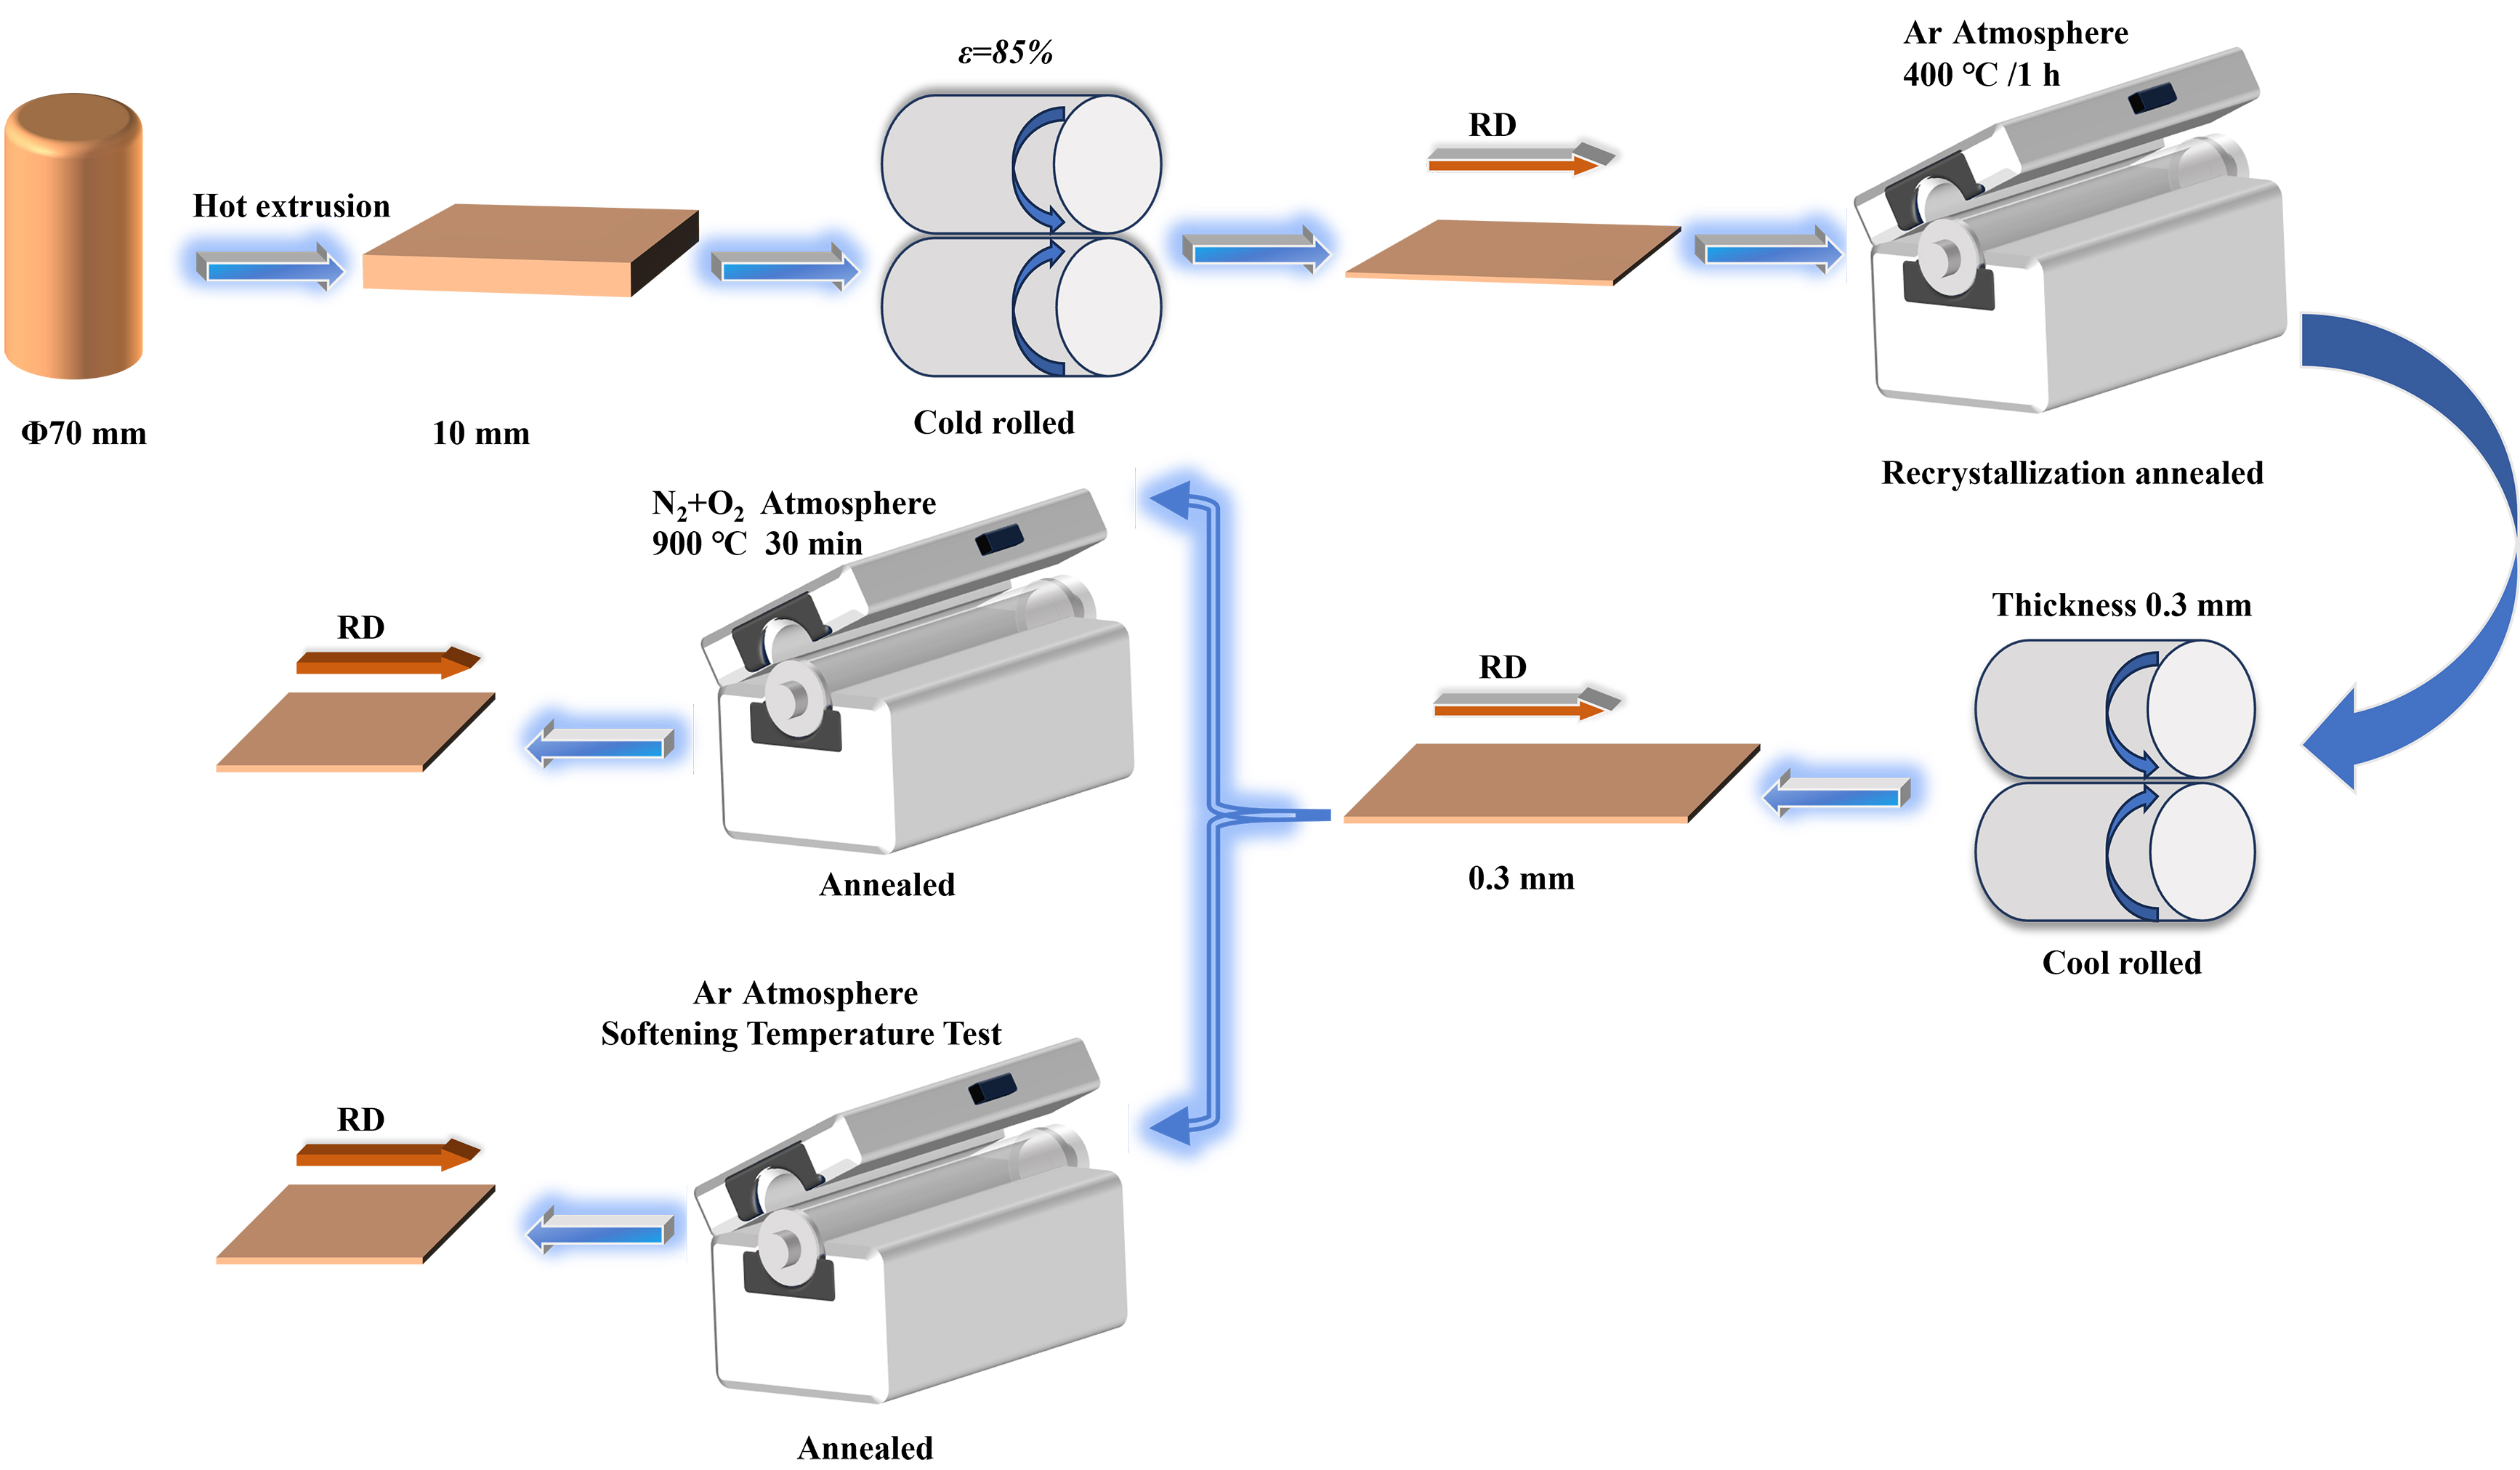
Figure 1. Schematic illustration of the experimental procedure.
RESULTS AND DISCUSSION
Effect of trace La on the microstructure and properties of OFC after high-temperature annealing
Microstructure morphology
Figure 2A1-E1, A2-E2, A3-E3 displays EBSD IPF maps, grain boundary maps, and grain size distribution histograms, respectively, for OFC with varying La content upon annealing at 900 °C for a duration of 30 min. Rolling direction (RD) is defined as the direction along which the sheet was rolled (i.e., the direction of metal elongation). Transverse direction (TD) refers to the direction perpendicular to the RD within the rolling plane. As seen in Figure 2A1-E1 and A3-E3, the 6N Cu exhibits a large average grain size of 336.52 μm. The La11 and La31 samples have grain sizes of 332.32 and 323.45 μm, respectively, indicating negligible grain refinement. This suggests that trace amounts of La are insufficient to inhibit grain coarsening in OFC. In contrast, the La180 and La330 samples show significantly refined grains with sizes of only 38.64 and
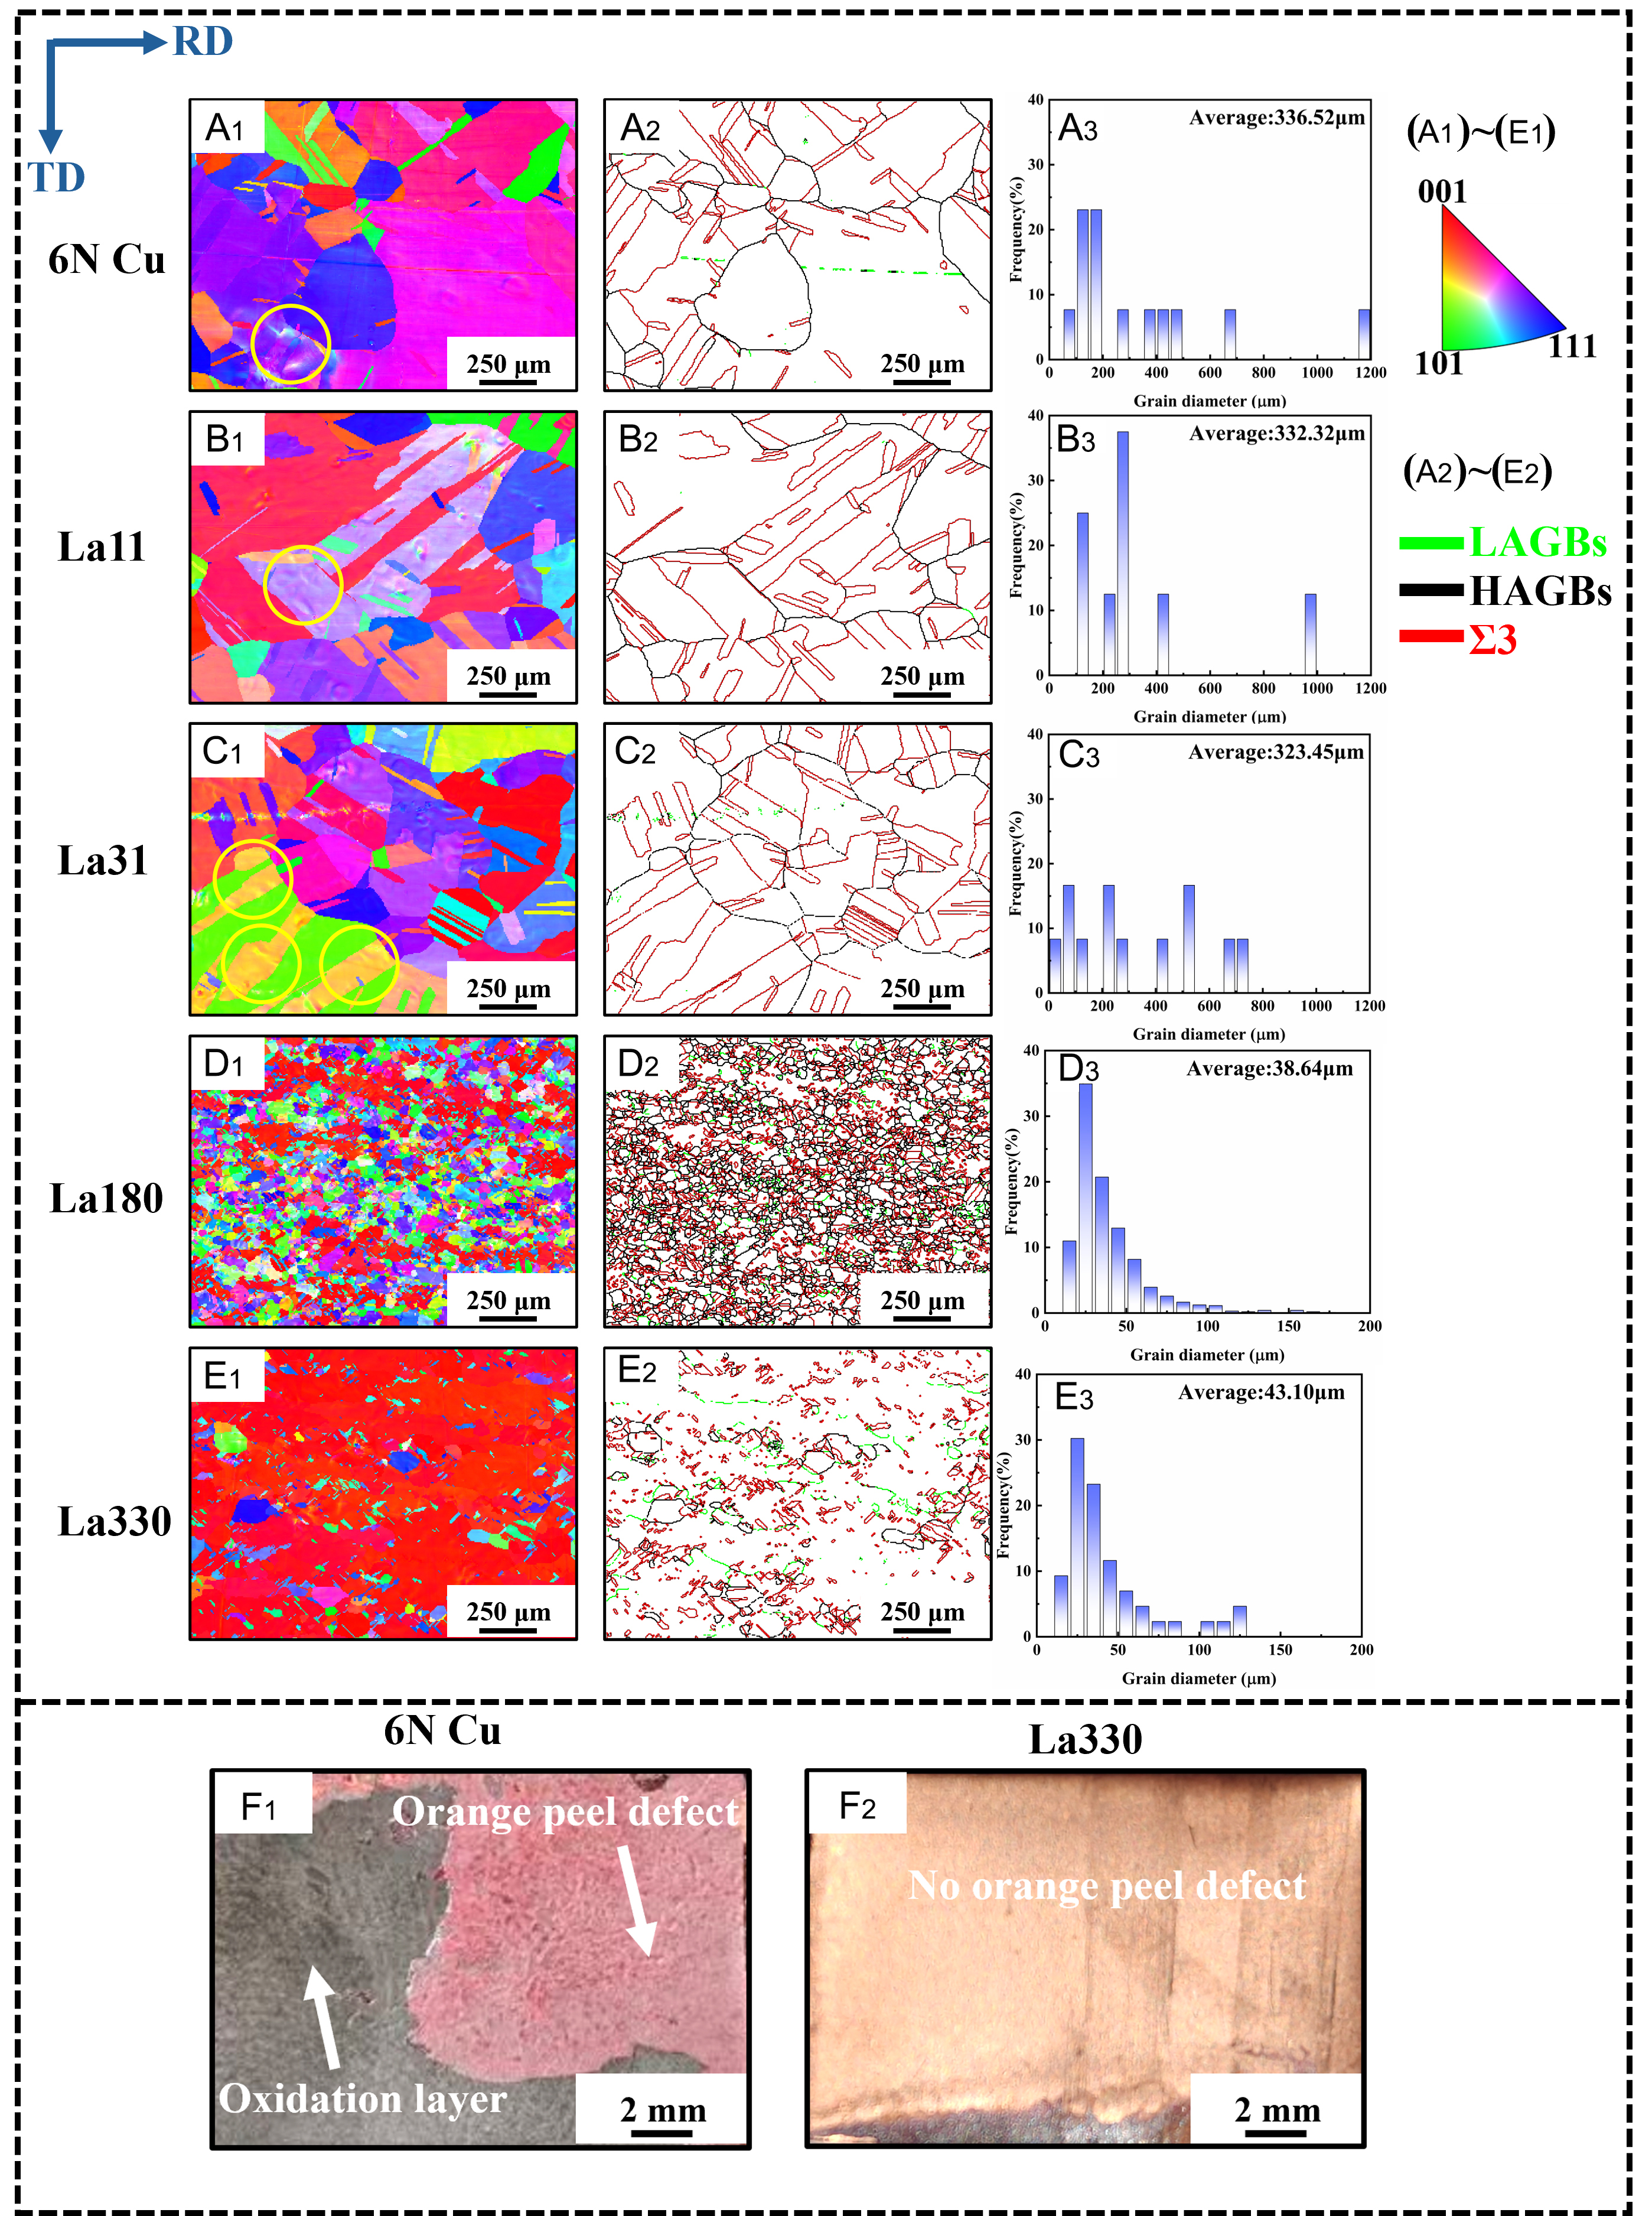
Figure 2. IPF map, grain boundary distribution, grain size statistics and macroscopic morphology of orange peel defect after annealing at 900 °C for 30 min: (A1-A3) 6N Cu, (B1-B3) La11, (C1-C3) La31, (D1-D3) La180, (E1-E3) La330, (F1) 6N Cu, (F2) La330.
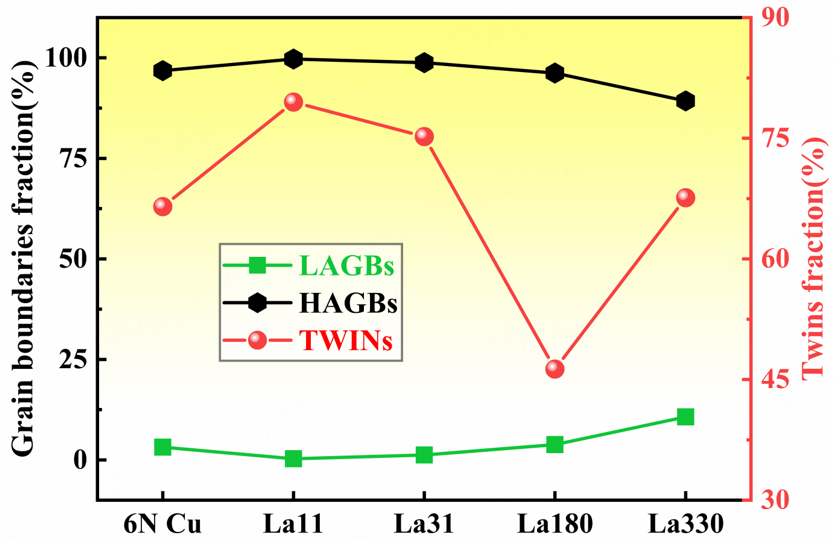
Figure 3. Fraction of various grain boundary types in OFC as a function of La content following annealing at 900 °C for 30 min.
Figure 4 shows that as the content of the rare earth element La increases, the combined proportion of grains with {111}, {101}, and {001} orientations gradually increases. For La330, the majority of grains are oriented along {001}, accounting for 85.4%. The grain size distribution in 6N Cu, La11, and La31 is inhomogeneous, with numerous grains having anomalous orientations, resulting in high orientation anisotropy. This strong anisotropy is closely related to the "orange peel" defect formed after high-temperature annealing. From a micro-morphological perspective, for an individual grain, when the external force direction is favorably oriented relative to its slip systems (i.e., has a high Schmid factor), the grain is in a "soft orientation" and requires only a small, resolved shear stress to initiate slip, making it prone to deformation[31]. Conversely, grains in "hard orientations" are difficult to deform. During surface finishing or service, regions of soft-oriented grains experience more deformation and tend to recess, while regions of hard-oriented grains deform less and remain relatively protrusive. Due to the coarse grain size, each grain occupies a large area on the surface, causing this undulation to manifest on a per-grain scale and form the "orange peel" appearance. In La180 and La330, the grain orientations are more similar, and the grain distribution is more uniform, resulting in no significant "orange peel" defect. Macroscopic morphology is depicted in Figure 2F1 and F2. For the 6N Cu sample, the "orange peel" defect is distinctly observed beneath the oxide layer formed after high-temperature annealing, manifesting macroscopically as uneven, scaly textures. In contrast, the La330 sample exhibits a smooth surface with a mirror-like metallic luster. This observation suggests that the addition of a relatively high content of rare earth La mitigates the "orange peel" defect induced by abnormal grain coarsening.
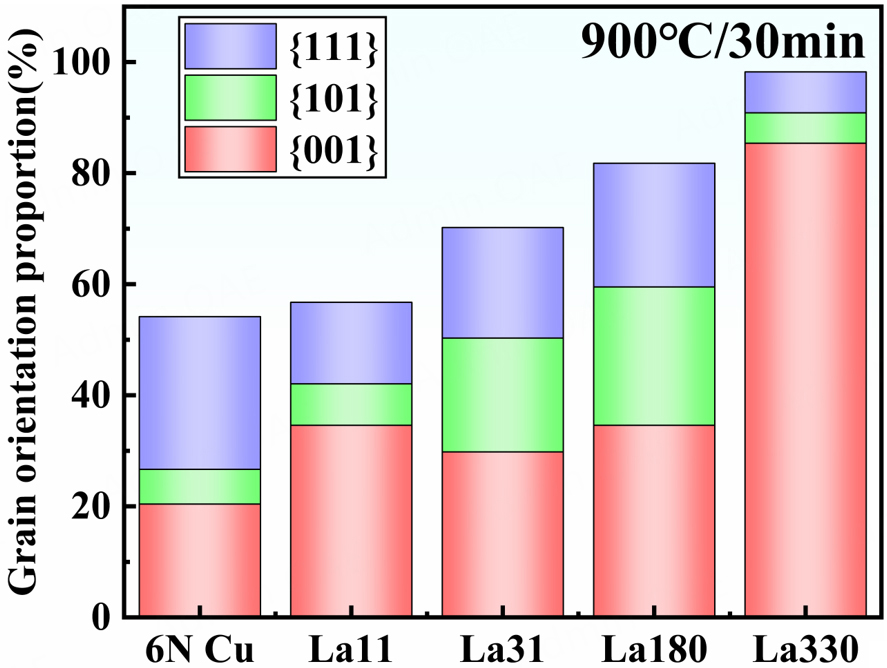
Figure 4. Fractional distribution of various grain orientations in OFC as a function of La content, following annealing at 900 °C for 30 min.
Texture evolution
Figure 5A-E presents the texture distribution maps and the corresponding statistical charts of texture component fractions for OFC with different La contents after 900 °C/30 min annealing. Figure 6A-E shows the ODF maps for OFC with different La contents, at φ2 sections of 0°, 25°, 45°, and 65°. Six common texture components in copper metals were statistically analyzed: Cube {001}<100>, Goss {011}<100>, Brass {011}<211>, Copper {112}<111>, S {123}<634>, and Brass Recrystallization {236}<385> (Brass Rec). As seen in Figure 5, the texture of 6N Cu and La11 is predominantly composed of Brass Rec. For La31, the texture components are roughly comparable, with Brass texture being more dominant and Goss texture less so. La180 is mainly characterized by S and Cube textures, while La330 exhibits a widespread Cube texture, with its fraction reaching as high as 85.1%. With increasing La content, the fraction of Brass Rec texture decreases significantly, while that of Cube texture increases markedly. Specifically, the Brass Rec fraction drops from 50.5% to 1.46%, and the Cube fraction increases from 2.83% to 85.1%. The ODF maps in Figure 6 also show a transition in the maximum texture intensity. The maximum intensity first weakens and then strengthens significantly, decreasing from 27.99 for 6N Cu to 8.47 for La31, and then increasing to 41.26 for La330. The texture evolves from a relatively strong Brass Rec in 6N Cu to an extremely strong Cube texture in La330. This indicates that the addition of rare earth La significantly promotes the transformation from Brass Rec to Cube texture in samples after 900 °C/30 min high-temperature annealing.
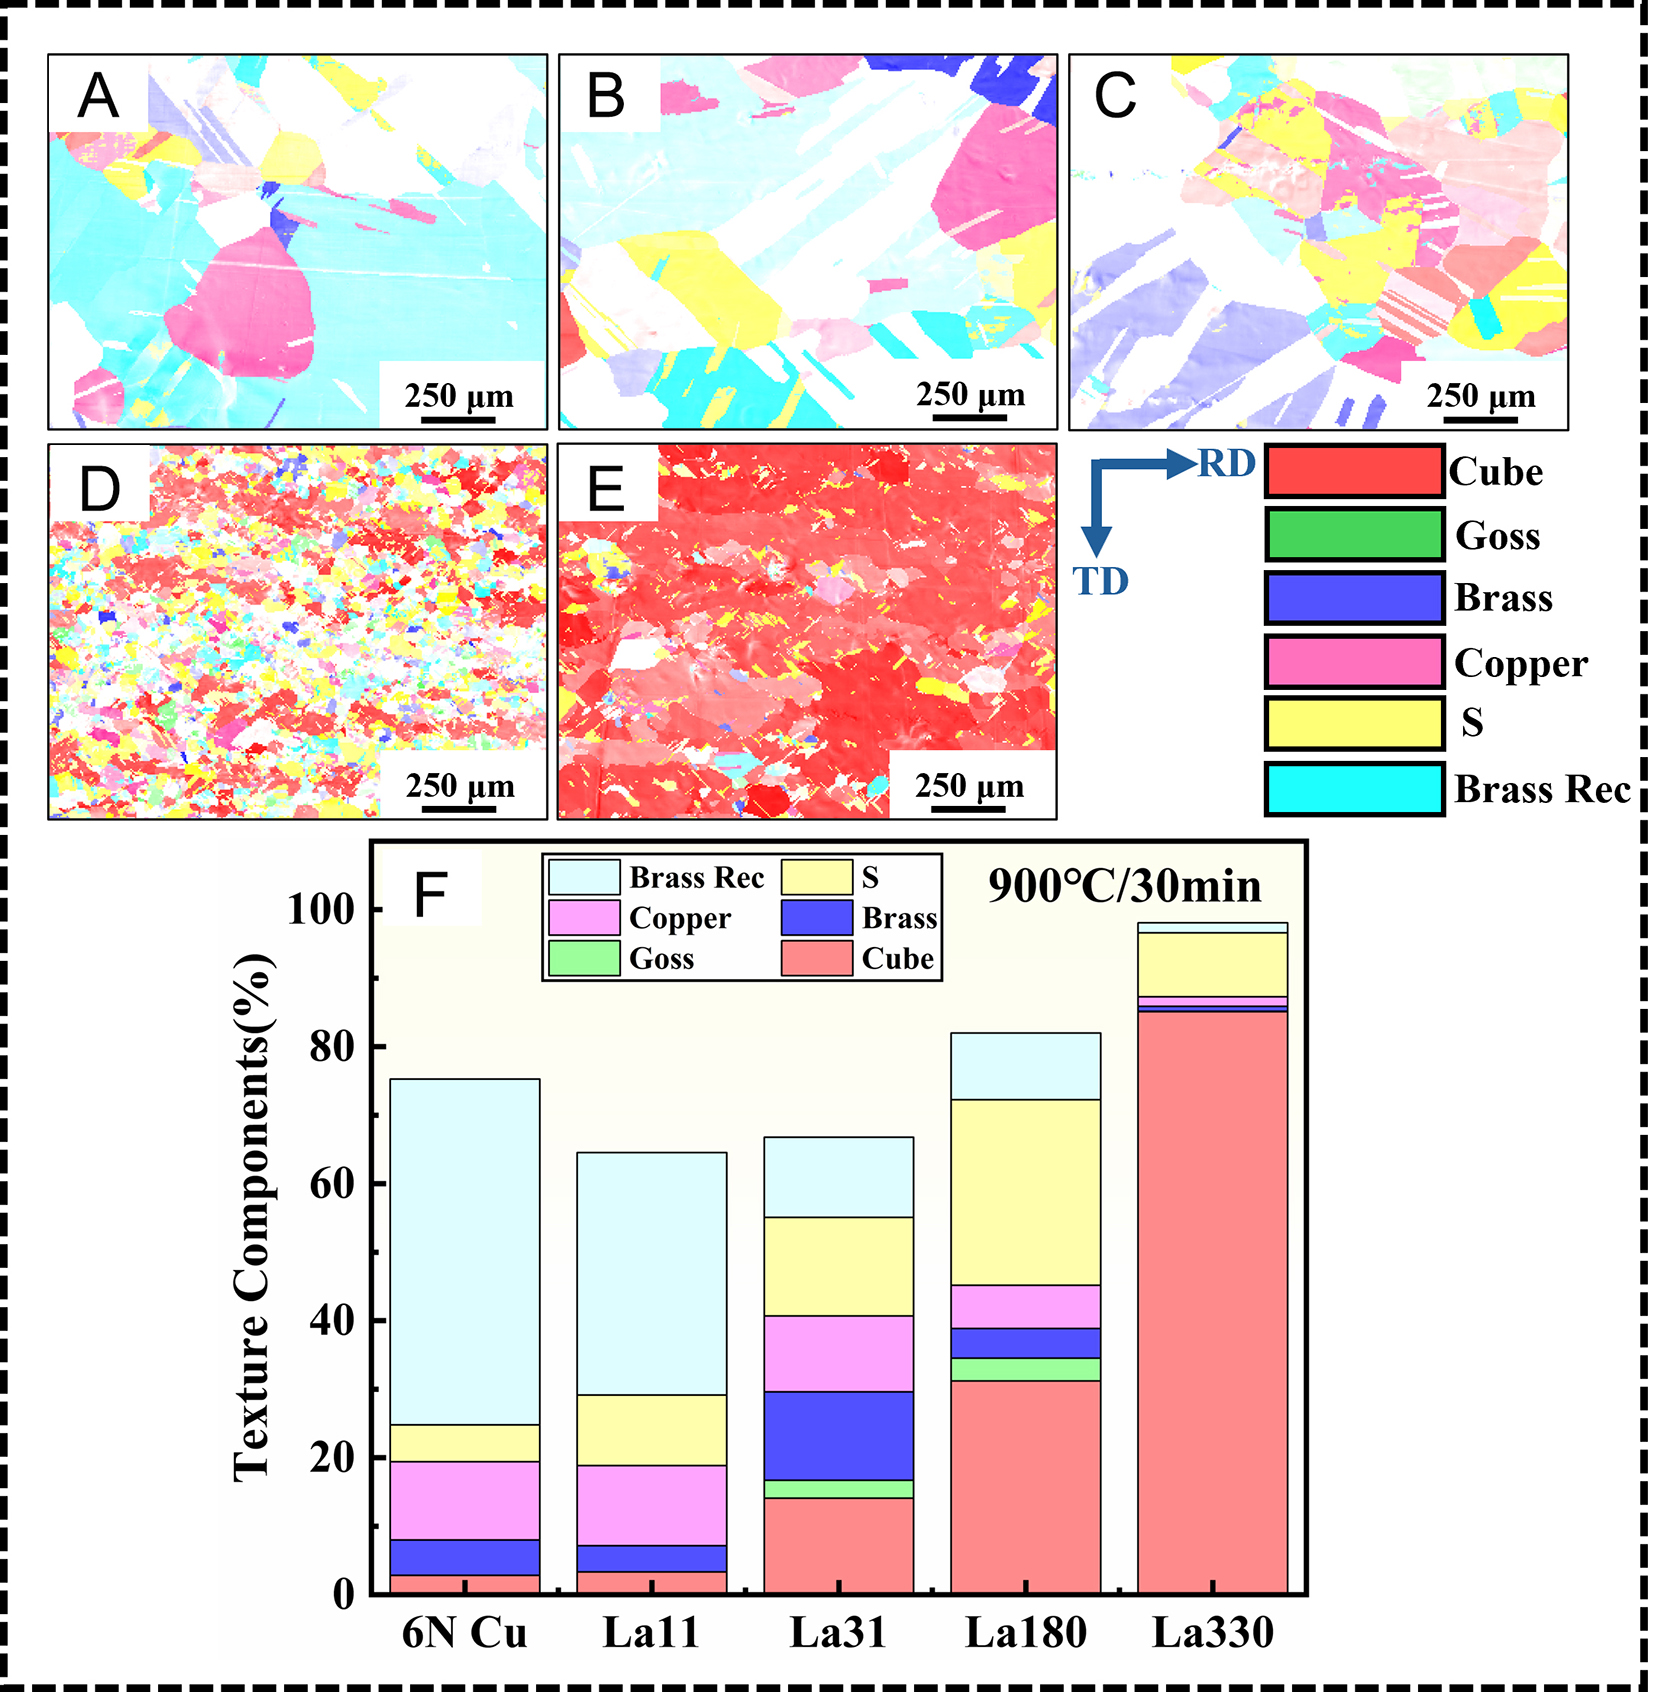
Figure 5. Texture distribution map and constituent texture components in OFC as a function of La content after annealing at 900 °C for
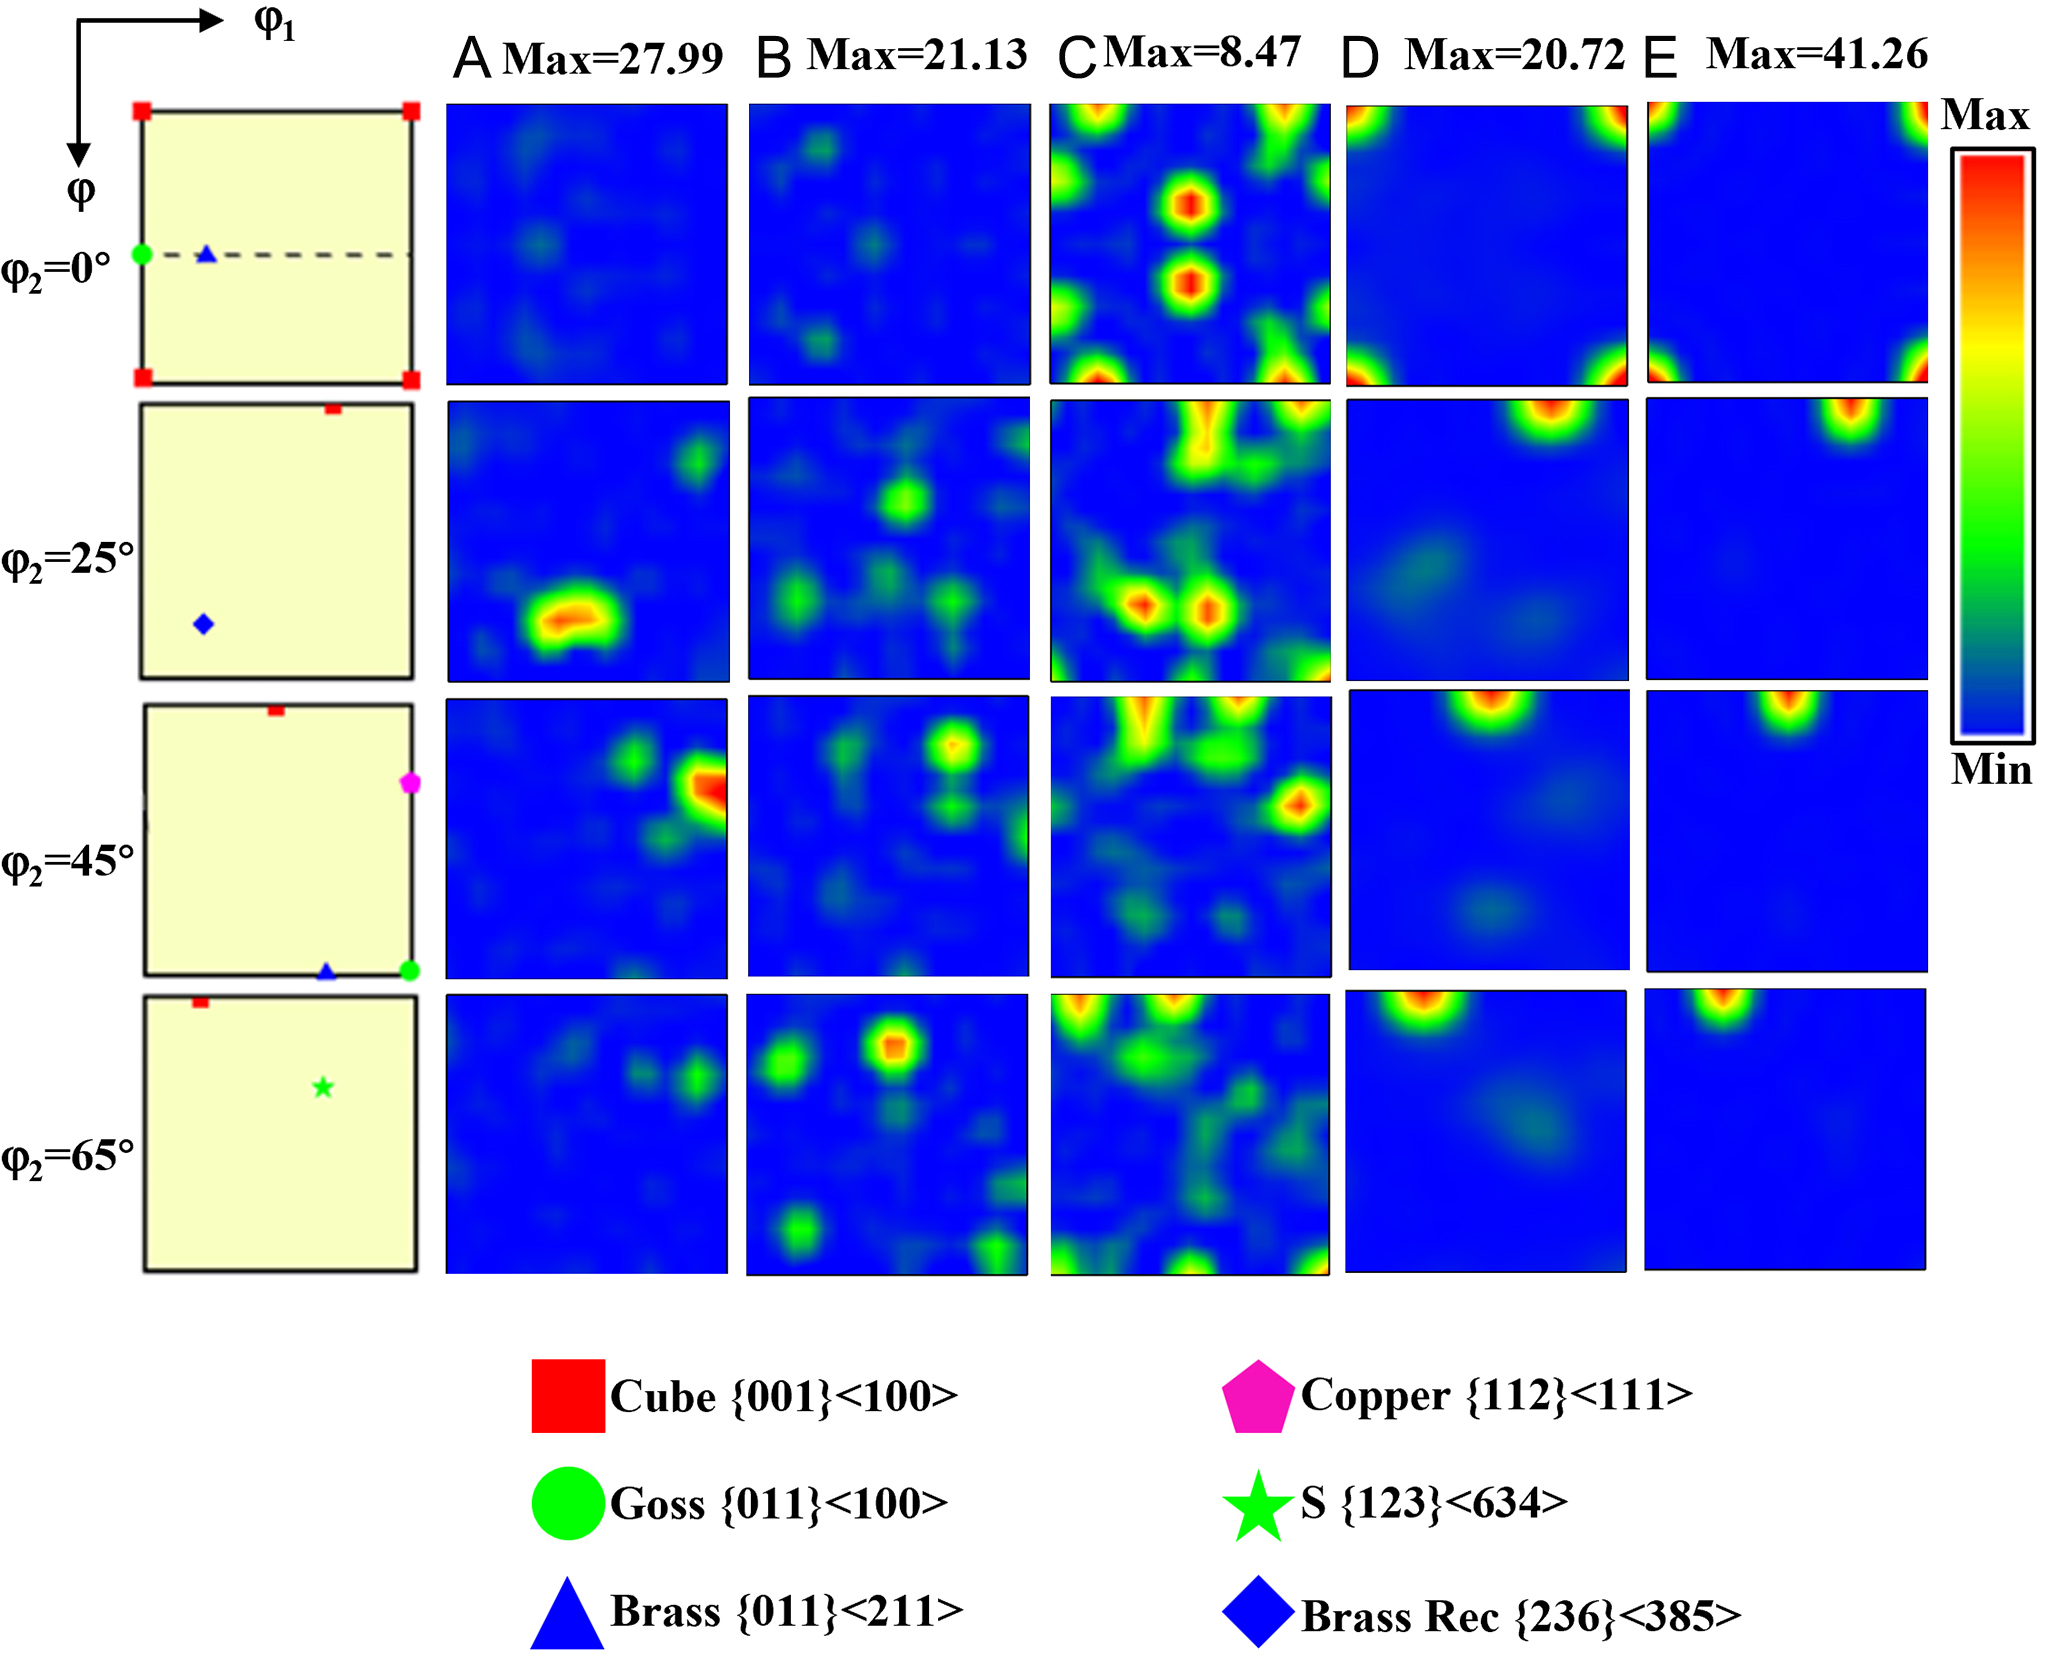
Figure 6. ODF sections of φ2 = 0°, φ2 = 25°, φ2 = 45° and φ2 = 65° of OFC with different La contents after annealing at 900 °C for
To further elucidate the influence of La on texture evolution in OFC, the major texture subsets and corresponding pole figures for OFC with variable La contents upon 900 °C/30 min annealing are presented in a correlated manner in Figure 7. It can be seen that the dominant texture in both 6N Cu and La11 is primarily the Brass Rec orientation, with very high intensities of 57.52 and 44.00, respectively. It is evident that the Brass Rec texture intensity in La11 shows a weakening trend compared to that in 6N Cu. For La31, the dominant texture type shifts, with Brass texture becoming predominant at an intensity of 39.12. For OFC with higher La content, namely La180 and La330, the dominant texture is primarily Cube. Their texture intensities are relatively close, at 51.91 and 49.44, respectively. Moreover, the Cube texture in La330 is more widespread. As also seen from the texture statistical chart in Figure 5F, the Cube texture fraction in La330 is 85.1%, representing a relative increase of 1.7 times (i.e., 170%) compared with the 31.2% in La180. Therefore, the addition of different amounts of La induces a transformation in the dominant texture of OFC after
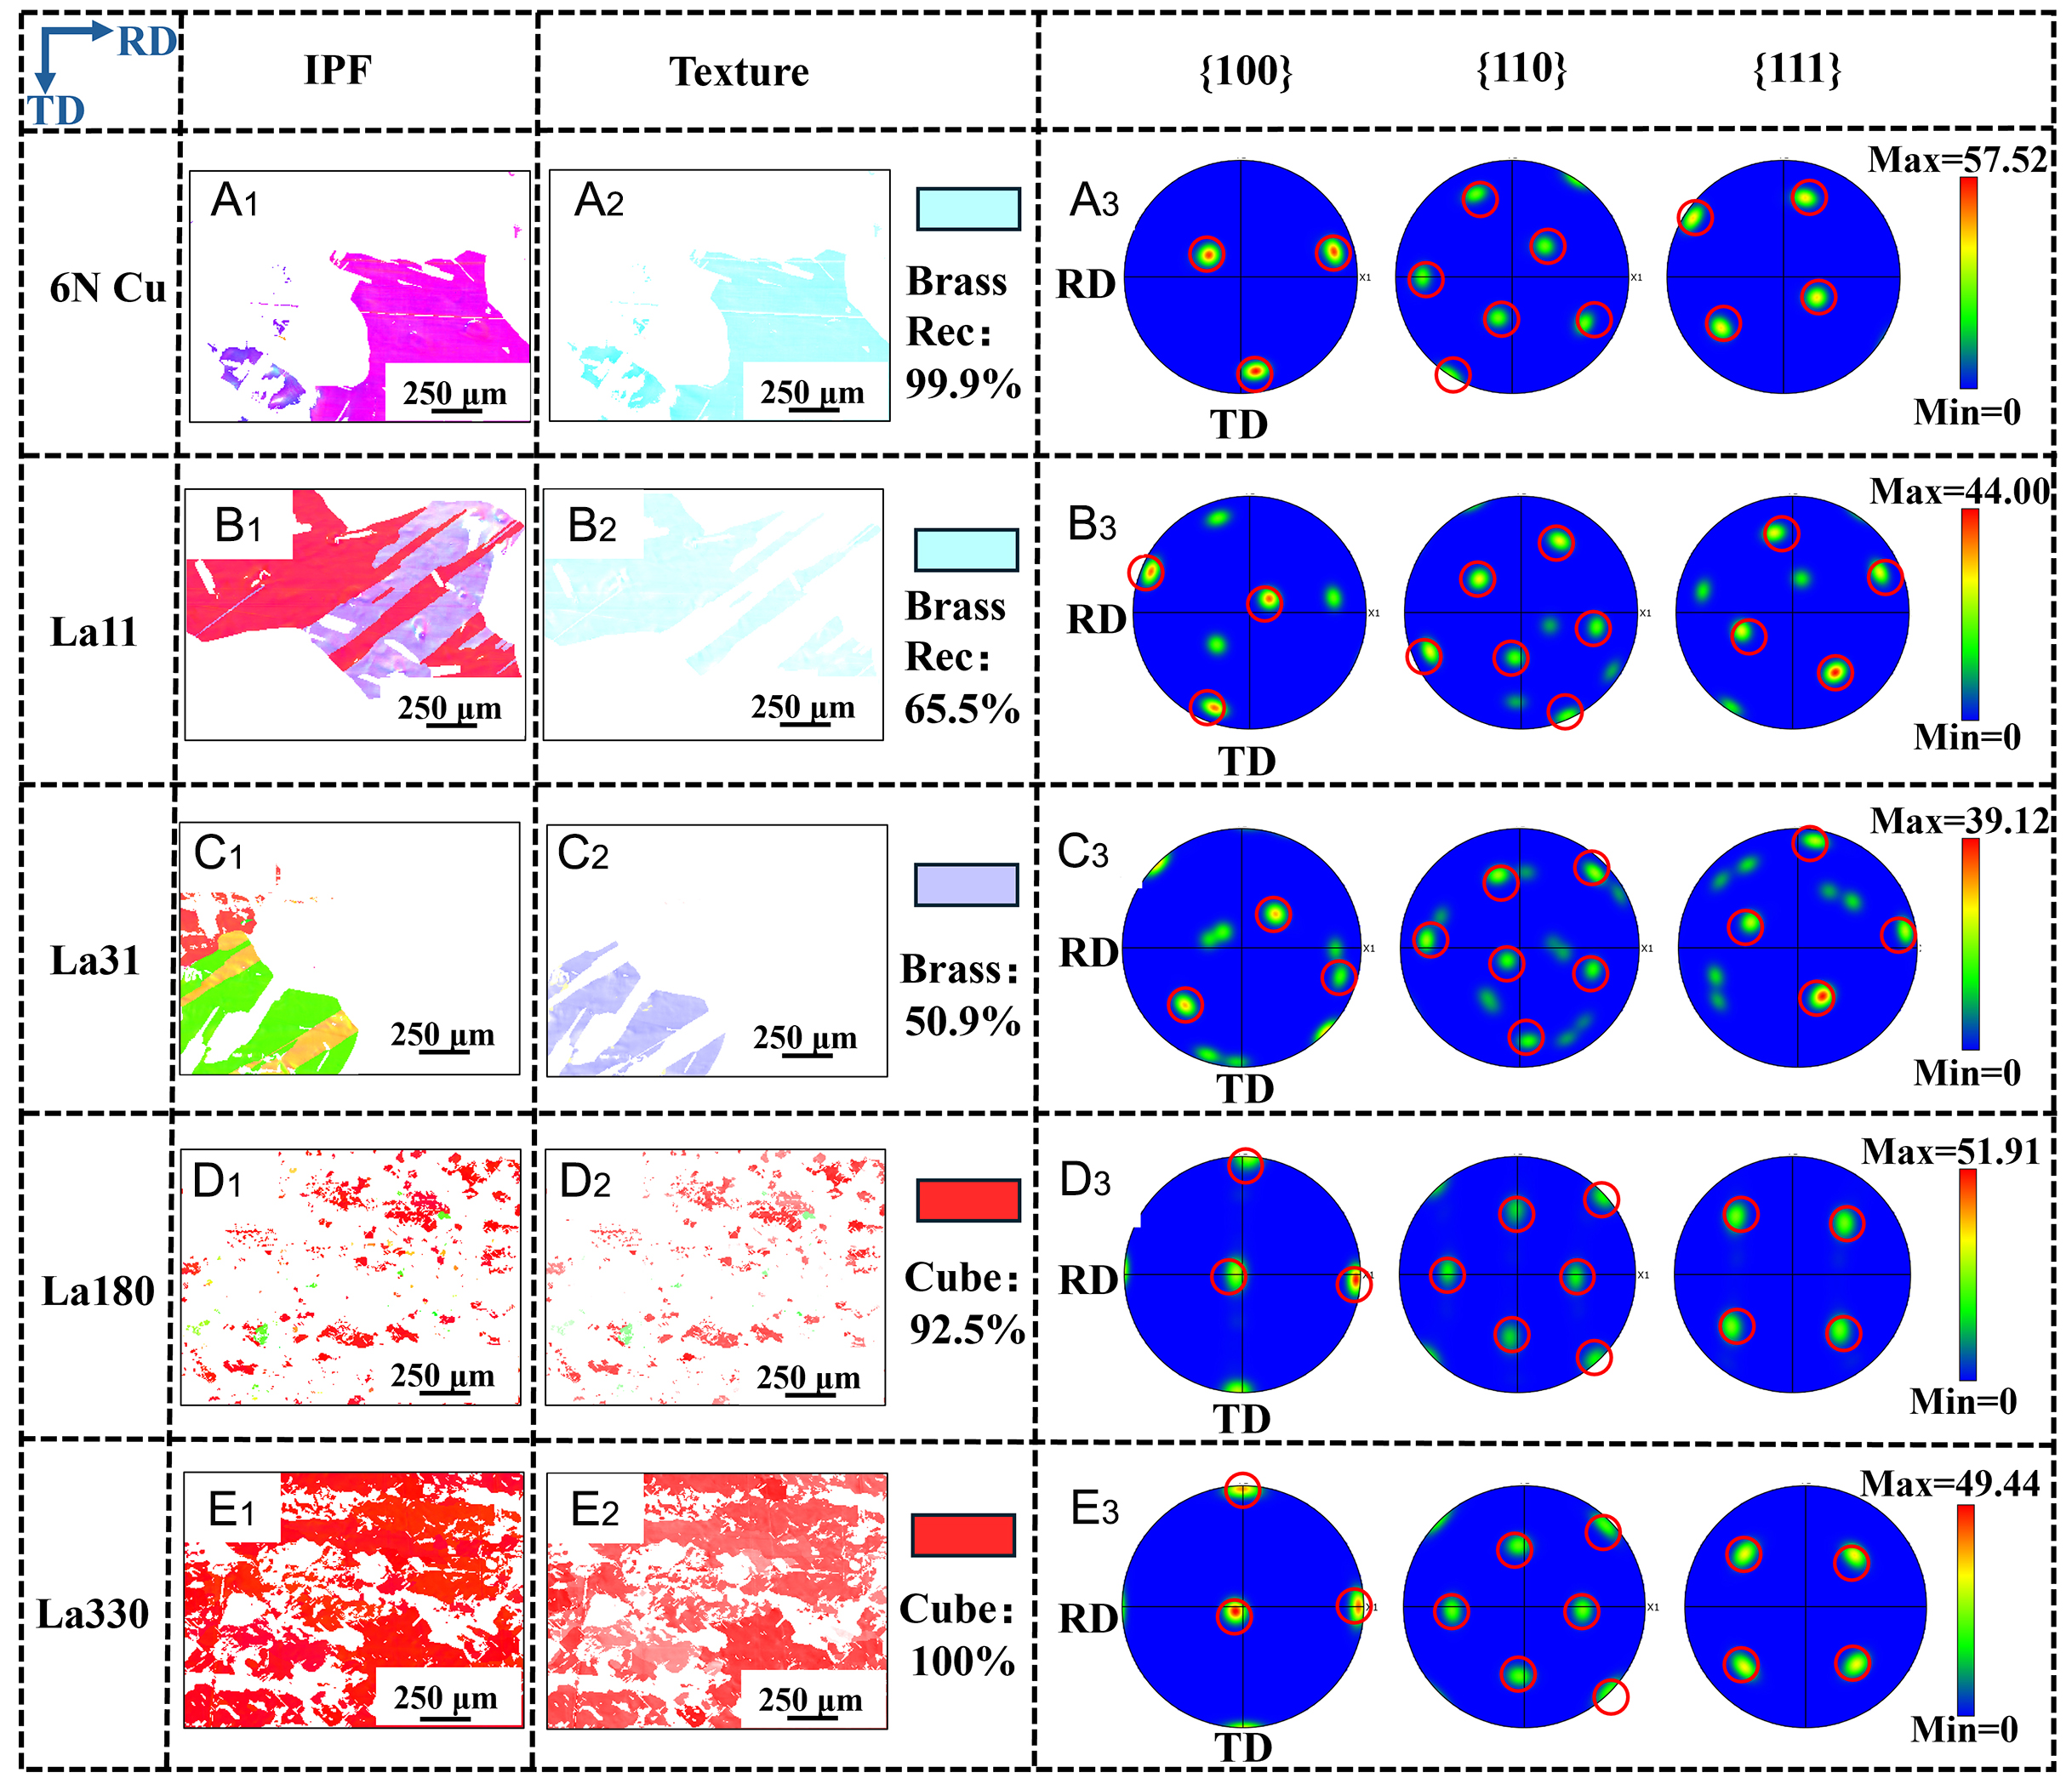
Figure 7. The IPF and texture maps of the pole figure and the corresponding regions of OFC with different La contents after annealing at 900 °C for 30 min: (A1-A3) 6N Cu, (B1-B3) La11, (C1-C3) La31, (D1-D3) La180, (E1-E3) La330.
In the La180 and La330 specimens, the high-volume fraction of Cube texture {001}<100> imparts a highly consistent crystallographic orientation to the grains, significantly reduces the strain anisotropy between adjacent grains, and suppresses the nucleation and growth of abnormally oriented grains, thereby improving the "orange-peel" defect (characterized by surface unevenness and roughness) caused by incompatible grain deformation. It should be noted that this improvement is not solely attributable to the texture orientation alone but is instead built upon the significant grain refinement induced by rare-earth La: the fine-grained structure ensures the cooperative deformation capability of the polycrystal under external stress, while the orientation uniformity further optimizes the homogeneity of surface strain distribution. Only through the synergistic action of these two factors can the orange-peel defect be completely eliminated during plastic deformation, resulting in excellent surface quality.
The synergistic effect of texture control and grain refinement described above has deeper engineering significance for the actual service performance of DBC substrates. First, with respect to thermal cycling reliability, DBC substrates endure repeated temperature changes during service. Owing to the significant coefficient of thermal expansion mismatch between the copper layer and the ceramic substrate (Al2O3 or Aluminum nitride (AlN)), thermal cycling generates repeated thermomechanical stress[8], leading to the initiation and propagation of fatigue cracks in the copper layer, and eventually causing delamination of the copper layer from the ceramic substrate[10]. La180 and La330, by promoting the formation of Cube texture, reduce the local stress concentration caused by grain boundary reconstruction during thermal cycling, thereby delaying the initiation of fatigue cracks. Second, regarding surface coating adhesion, the surface of the copper layer on DBC substrates typically requires metallization treatments such as nickel plating or gold plating, or connection to power chips via silver sintering technology[7]. The elimination of the orange-peel defect directly implies an improvement in the surface flatness of the copper layer[19], which is crucial for the uniform coverage and interface bonding quality of subsequent coatings. In addition, La180 and La330, by promoting the formation of Cube texture, endow the copper surface with a highly consistent crystallographic orientation, altering the crystallographic preferred orientation distribution as well as the associated surface energy and surface oxidation behavior, thereby providing a new material design approach for optimizing the metallization process on the copper surface of DBC substrates. Third, with regard to interfacial fracture resistance, interface failure in DBC substrates typically manifests as delamination or peeling between the copper layer and the ceramic substrate[9]. La180, by promoting the formation of Cube texture, imparts a highly consistent crystallographic orientation to the copper layer, significantly reducing the strain anisotropy between adjacent grains and improving the orange-peel defect, thereby lowering the stress peaks at the interface.
In summary, La180, through the synergistic mechanism of "Cube texture orientation consistency and fine-grained structure cooperative deformation", not only eliminates the "orange peel" defect and improves the surface quality of the copper layer, but also significantly enhances the overall service performance of DBC substrates from three dimensions—thermal cycling reliability, surface coating adhesion, and interfacial fracture resistance. This provides a new theoretical basis and engineering pathway for improving the long-term reliability of DBC substrates from the source of copper foil materials through rare-earth microalloying.
Electrical conductivity and hardness
Figure 8 shows the electrical conductivity and hardness of OFC with different La contents after annealing at 900 °C for 30 min. Error bars denote the standard deviation (SD) of the measurements. As the La content increases, the hardness increases gradually, rising from 55.6 to 67.9 HV. With increasing La addition, the electrical conductivity of OFC shows a trend of first decreasing rapidly and then gradually stabilizing. Conductivity decreases significantly from 104.2 %IACS for 6N Cu to 101.0 %IACS for La31. While, the La180 and La330 samples both maintain conductivity above 101.0 %IACS, at 101.3 %IACS, indicating that even with higher La additions, OFC can retain excellent high conductivity.
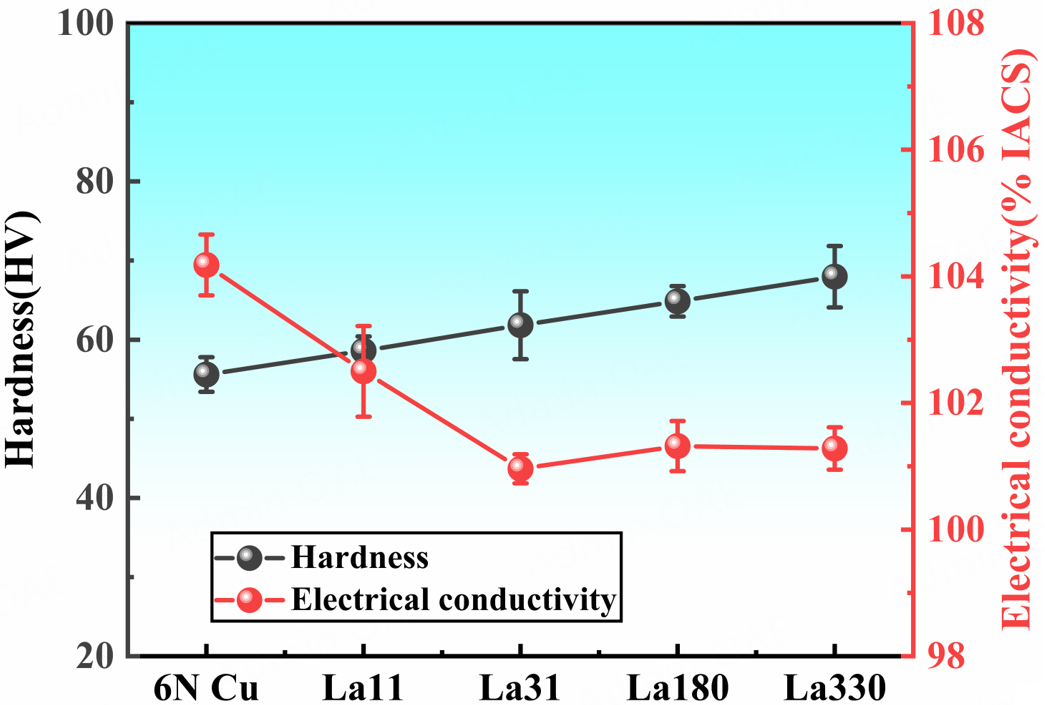
Figure 8. Results of electrical conductivity and hardness of OFC with different La contents after annealing at 900 °C for 30 min. Error bars denote the standard deviation (SD) of the measurements. For each sample, the conductivity is measured 5 times, and the average value is taken as the conductivity of the specimen measured.
These variations in hardness and conductivity are closely related to the solid solubility of La in OFC, the characteristics of second-phase precipitation, and their influence on grain size and dislocation motion[32]. The solid solubility of rare earth La in OFC is extremely limited, with virtually no solid solution. Except at very low concentrations where La atoms dissolve into the copper lattice via substitution or interstitial mechanisms, the large atomic radius mismatch between La and Cu causes severe lattice distortion[30,33]. This has minimal influence on grain size, as shown in Figure 2B1 and C1. Under this condition, electrical conductivity decreases substantially, while hardness increases slightly due to solid solution strengthening, albeit to a limited extent. This corresponds to the conductivity and hardness trends observed for La11 and La31 in Figure 8. As La content increases, La exists as second-phase particles at grain boundaries and within grains. These La-rich particles are hard, incoherent with the matrix, and relatively large in size[29]. Dislocations moving through the matrix are "pinned" upon encountering these particles, forced to bend and bypass them—a classic dislocation bypass mechanism (Orowan mechanism)[34-36]. Furthermore, grain refinement becomes highly pronounced, as shown in Figure 2D1 and E1. This regime increases hardness but further degrades conductivity. However, because solute atoms precipitate from the copper matrix, thereby generating second-phase particles, scattering of electrons by solute atoms is greatly reduced. Additionally, La forms compounds with impurity elements such as O, P, and S, purifying the copper matrix. This allows conductivity to recover significantly, resulting in the noticeably slowed decline in conductivity from La31 to La330. The influence of La on the hardness and conductivity of OFC is highly dependent on its specific existing form within the copper. Different forms contribute to strengthening mechanisms with markedly varying effectiveness. To investigate and analyze this more deeply, we will employ TEM in the following Section "TEM analysis" to specifically analyze the form of La in OFC after high-temperature annealing, aiming to provide an experimental basis for subsequent optimization of composition design and conductivity regulation in rare-earth-modified OFC.
Effect of trace La on the softening temperature of OFC
Variation in softening temperature
The softening temperature is a fundamental concept in materials science. It describes the temperature range or characteristic temperature point at which a material undergoes a significant and permanent decline in its macroscopic mechanical properties (particularly hardness) during heating[37]. In simple terms, the softening temperature signifies the temperature threshold at which a material permanently transitions from a "hard and strong" worked or high-strength state back to a "soft and ductile" annealed state. Figure 9 presents the annealing softening characteristic curves of OFC with different La contents. Error bars denote the SD of the measurements. The softening temperature is operationally defined here as the annealing temperature at which the hardness of a copper or copper alloy material drops to 80% of its original value after isothermal holding for 1 h, followed by natural cooling to room temperature. The temperatures at which the hardness of each sample dropped to 80% of its original value have been marked in Figure 9. In this test, the annealing temperatures ranged from 100 to 400 °C in 50 °C intervals. After natural cooling to room temperature, the Vickers hardness was measured. The initial reference hardness was the Vickers hardness measured at 25 °C. The 6N Cu has a softening temperature of 157 °C. La11 lowers the softening temperature to 121 °C, while La31, La180, and La330 increase it. Among these, La180 shows the greatest increase, raising the softening temperature by 53 °C. This indicates that a higher La content raises the softening temperature of OFC, thereby enhancing its resistance to softening at elevated temperatures. To delve deeper into the intrinsic mechanisms underlying the decrease in softening temperature for La11 and the increase for La31, La180 and La330, this study selected samples subjected to a softening treatment at 150 °C for 1 h for EBSD characterization and analysis.
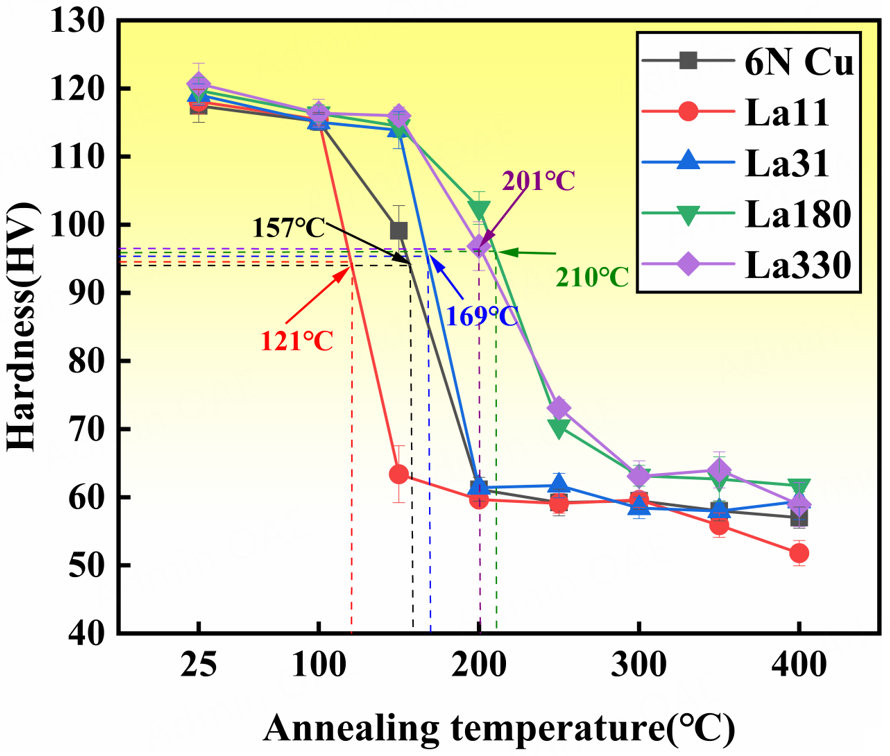
Figure 9. Annealing softening characteristic curves of OFC with different La contents. Error bars denote the SD of the measurements.
Microstructure after softening treatment at 150 °C for 1 h
The relationship between the softening temperature and recrystallization is direct and intimate: recrystallization is the core microscopic mechanism responsible for macroscopic softening, while the softening temperature typically serves as the macroscopic manifestation of the onset of recrystallization. For the vast majority of metals that have undergone cold deformation (e.g., rolling, drawing), the softening temperature is predominantly governed by the recrystallization process[38,39].
Figure 10 presents the EBSD characterization data of different samples after the 150 °C × 1 h softening treatment. Figure 11 shows (A) the recrystallized fraction statistics chart and (B) the misorientation distributions map derived from the data in Figure 10. Boundaries with misorientation angles between 2° and 15° are defined as LAGBs and are depicted by green lines in the maps. Boundaries with angles greater than 15° are defined as HAGBs, shown by black lines. Σ3 twin boundaries are indicated by red lines.
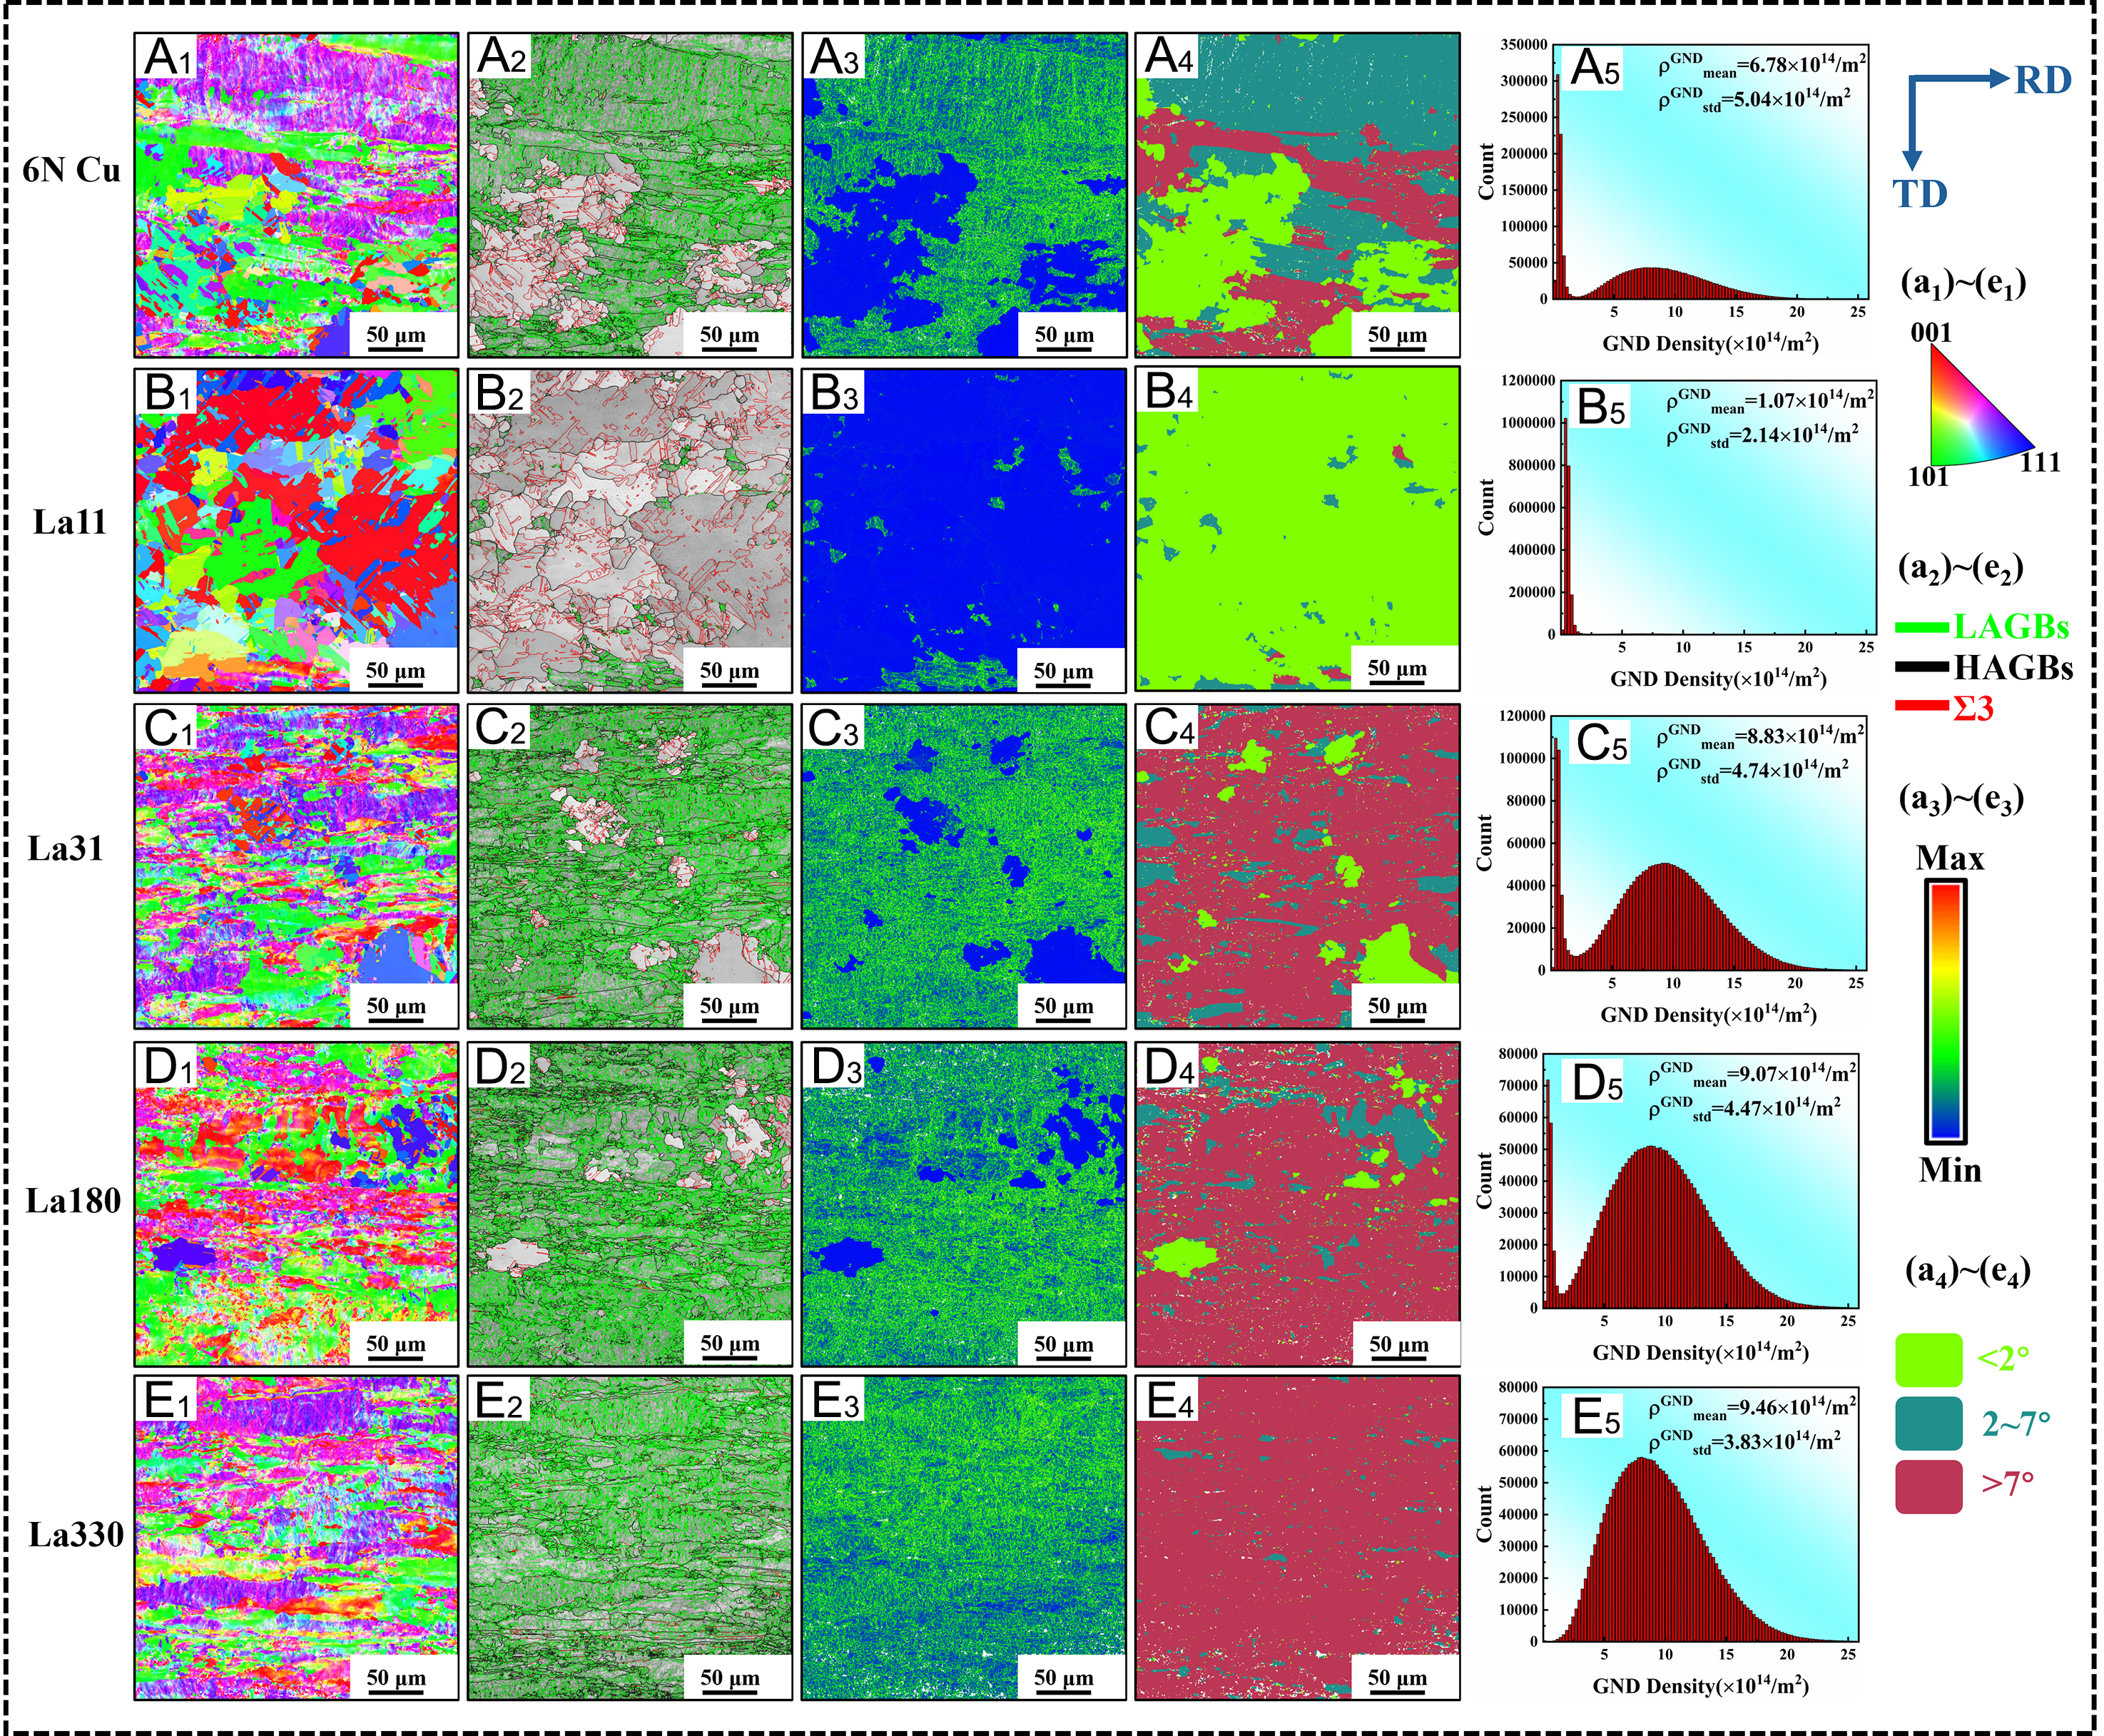
Figure 10. 6N Cu, La11, La31, La180, La330 after softening annealing at 150 °C for 1 h: (A1-E1) IPF map, (A2-E2) GB map, (A3-E3) KAM map, (A4-E4) GOS map (A5-E5) GND density.
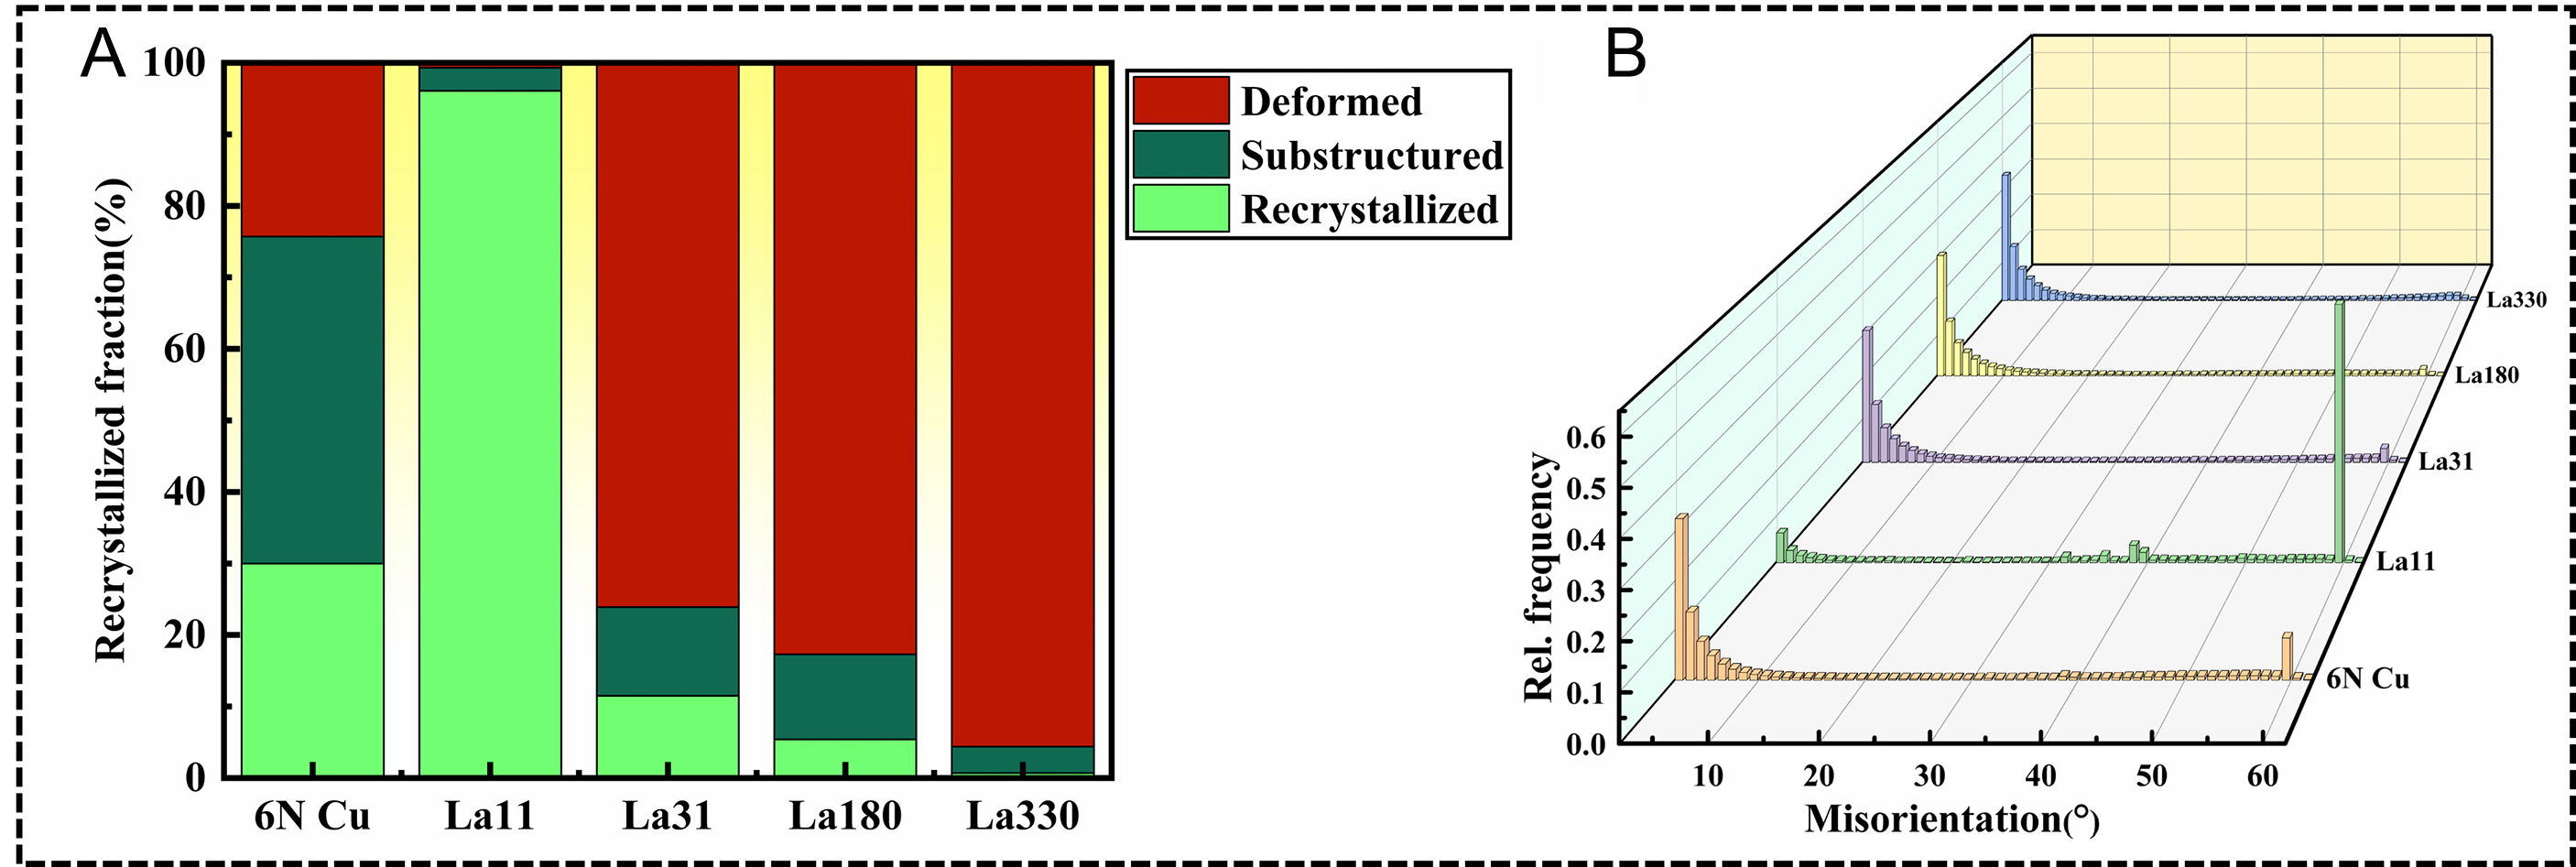
Figure 11. Recrystallized fraction statistics chart (A) and misorientation distributions map (B) from Figure 10.
KAM map, by quantitatively characterizing local misorientations, can directly reflect the distribution of microscopic strain and the characteristics of dislocation configurations within a material. As a key characterization technique linking bulk mechanical behavior to micro-scale deformation modes, KAM technology holds significant application value in dynamically tracking the recrystallization progress. The magnitude of the local misorientation is positively correlated with the degree of microscopic strain in that region, and the strain state directly determines the distribution characteristics of internal stresses. When collecting and calculating KAM map data, the maximum angle is set to 5°, and the kernel size is 3 × 3 pixels. The misorientation between any given point and its neighboring points can be quantitatively calculated according to[40,41]:
In this equation, α = 5° indicates that misorientations exceeding 5° are excluded, θ0 represents the local misorientation at the point, θi denotes the misorientation between this point and its neighboring points, and I is an indicator function. Subsequently, the formula for GND density can be simply derived based on the theoretical method of strain gradient[42,43]:
Here, ρGND is the GND density at the corresponding point, μ is the EBSD scan step size (0.2 μm), and b is the Burgers vector = 0.5<110>. ρGNDmean is the average GND density, and ρGNDstd is the SD of the GND density. The calculation results are shown in Figure 10A5-E5.
GOS map achieves precise characterization of the degree of material recrystallization by quantitatively analyzing the orientation heterogeneity within individual grains[44]. Essentially, the GOS value quantifies the average misorientation angle between the local crystallographic orientations of points within a grain and the grain's mean orientation. Based on the experimental system and characterization requirements of this study, the microstructural states corresponding to different GOS ranges are defined as follows: a GOS value in the range of 0°-2° corresponds to a recrystallized grain, a GOS value between 2°-7° corresponds to a subgrain, and a GOS value greater than 7° corresponds to deformed microstructure.
From Figure 10A1-E1 and A2-E2, and Figure 11B, it can be seen that after the 150 °C for 1 h softening treatment, the microstructure of various specimens mainly exhibits a fibrous structure aligned along the RD from cold rolling, primarily composed of LAGBs, with a majority of grain orientations being {101}. In contrast, La11 displays a coarse equiaxed grain structure formed after annealing, consisting largely of HAGBs and Σ3 twins, with a low content of deformed microstructure. The grain orientations in La11 are mainly {001} and {101}. In the KAM maps of Figure 10A3-E3, the green regions indicate the presence of significant local strain concentration and a high crystallographic orientation gradient. The blue regions correspond to areas with smaller local strain, relatively intact crystal structure, and insignificant orientation variation. From Figure 10A3-E3 and A5-E5, it can be observed that due to the higher content of deformed microstructure, stress concentration is pronounced in 6N Cu, La31, La180, and La330, with a more widespread dislocation distribution. Their mean GND density (ρGNDmean) is far greater than that of La11. This indicates that the recrystallization degree of La11 is substantially different from that of the other four samples. From
The reason why a higher content of rare earth La can increase the softening temperature of OFC is that when the La content exceeds its extremely low solid solubility in copper, La reacts with copper to form fine nanoscale intermetallic particles (e.g., Cu6La). These particles exert a powerful "pinning effect": they act like "anchors," firmly gripping grain boundaries and dislocations. During annealing, for grain boundaries to migrate and dislocations to rearrange (i.e., for recrystallization to occur), they must overcome the constraints imposed by these pinning particles, which require higher thermal energy. Consequently, recrystallization is significantly delayed, leading to a substantial increase in the softening temperature. However, in La330, severe enlargement of the Cu6La secondary phase leads to a reduction in pinning force, making dislocation elimination and grain boundary movement more readily take place. This results in reduced efficiency in restraining the recrystallization evolution[33,50], ultimately causing its softening temperature to be lower than that of La180.
Texture evolution
Due to the varying degrees of recrystallization in the five OFC alloys with different La contents after the
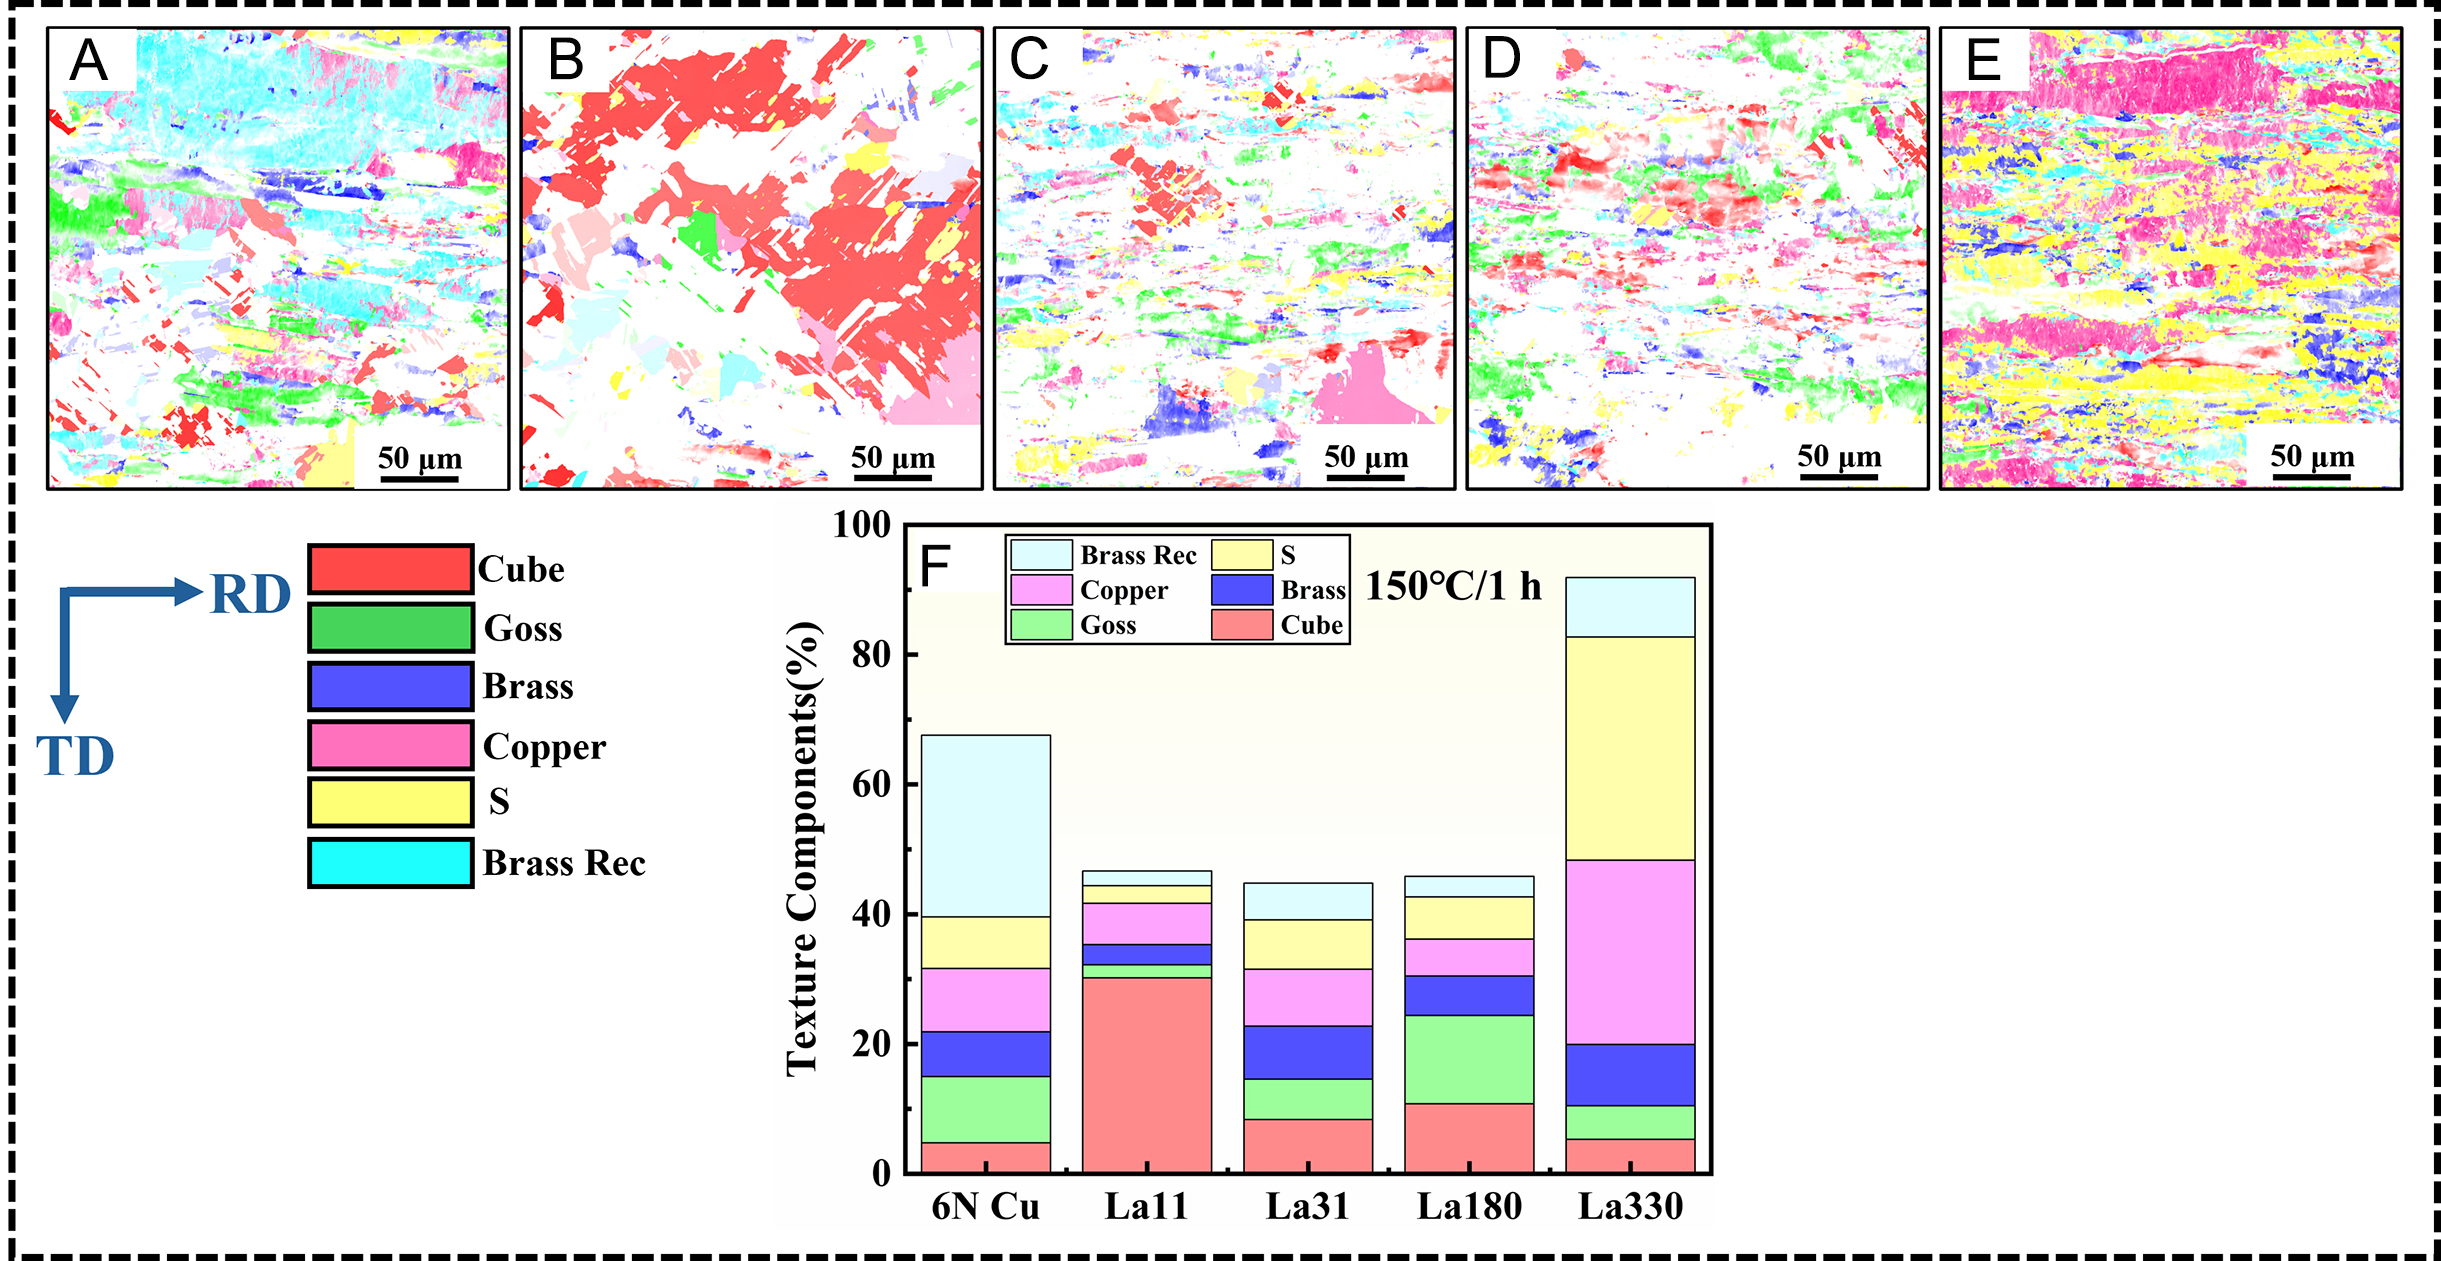
Figure 12. Texture distribution map and texture components after softening annealing at 150 °C for 1 h: (A) 6N Cu, (B) La11, (C) La31, (D) La180, (E) La330, (F) Texture components diagram of the different samples.
TEM analysis
To investigate the mechanisms by which rare earth La affects grain size, microstructure, and properties of OFC, and to clarify the existing forms of trace La in OFC, TEM was used to characterize La180 and La330 samples after annealing at 900 °C for 30 min. Figure 13 shows TEM micrographs of La180 after annealing at 900 °C for 30 min. As seen in Figure 13A and B, D-F, coarse annealing twins formed after high-temperature annealing, with twin widths reaching the micrometer scale. The formation of twins helps reduce intragranular dislocation density and minimizes electron scattering, thereby enhancing the electrical conductivity of OFC[51]. Figure 14 presents TEM images of intragranular second phases in La180 after 900 °C annealing for 30 min. From Figure 14A-D, it can be seen that the grain interiors are enriched with micrometer-sized La-rich oxide compounds. The EDS mapping results are shown in Figure 14B-D. Selected area electron diffraction (SAED) pattern from Area 1 was indexed, confirming the phase as La2O3; La2O3 has lattice parameters of a = 3.94 Å, b = 3.94 Å, c = 6.13 Å, belonging to the hexagonal crystal system with a simple lattice. Figure 14G shows that the La2O3 within Area 2 has a definite orientation relationship with the copper matrix, specifically [1 1 1]Cu∥[0 0 1]La2O3. From the high-resolution transmission electron microscopy (HRTEM) characterizations in Figure 14H and I, the interplanar spacing of Cu was measured as dα = 1.294 Å, and that of La2O3 as dβ = 1.980 Å. The diffraction spots from FFT 1 (La2O3) and FFT 2 (Cu) in Figure 14H are indexed in Figure 14J and K, respectively. The lattice mismatch δ can be calculated according to[52-54]
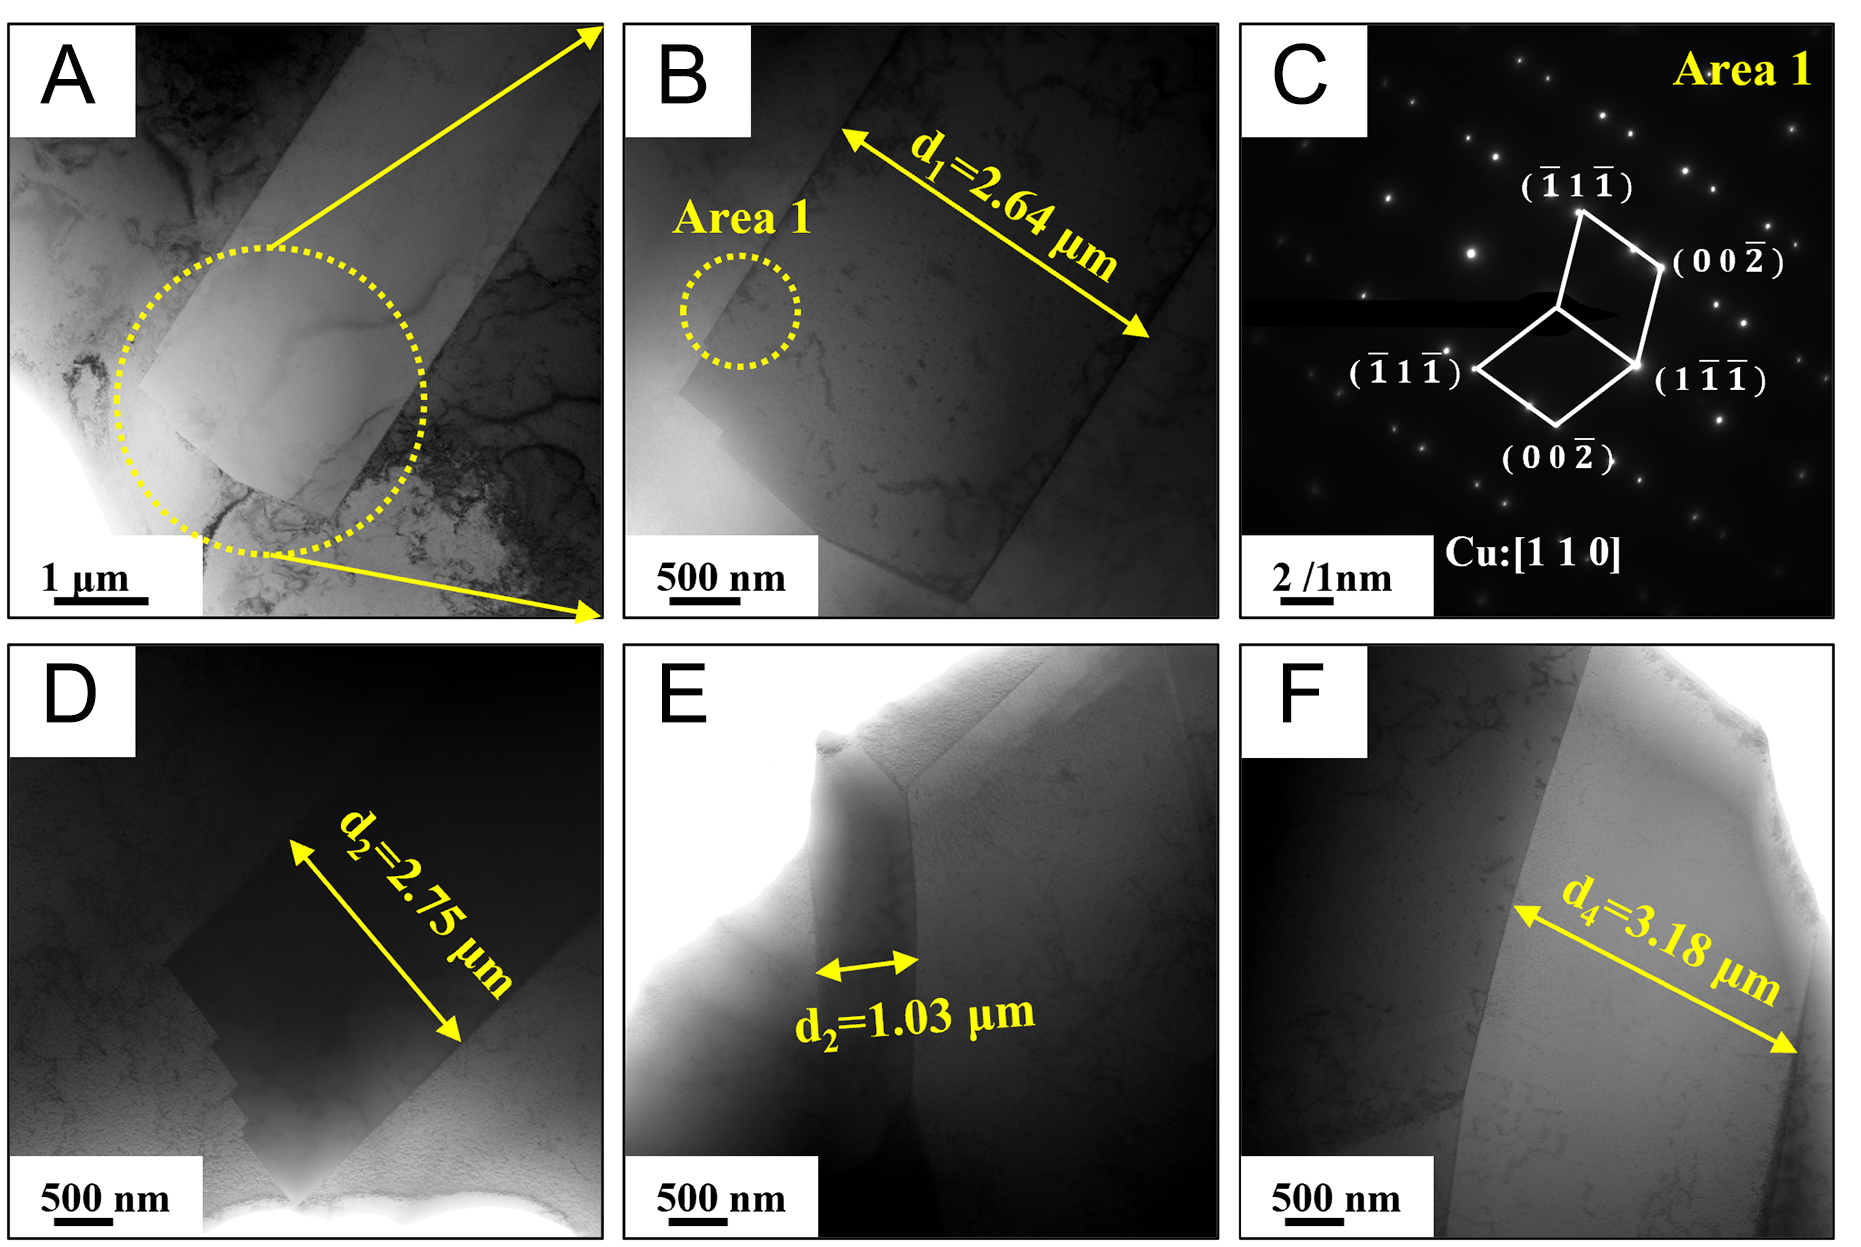
Figure 13. The TEM characterization results of La180 after annealing at 900 °C for 30 min: (A and B) and (D-F)Twins, (C) electron diffraction pattern of (B).
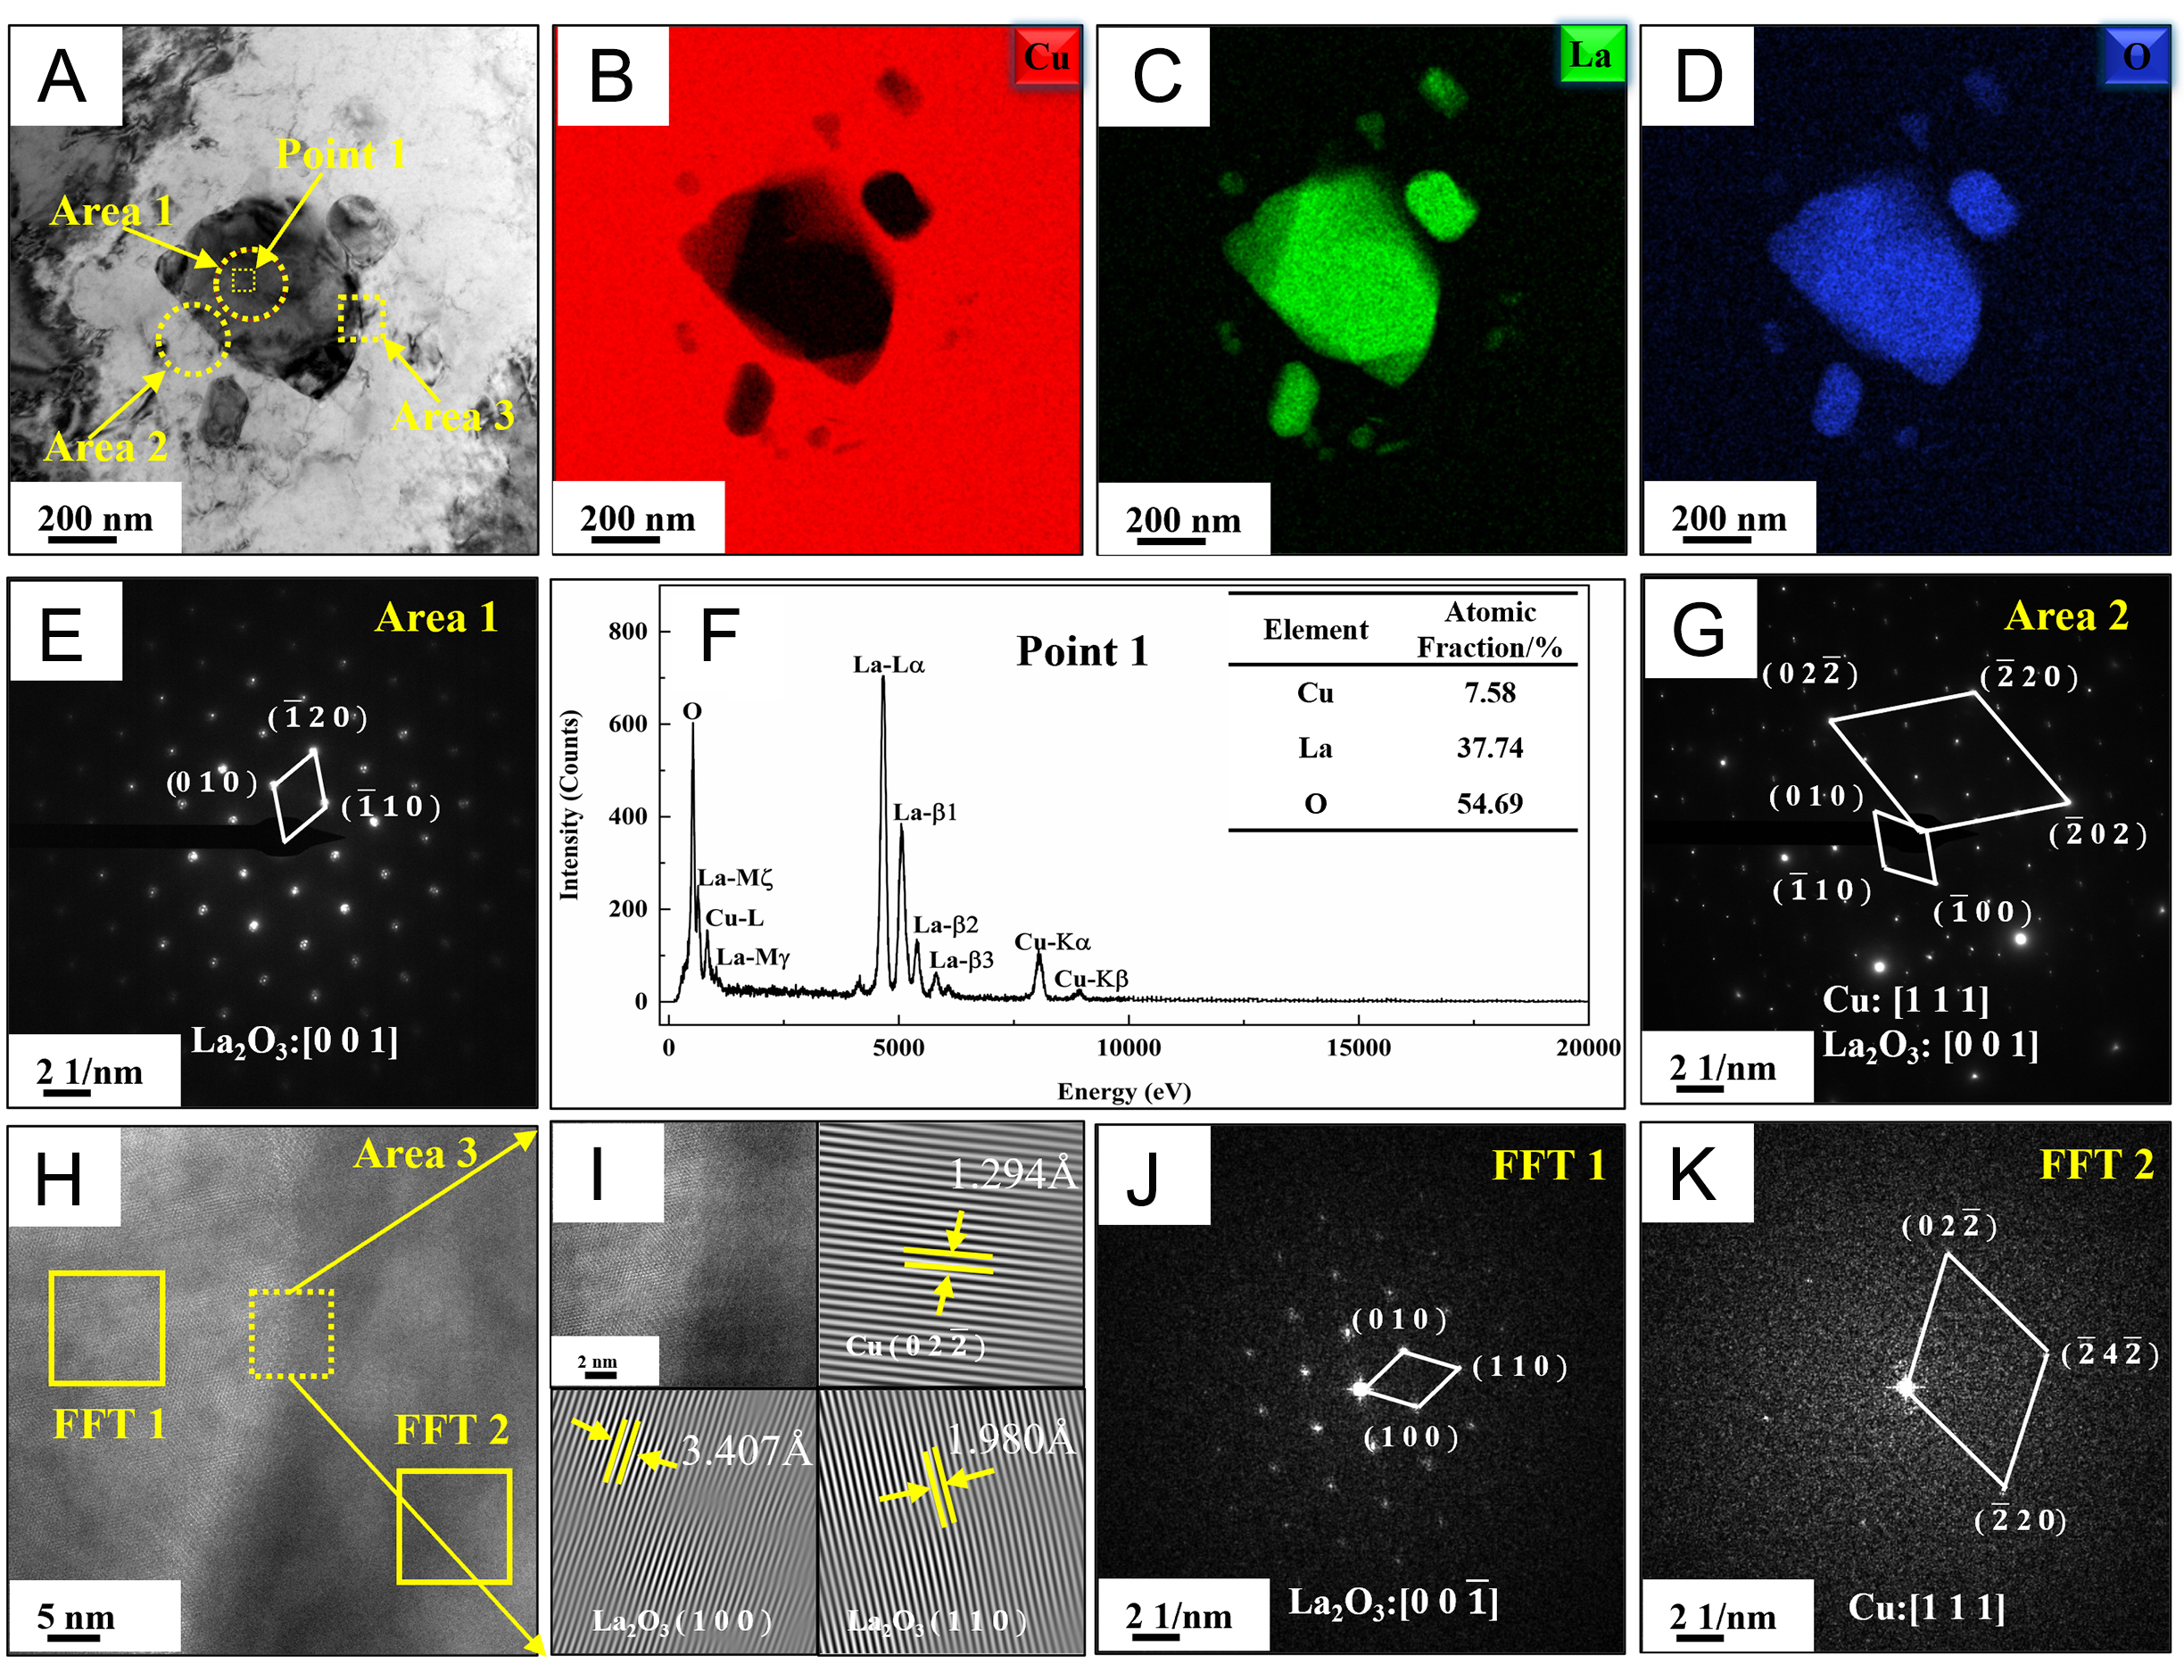
Figure 14. The TEM characterization of second phase in La180 after annealing at 900 °C for 30 min: (A) TEM bright-field images of second phase in La180, (B-D) EDS elemental map in (A), (E) electron diffraction pattern of La2O3 of Area 1, (F) Spectra from Point 1, (G) electron diffraction pattern of Area 2, (H) HRTEM images of Area 3, (I) enlarged image of the HRTEM image of (H) and the inverse Fast Fourier Transform (IFFT) lattice stripes, (J) FFT 1 in (H), (K) FFT 2 in (H).
thus establishing the correlation between the secondary phase and the matrix. When δ < 0.05, the interfacial relationship between the second phase and the matrix is coherent, when 0.05 < δ < 0.25, it is semi-coherent, and when δ > 0.25, it is incoherent.
Figure 15 presents the TEM characterization of grain boundary segregation in La180 after annealing at
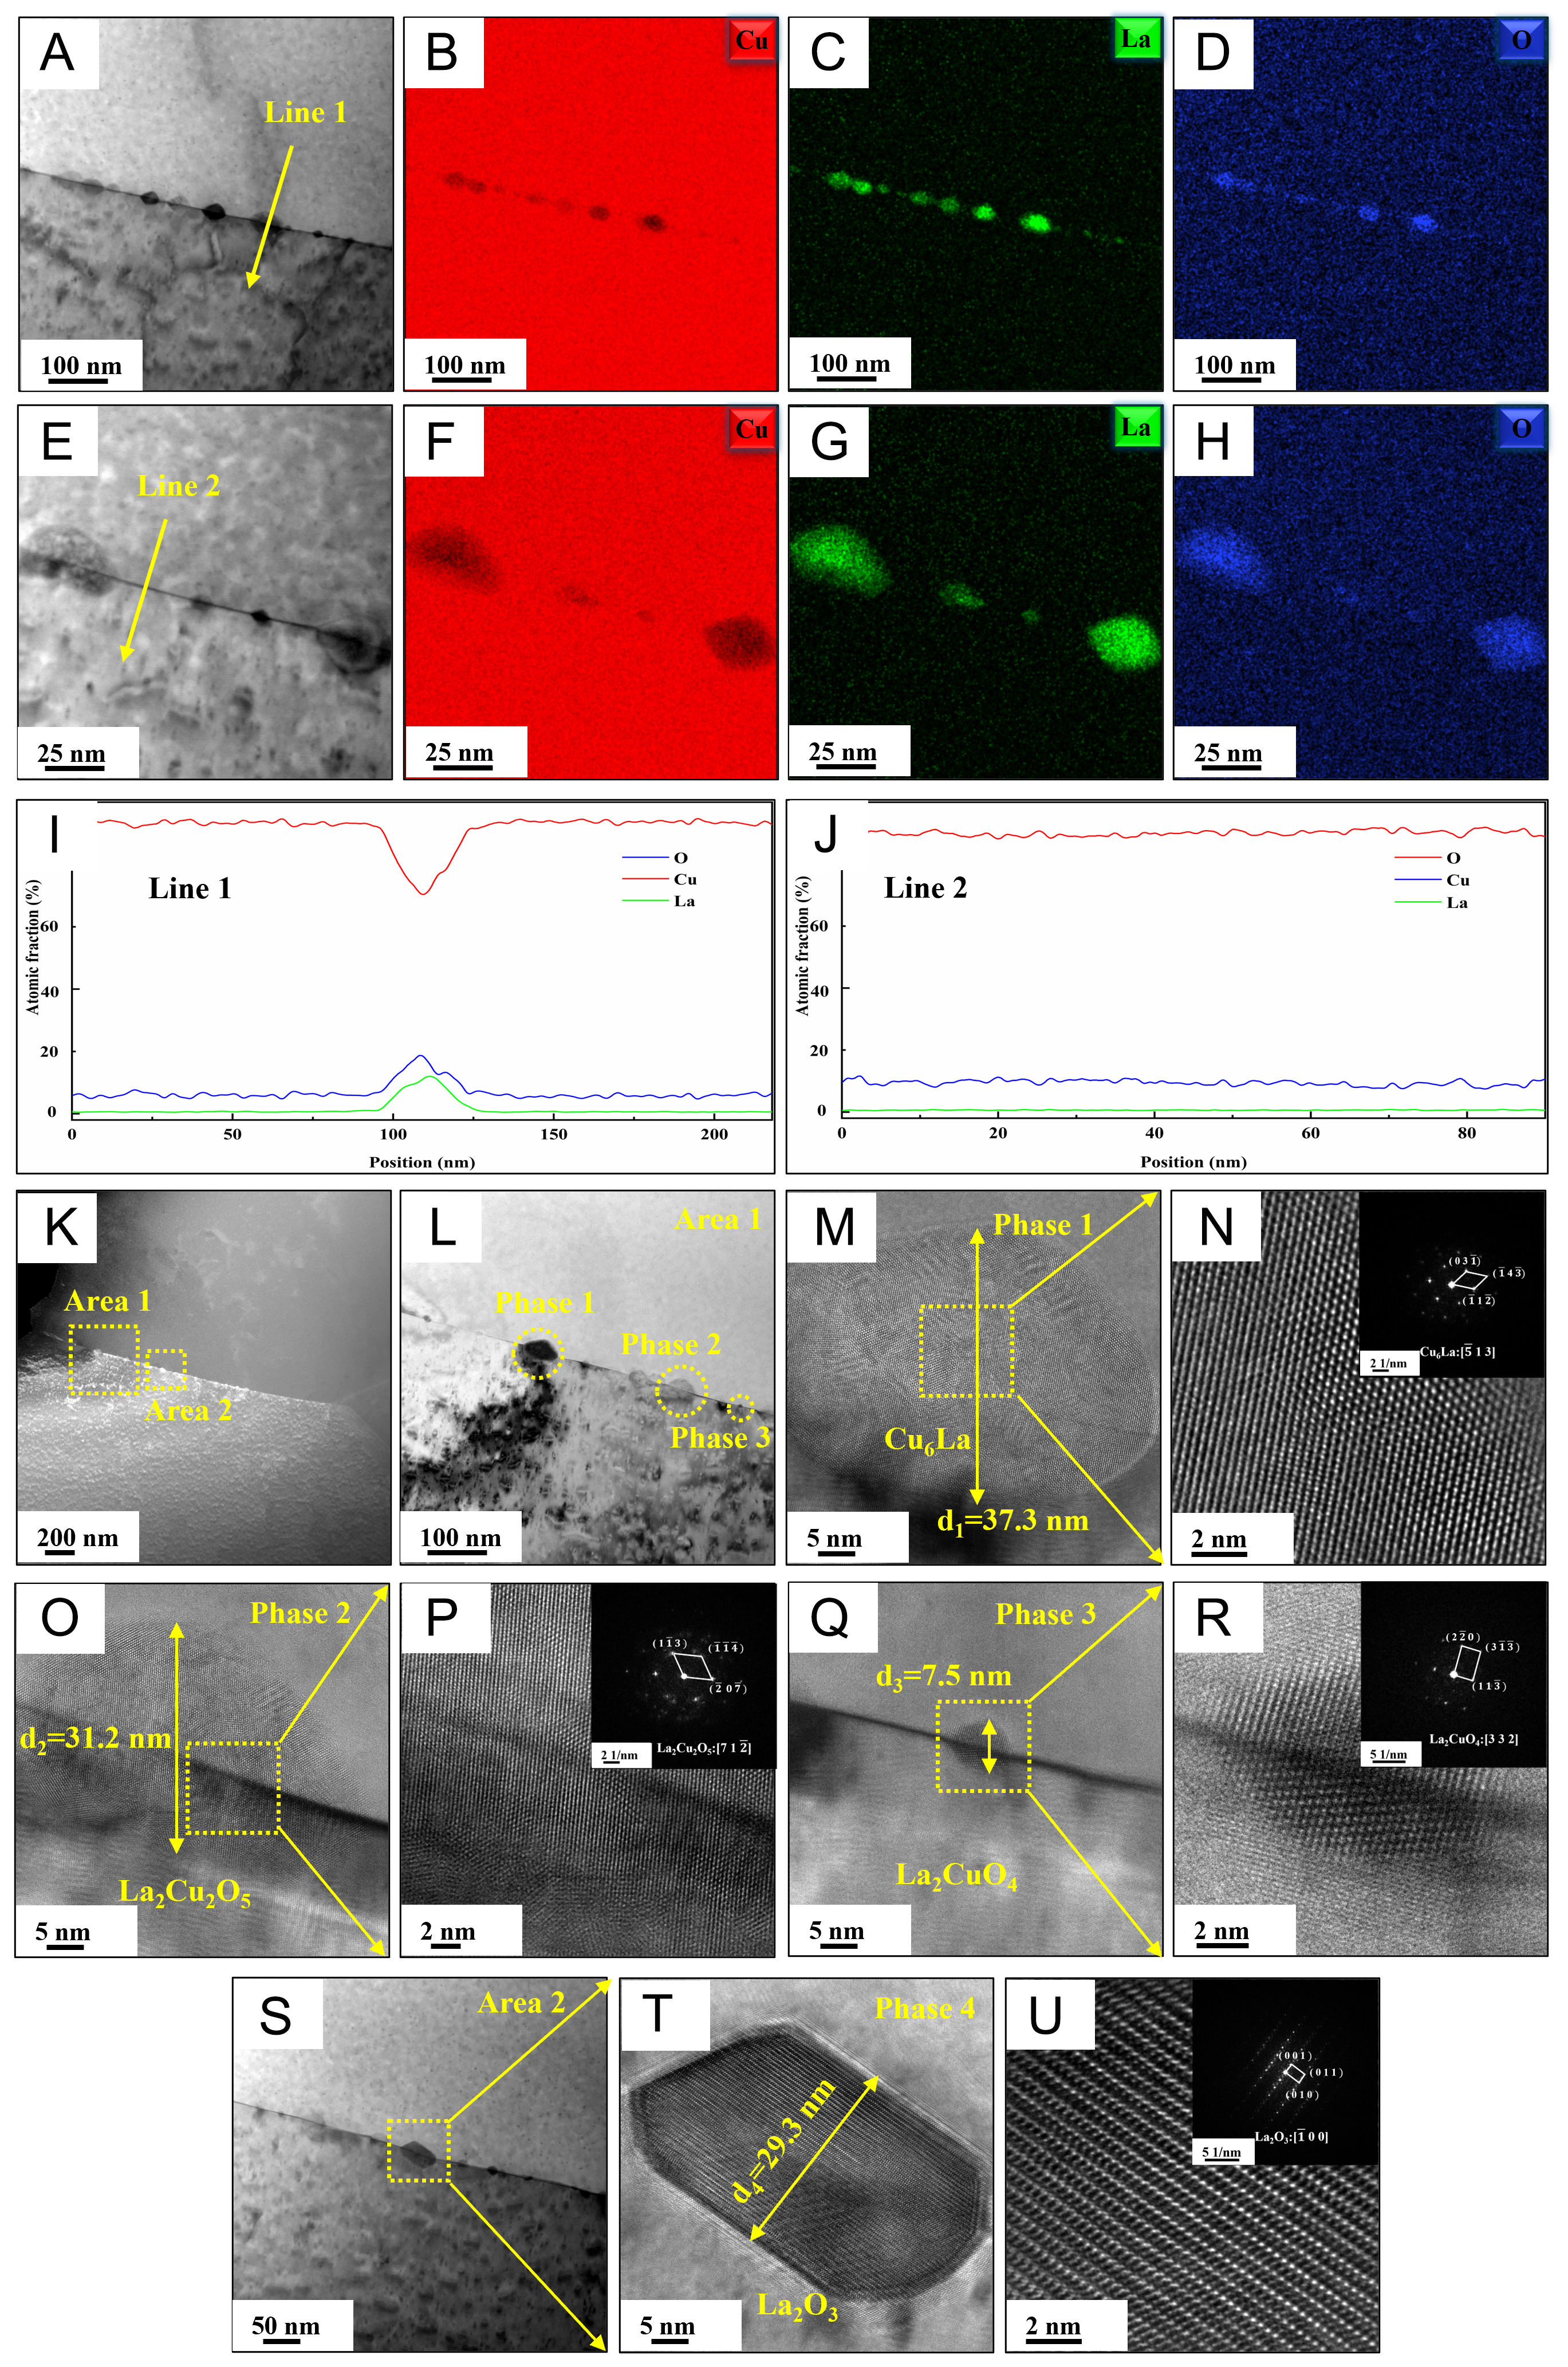
Figure 15. The TEM characterization of grain boundary segregation in La180 after annealing at 900 °C for 30 min: (A) and (E) TEM bright-field images of grain boundary segregation in La180, (B-D) EDS elemental map in (A), (F-H) EDS elemental map in (E), (I and J) EDS line scan, (K) TEM dark-field images of grain boundary segregation in La180, (L) TEM bright-field images of grain boundary segregation in Area 1, (M and N) HRTEM images and FFT of Phase 1, (O and P) HRTEM images and FFT of Phase 2, (Q and R) HRTEM images and FFT of Phase 3, (S) TEM bright-field images of grain boundary segregation in Area 2, (T and U) HRTEM images and FFT of Phase 4.
Figure 16 presents the TEM characterization results of intragranular second phases in La330 after annealing at 900 °C for 30 min. As shown in Figure 16A-D, several micrometer-sized La-rich oxide particles are dispersed within the grain interior. The EDS mapping results are presented in Figure 16B. SAED pattern from Area 1 was indexed, confirming the phase as La2O3. In Area 2, enrichment of S element is observed at the edges of the La-rich oxide particles. HRTEM and FFT analysis and indexing were performed on the S-rich phase in Area 3 [Figure 16E-G]. Combined with the point scan EDS result at Point 1 [Figure 16M], this S-rich phase is determined to be Cu31S16. It has a monoclinic crystal structure with a simple lattice, and lattice parameters of a = 26.897 Å, b = 15.745 Å, c = 13.465 Å. Furthermore, Figure 16H presents an individual micrometer-sized La-rich oxide particle. The corresponding EDS elemental maps are shown in
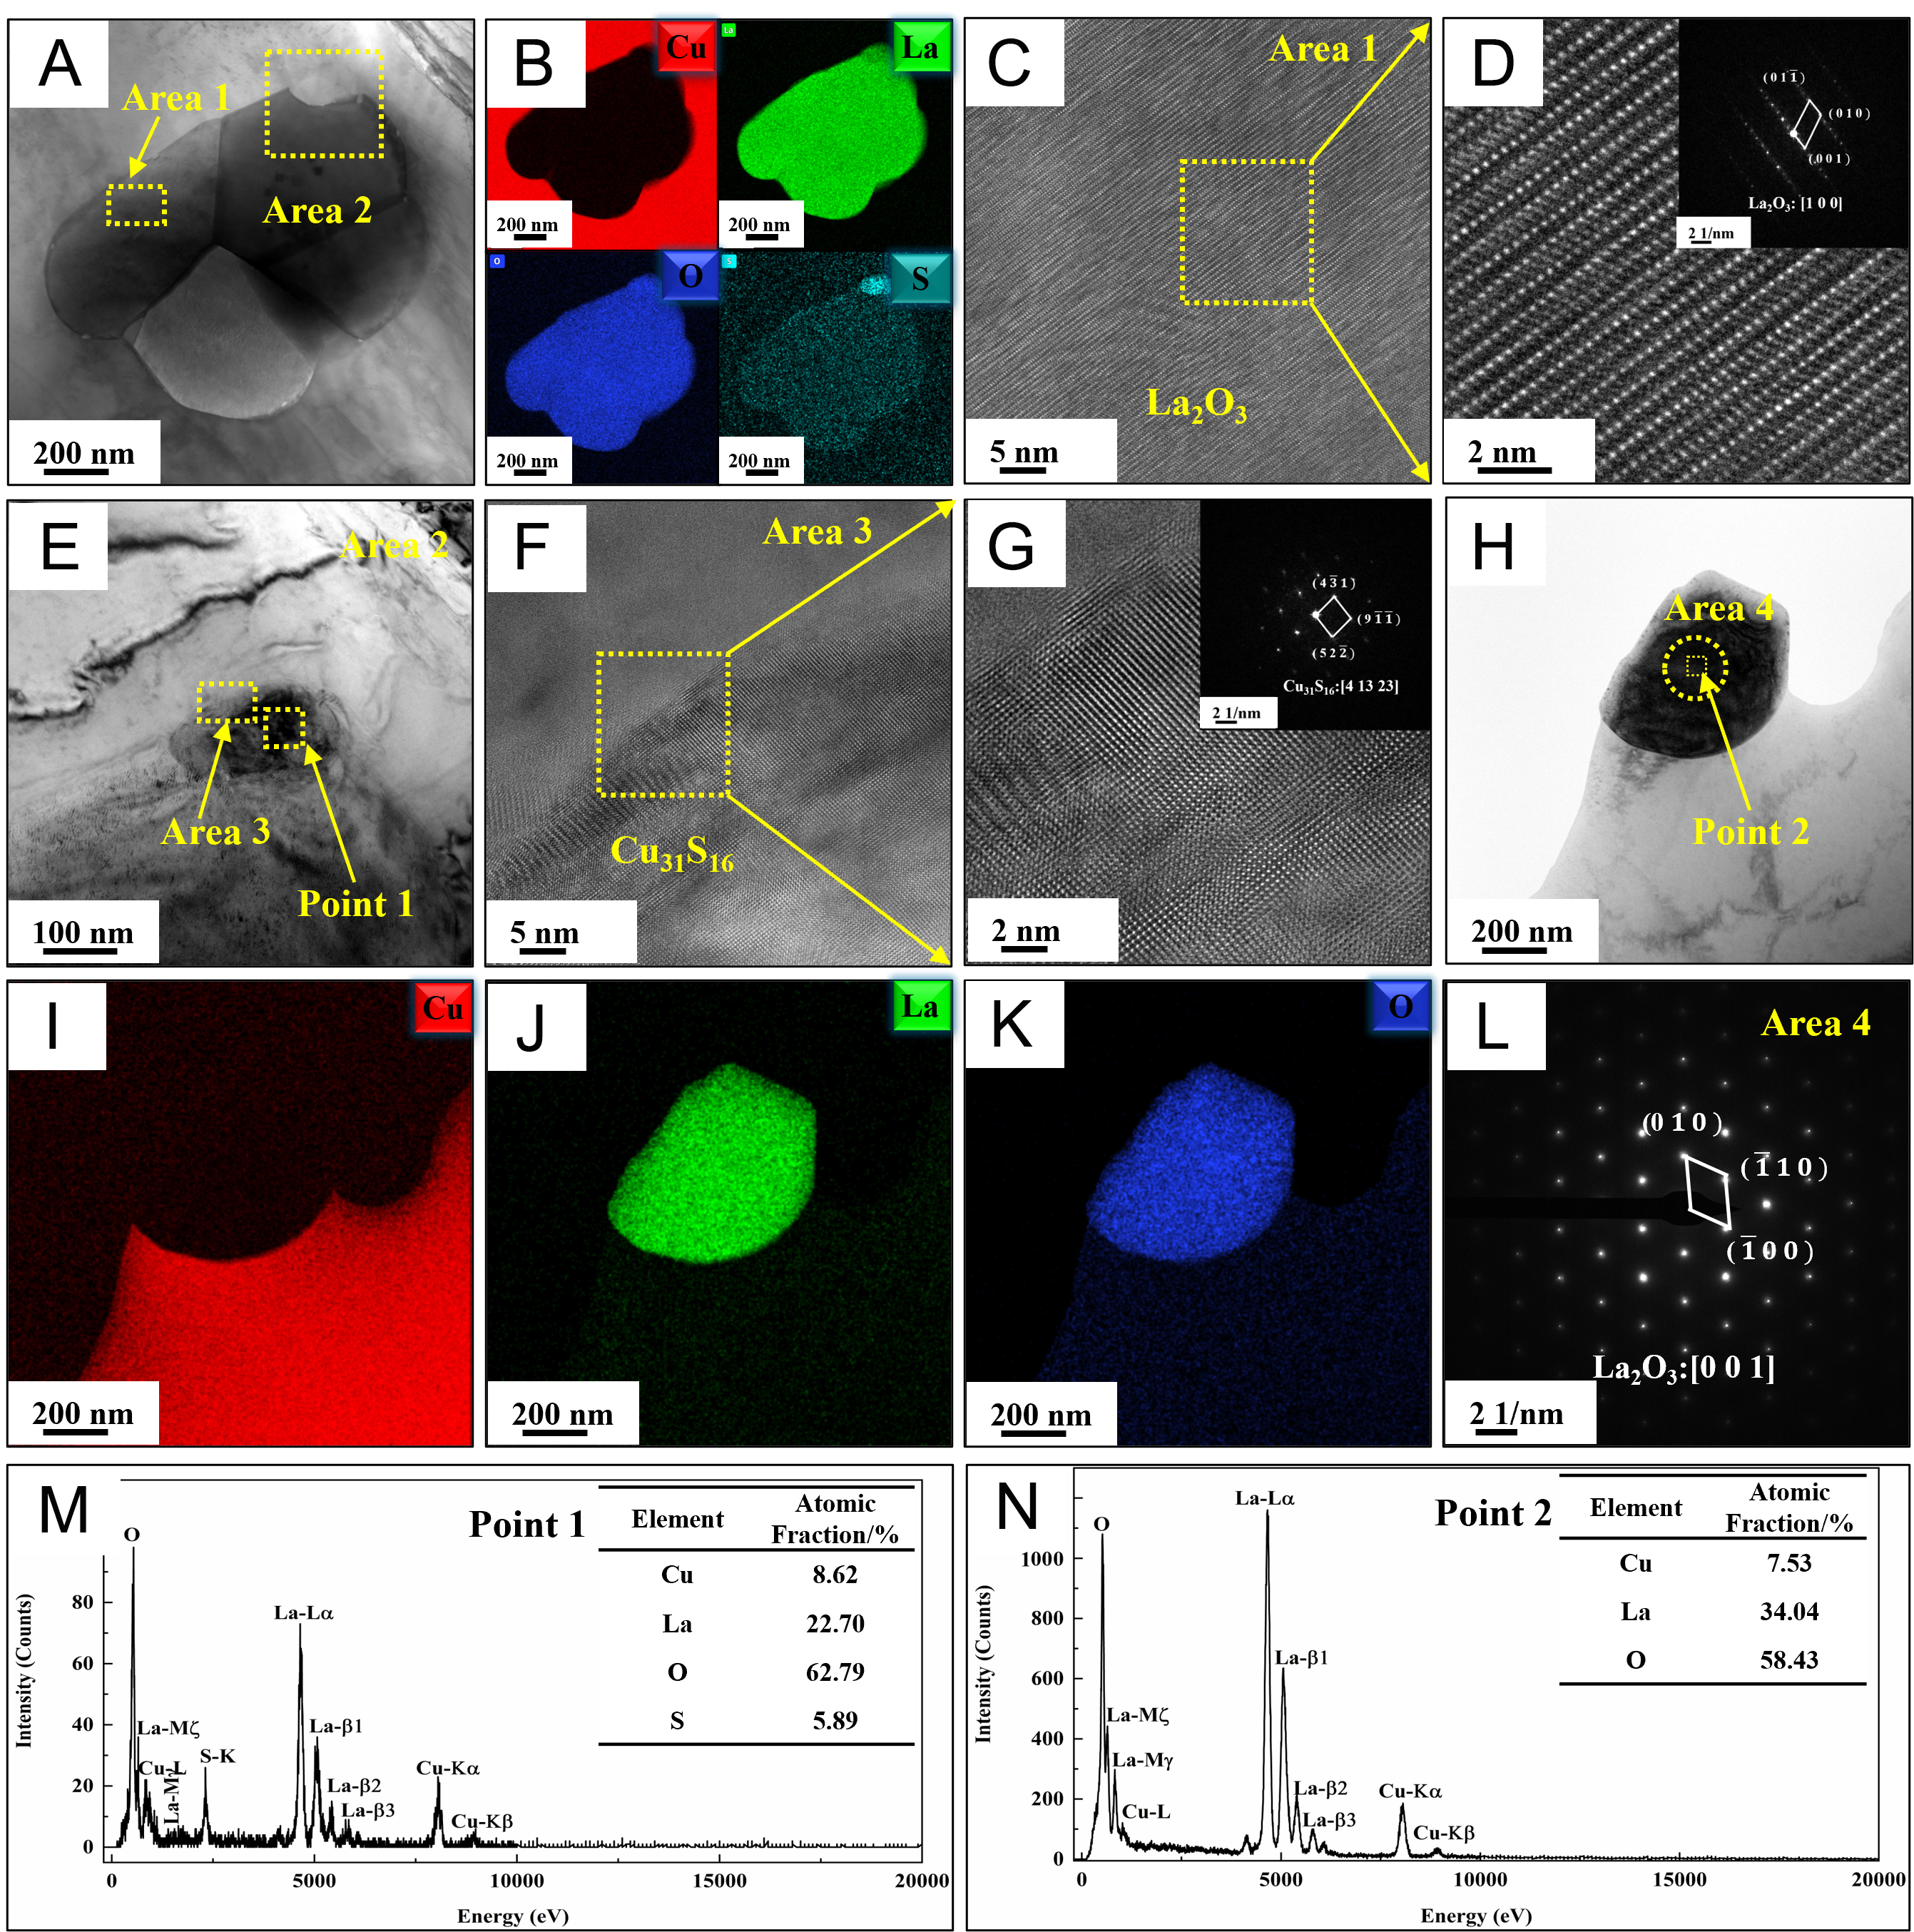
Figure 16. TEM characterization of second phase in La330 after annealing at 900 °C for 30 min: (A) TEM bright-field images of second phase in La330, (B) EDS elemental map in (A), (C and D) HRTEM images and FFT of Area 1, (E) TEM bright-field images in Area 2, (F and G) HRTEM images and FFT of Area 3, (H) TEM bright-field images of second phase in La330, (I-K) EDS elemental map in (H), (L) electron diffraction pattern of La2O3 of Area 4, (M) Spectra from Point 1, (N) Spectra from Point 2.
Figure 17 presents the TEM characterization of grain boundary segregation in La330 after annealing at
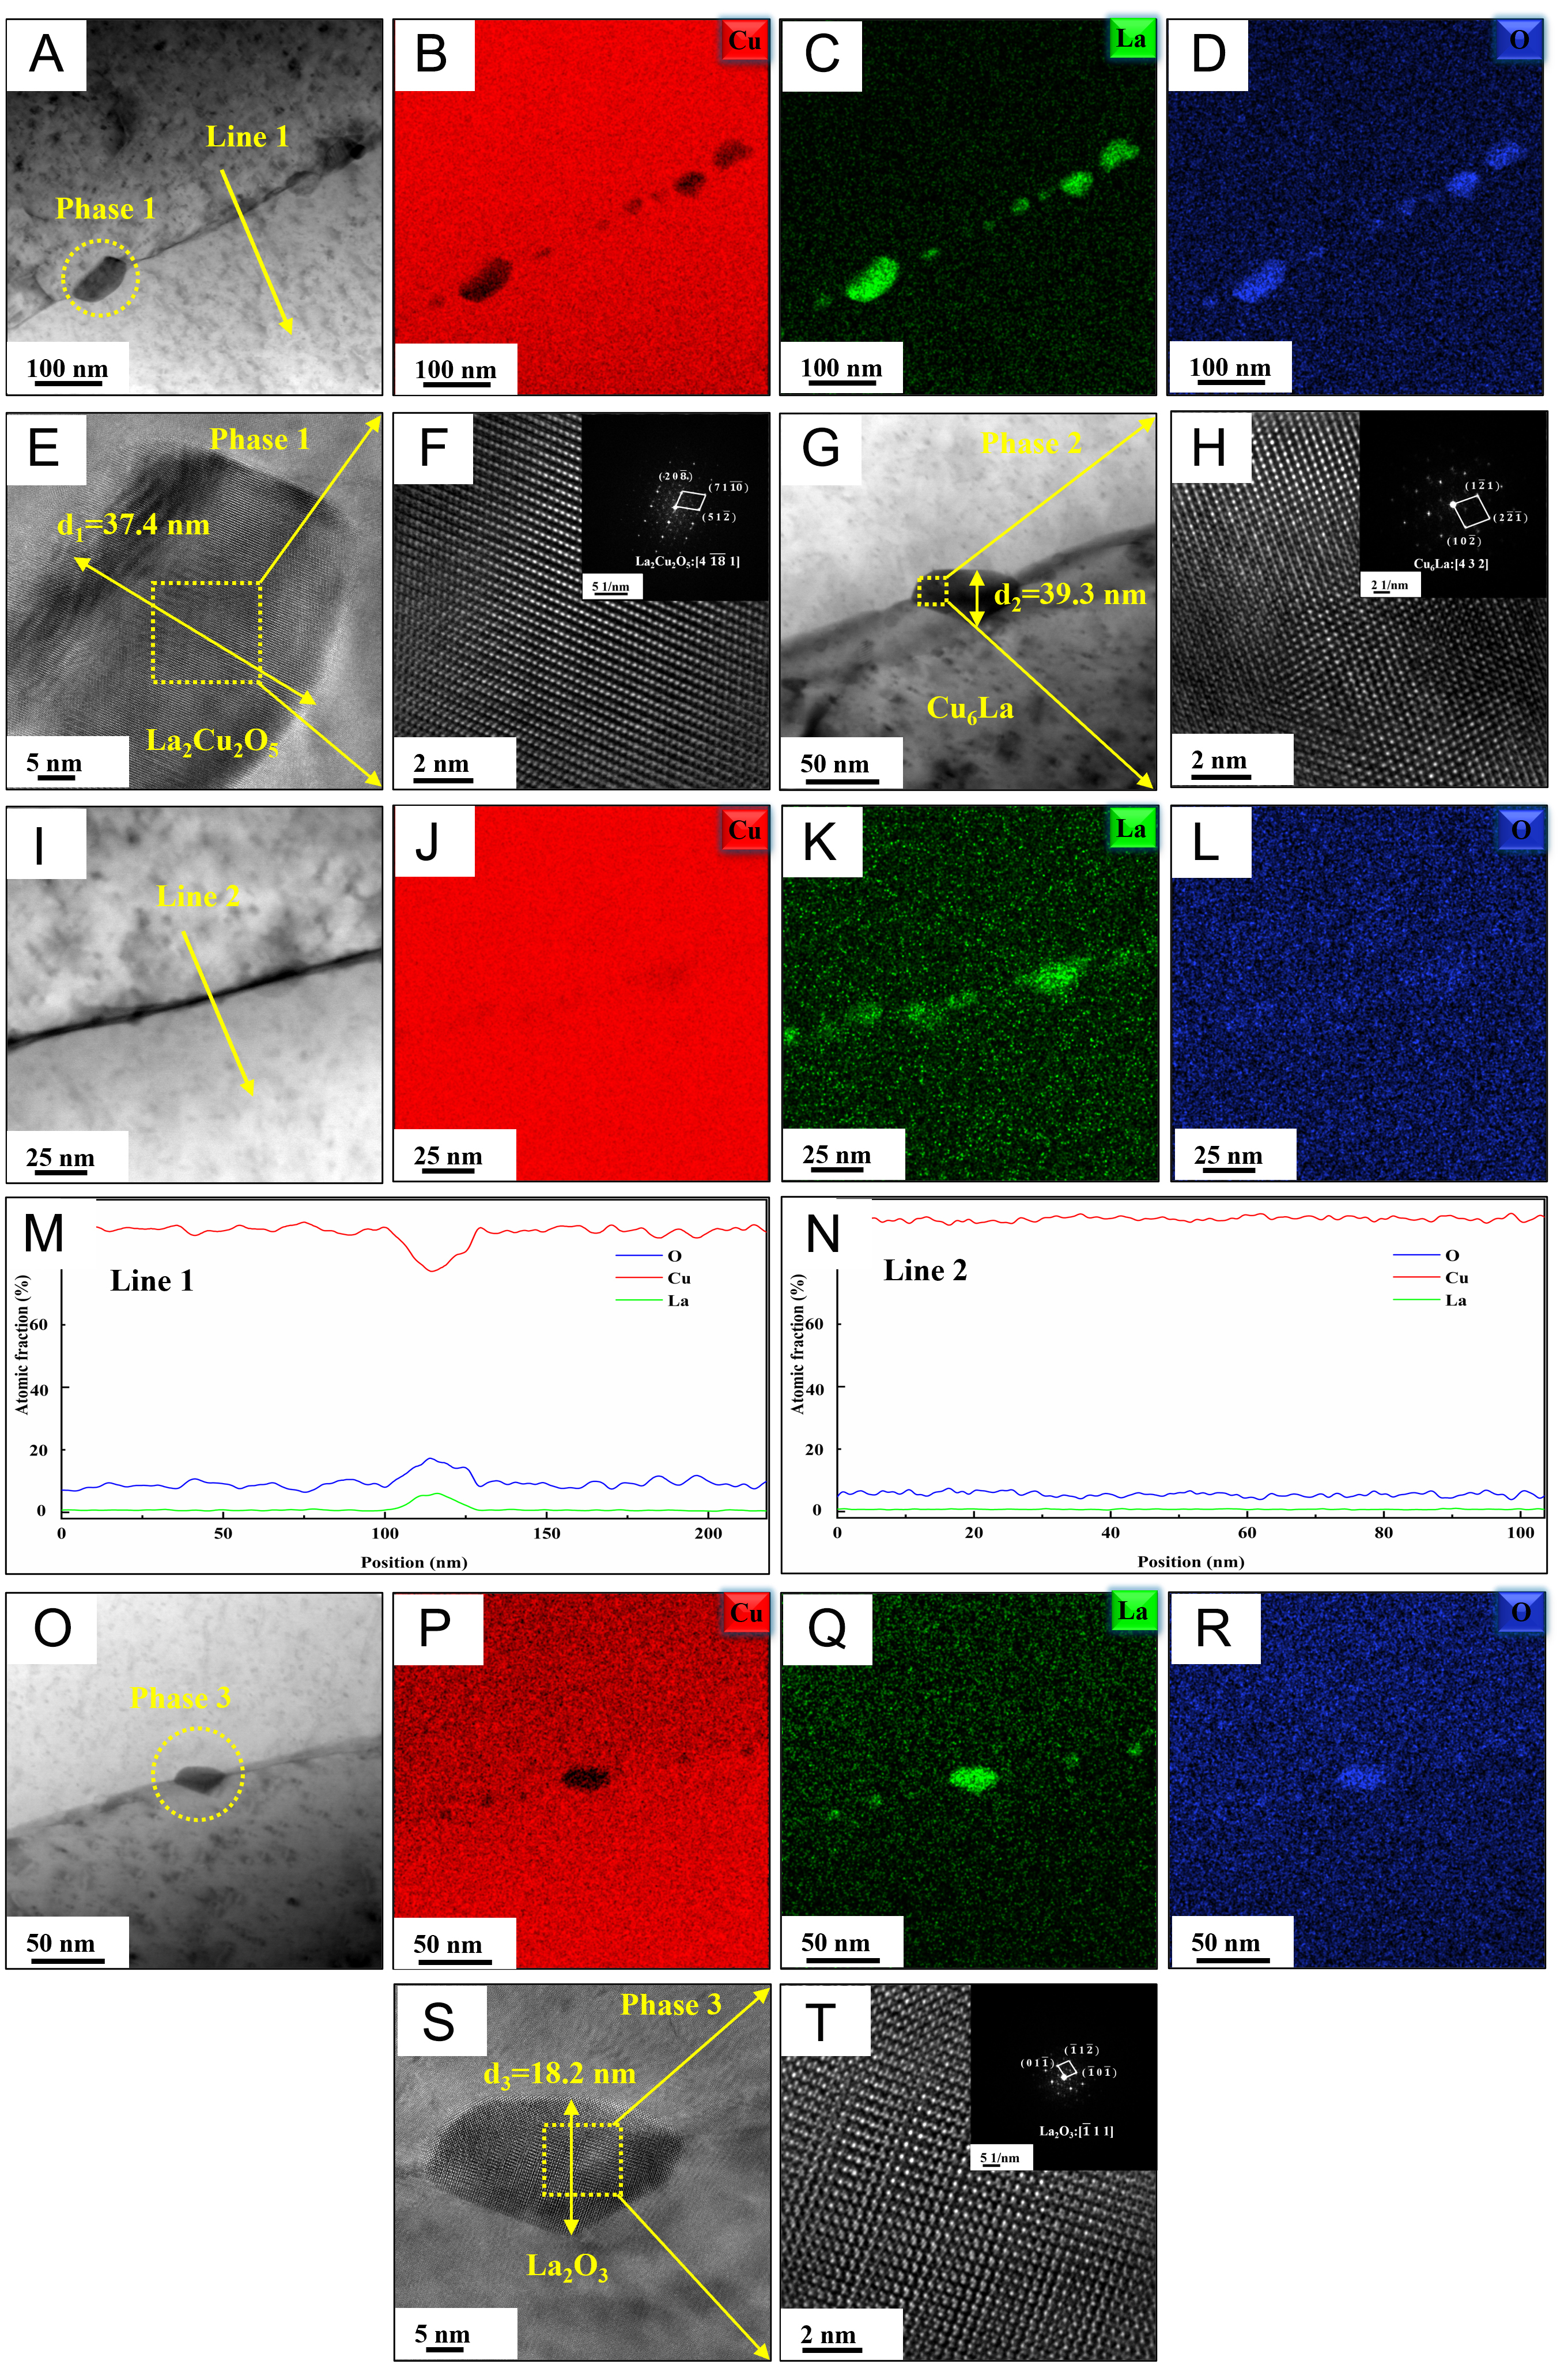
Figure 17. The TEM characterization of grain boundary segregation in La330 after annealing at 900 °C for 30 min: (A), (I and O)TEM bright-field images, (B-D) EDS elemental map in (A), (J-L) EDS elemental map in (I), (P-R) EDS elemental map in (O), (M and N) EDS line scan, (E and F) HRTEM images and FFT of Phase 1, (G and H) HRTEM images and FFT of Phase 2, (S and T) HRTEM images and FFT of Phase 3.
To quantitatively evaluate the Zener pinning effect of nanoscale La-rich precipitates on grain boundaries at high temperatures, theoretical estimations were carried out. The volume fraction fv of La-rich precipitates is given in[52]
where N is the total number of precipitates obtained from image statistics, A is the sum of the measured areas in the TEM micrographs, and d is the average diameter of the precipitates. The pinning force PZ of different nanoscale La-rich second phases can be calculated based on their volume fraction. The Zener pinning is calculated using[55]
where r and γ denote the average radius of the particles, and the grain boundary energy, respectively.
The detailed calculation results of the pinning force of nanoscale La-rich second phases are presented in Table 2. As shown in Table 2, the nanoscale La2O3, Cu6La and La2Cu2O5 segregated at grain boundaries in La180 are the main pinning phases, demonstrating that the intermetallic compound and the oxy-complex oxide are the core phases governing grain boundary pinning and contributing to grain refinement strengthening. These phases all preferentially segregate and precipitate at grain boundaries, forming a dense composite pinning that impedes grain boundary migration, refines the grains, and improves the thermal stability of oxygen-free copper. However, the pinning force of La2CuO4 is only 0.10 MPa, much lower than that of the other three phases. Even though this phase also segregates at grain boundaries, its anchoring role at the boundaries is very limited. To further elucidate the physical origin of the above differences, an in-depth analysis is required that considers the existing form of trace La in OFC after high-temperature annealing, the types of precipitates, and their thermodynamic and kinetic behavior.
Vol fraction (fv), average diameter (d), average radius (r) and the pinning force (PZ) of La-rich precipitates in La180 after high-temperature annealing at 900 °C for 30 min
| Cu6La | La2Cu2O5 | La2CuO4 | La2O3 | |
| f (%) | 1.04 | 0.73 | 0.04 | 1.01 |
| d (nm) | 37.30 | 31.20 | 7.50 | 29.30 |
| r (nm) | 18.65 | 15.60 | 3.75 | 14.65 |
| PZ (MPa) | 0.50 | 0.42 | 0.10 | 0.62 |
Combining microstructural observations in Figures 14-17 with thermodynamic and kinetic analyses, it is evident that the existing forms and precipitate types of trace La in OFC after high-temperature annealing are not monolithic. On the one hand, large-sized micron-scale La2O3 oxide phases can form within the grain interiors; on the other hand, multiple nanoscale precipitates, including Cu6La, La2Cu2O5, and La2O3, segregate at grain boundaries. Through different mechanisms of action, these phases exert a significant grain-refining effect on OFC grains after high-temperature annealing, while simultaneously improving hardness without compromising high electrical conductivity. Specifically, from a thermodynamic perspective, the rare-earth La acts as a potent deoxidizer[56] and preferentially combines with residual oxygen in OFC. La reacts with oxygen atoms either dissolved in the copper matrix or located at lattice defects, forming La2O3, which possesses extremely high thermodynamic stability. This reaction tends to occur within grain interiors, forming relatively large precipitates[30], its thermodynamic driving force originates from the extremely low formation enthalpy of La2O3, which causes oxygen atoms to diffuse toward La-rich regions inside the grains and then nucleate and grow. This process purifies the copper matrix and reduces the weakening or migration-promoting effects of low-melting-point impurities or other coarse, harmful phases on grain boundaries. The intragranularly distributed micron-scale La2O3 particles can serve as effective heterogeneous nucleation sites, significantly increasing the recrystallization nucleation rate and thereby refining the grains[57]. From a kinetic perspective, grain boundaries, with their loose structure and irregular atomic arrangement, serve as fast diffusion paths for atoms. The segregation of solute atoms (La and its compounds) to grain boundaries reduces the lattice distortion energy, thereby lowering the total energy of the system, which is the thermodynamic driving force for segregation. Under high-temperature annealing conditions, the atomic diffusion coefficient increases exponentially with temperature, significantly enhancing the diffusion rates of La, Cu, O and other elements, making it easier for solute atoms to migrate to grain boundaries and allowing the segregation process to proceed rapidly[58-60]. At the same time, grain boundaries themselves possess a driving force for migration at high temperatures. The nanoscale La-rich second phases (Cu6La, La2Cu2O5, La2O3, etc.) segregated at grain boundaries exert a strong Zener pinning effect and solute drag effect[61]. When a grain boundary migrates and attempts to break away from these particles, additional energy (i.e., the pinning force) must be consumed, thereby significantly reducing the effective driving force for grain boundary migration and decreasing the grain boundary mobility[62]. Kinetically, the pinning effect of second-phase particles on grain boundaries can be quantitatively described by particle size, volume fraction, and distribution: nanoscale particles possess a higher pinning force per unit volume, hindering the migration and coalescence of grain boundaries during high-temperature annealing, suppressing grain growth[63,64], while also impeding dislocation motion and increasing hardness. Further correlating the quantitative pinning force data from Tables 2 and 3 with the above thermodynamic and kinetic mechanisms provides a clearer explanation of why La2O3, Cu6La and La2Cu2O5 are the most effective pinning phases.
| Element | Atomic radius (pm) | Standard enthalpy of solution at infinite dilution (kJ/mol)[65] | Grain boundary segregation energy (eV)[70] | Solid solubility in Cu[66-69] |
| La | 187 | -103 | -3.00 | Virtually insoluble in solid |
| Y | 180 | -105 | -2.45 | Extremely limited |
| Sc | 162 | -102 | -1.50 | Extremely limited |
| Zr | 160 | -44 | -1.65 | 0.24 wt.% |
| Cr | 128 | +112 | 0.15 | < 0.07 wt.% |
In summary, the multi-scale precipitation and grain boundary segregation of La-rich second phases synergistically refine the grain structure through dual mechanisms of "promoting nucleation" and "inhibiting grain growth”. Consequently, this significantly enhances hardness while maintaining high electrical conductivity, ultimately effectively improving the thermal stability of OFC.
Compared with conventional rare-earth elements (e.g., Y) and other typical microalloying elements (e.g., Sc, Zr, Cr), La possesses the largest atomic radius (187 pm), resulting in the greatest lattice misfit with the Cu matrix (128 pm). Table 3 summarizes the quantitative comparison data for atomic radius, limiting enthalpy of solution, grain-boundary segregation energy, and solid solubility of each element. In terms of atomic size effect, the atomic radius of La (187 pm) is larger than that of Y (180 pm), Sc (162 pm), Zr (160 pm), and Cr (128 pm), resulting in the maximum misfit with the Cu matrix, which provides a structural basis for strong grain boundary segregation of La. In terms of thermodynamic driving force for precipitation, the standard enthalpies of solution at infinite dilution[65] for Y (-105 kJ/mol), La (-103 kJ/mol), and Sc (-102 kJ/mol) are substantially more negative than those for Zr (-44 kJ/mol) and Cr (+112 kJ/mol), indicating that rare earth elements possess an exceptionally strong thermodynamic tendency to precipitate from the Cu matrix and form stable second-phase particles. The enthalpy for Y is slightly more negative than that for La, but the difference is within experimental error and can be considered comparable. In terms of solid solubility[66-69], La, Y, and Sc all exhibit extremely low solid solubility in Cu; The solubility limit of Cr in copper is below
In summary, La synergistically refines grains through the dual mechanisms of "promoting nucleation" and "inhibiting grain growth”. At an extremely low addition level (180 ppm), it enables OFC to maintain a high electrical conductivity of 101.3% IACS while simultaneously significantly increasing hardness and enhancing thermal stability. The strong grain boundary segregation of La not only lowers the nucleation barrier for precipitates and provides a large number of fine heterogeneous nucleation sites, but also effectively retards grain boundary migration through solute drag and Zener pinning, thereby substantially suppressing grain growth at high temperatures. Y, Sc, Zr, and Cr, owing to their insufficiently negative segregation energies or excessively high solid solubility, are unable to achieve this synergistic effect. This work, for the first time, reveals the dual synergistic mechanism of La in grain refinement and its integrated optimization of electrical conductivity, hardness, and thermal stability, offering a new design strategy for high-strength, high-conductivity, and heat-resistant copper alloys.
Comparison of the effects of trace rare-earth elements on the thermal stability of pure copper
To quantitatively substantiate the superior comprehensive performance of the La180, Table 4 compares the key thermal-stability parameters of Cu-RE alloys with different rare-earth elements (La, Ce, Sc, Yb) reported in the literature, alongside our La330 specimen for reference. Under comparable annealing conditions
Comparison of key thermal-stability parameters for copper with different trace rare-earth elements[20,71]
| Element | Rare-earth content (wt.%) | Grain size stability (μm) | Annealing process | Electrical conductivities (%IACS) |
| La (La180) | 0.0180 | 38.64 μm | 900 °C/0.5 h | 101.3 |
| La (La330) | 0.0330 | 43.10 μm | 900 °C/0.5 h | 101.3 |
| Ce[20] | 0.0017 | 150.00 μm | 1,070 °C/0.3 h | 100.5 |
| Sc[71] | 0.012 | 60.43 μm | 850 °C/0.8 h | 98.5 |
| Yb[20] | 0.0014 | 148.00 μm | 1,070 °C/0.3 h | 101.5 |
In terms of electrical conductivity after the corresponding annealing treatments, La180 achieves 101.3% IACS, which is comparable to La330 (101.3% IACS) and Yb (101.5% IACS)[20], and superior to Sc (98.5% IACS)[71] and Ce (100.5% IACS)[20]. This demonstrates that the exceptional grain refinement achieved by La180 is not accompanied by any degradation in electrical conductivity, thereby maintaining an optimal balance between thermal stability and electrical performance.
The superior performance of La180 can be attributed to the following factors: (i) the extremely low solid solubility of La in Cu ensures that nearly all added La precipitates as nanoscale Cu6La particles, which exert a strong Zener pinning effect on grain boundaries; (ii) the large atomic radius misfit between La (187 pm) and Cu (128 pm) promotes strong solute drag and grain boundary segregation; and (iii) the combination of these mechanisms effectively suppresses grain growth and retards recrystallization even at elevated temperatures.
In summary, through systematic experiments, the unique nanoprecipitation strengthening mechanism of La in OFC has been revealed, which enables La180 to simultaneously achieve an extremely fine grain size
CONCLUSION
(1) The addition of a higher content of rare-earth La effectively suppresses grain coarsening and abnormal grain growth after high-temperature annealing at 900 °C and significantly improves the "orange-peel" defect. Among them, La180 exhibits the finest grain size of 38.64 μm. Meanwhile, La180 maintains a high electrical conductivity of 101.3 %IACS after high-temperature annealing. This study provides a key theoretical basis and a feasible composition design strategy for OFC materials with high electrical conductivity and high thermal stability, applicable to high-temperature-resistant power electronics and high-power devices such as DBC and shows broad application prospects.
(2) The addition of rare-earth La significantly promotes the transition from Brass Rec texture to Cube texture, with the transformation sequence of strong textures being Brass Rec → Brass → Cube. In La330, a widely distributed Cube texture with high intensity is formed, accounting for as much as 85.1% of the texture components, with a maximum texture intensity of 41.26.
(3) A higher content of rare earth La can form second phases that pin grain boundaries and suppress the transformation of rolling textures into recrystallization textures, thereby delaying the recrystallization process, increasing the softening temperature of OFC. La180 exhibits the highest softening temperature of 210 °C, representing an increase of 53 °C.
(4) The mechanism by which La significantly enhances the high-temperature thermal stability of OFC is primarily attributed to the synergistic effect between the multi-scale precipitation of La-rich second phases and their segregation behavior at grain boundaries. Through the dual mechanisms of "promoting nucleation" and "inhibiting grain growth" working in concert, the grain structure is refined. This leads to a significant increase in hardness while maintaining high electrical conductivity, ultimately effectively enhancing the thermal stability of OFC.
DECLARATIONS
Authors’ contributions
Resources, project administration, methodology, funding acquisition, writing - review & editing, software: Peng, X.
Writing - review & editing, writing - original draft, visualization, validation, software, methodology, investigation, formal analysis, data curation, conceptualization: Xu, C.
Resources, funding acquisition: Yang, B.
Funding acquisition: Song, K.
Supervision: Hua, Y.; Huang, T.
Supervision, project administration, funding acquisition: Liu, H.
Availability of data and materials
The data that support the findings of this study are available from the corresponding author upon reasonable request.
AI and AI-assisted tools statement
Not applicable.
Financial support and sponsorship
This work was supported by the Youth Project of the Natural Science Foundation of Henan Province (252300420443), Joint Fund of Henan Province Science and Technology R&D Program (NO.245200810003), Key Research Projects of Higher Education Institutions in Henan Province (NO.24A430016), Key-Area Research and Development Program of Guangdong Province (NO.2024B0101080003), and Doctoral Research Initiation Fund of Henan University of Science and Technology.
Conflicts of interest
All authors declared that there are no conflicts of interest.
Ethical approval and consent to participate
Not applicable.
Consent for publication
Not applicable.
Copyright
© The Author(s) 2026.
REFERENCES
1. Abuelnaga, A.; Narimani, M.; Bahman, A. S. A review on IGBT module failure modes and lifetime testing. IEEE. Access. 2021, 9, 9643-63.
2. Zhang, Z.; Fu, G.; Wan, B.; Jiang, M.; Li, Y. A high-efficiency IGBT health status assessment method based on data driven. IEEE. Trans. Electron. Devices. 2021, 68, 168-74.
3. Du, M.; Hong, G.; Yang, J. Bonding wire aging monitoring method for IGBT and FWD based on dual-parameter decoupling. Microelectron. Reliab. 2026, 176, 115970.
4. Wang, J.; Chen, C.; Bai, L.; Luo, Y.; Song, C.; Cheng, Y. Investigation of electromagnetic force effect in IGBT modules. Microelectron. Reliab. 2025, 166, 115606.
5. Zhang, Q.; Feng, Q.; Chen, M.; Zhan, Y. Design of superjunction blocking junction IGBT with doubly doped polysilicon gate and floating carrier storage layer. Microelectron. J. 2025, 166, 106892.
6. Chen, C.; Luo, Y.; Wang, J.; et al. Electrical-magnetic-mechanical coupling stress of bonding wires in IGBT packaging modules. Microelectron. Reliab. 2025, 175, 115953.
7. Lei, T. G.; Calata, J.; Ngo, K.; Guo-Quan, Lu. Effects of large-temperature cycling range on direct bond aluminum substrate. IEEE. Trans. Device. Mater. Relib. 2009, 9, 563-8.
8. Akhtar, S.; Kareem, L.; Arif, A.; Siddiqui, M.; Hakeem, A. Development of a ceramic-based composite for direct bonded copper substrate. Ceram. Int. 2017, 43, 5236-46.
9. Kabaar, A. B.; Buttay, C.; Dezellus, O.; Estevez, R.; Gravouil, A.; Gremillard, L. Characterization of materials and their interfaces in a direct bonded copper substrate for power electronics applications. Microelectron. Reliab. 2017, 79, 288-96.
10. Choi, S.; Kim, S.; Lee, J.; Kim, K.; Hyun, S. Joining of lotus-type porous copper to alumina substrate by direct bonded copper technique. Mater. Sci. Semicond. Process. 2026, 202, 110137.
11. Blum, W.; Li, Y.; Durst, K. Stability of ultrafine-grained Cu to subgrain coarsening and recrystallization in annealing and deformation at elevated temperatures. Acta. Mater. 2009, 57, 5207-17.
12. Ye, S.; Liu, Z.; Luo, J.; et al. Enhancing softening resistance of Cu-Cr-Nb-Y alloy fabricated using laser powder bed fusion via nano-Cr2Nb phases and bimodal grain heterostructure. Mater. Sci. Eng. A. 2026, 961, 149989.
13. Wang, Y.; Bai, Y.; Jiang, K.; Fan, W.; Wang, P.; Hao, H. Influence of minor cerium addition on microstructure and fluidity of as-cast Al-Cu-Mn-Mg alloy. J. Rare. Earths. 2025, 43, 377-83.
14. Cai, Y.; Wang, X.; Yuan, S. Quantitative analysis of orange peel during tension of 6063 alloy spun tubes. Trans. Nonferrous. Met. Soc. China. 2018, 28, 858-65.
15. Wang, S.; Zhang, S.; Song, H.; Chen, Y. Surface roughness improvement of the bent thin-walled copper tube by controlling the microstructure and texture components. Procedia. Manuf. 2020, 50, 613-7.
16. Fukumoto, A.; Berry, D.; Ngo, K. D. T.; Lu, G. Q. Effects of extreme temperature swings ( -55°C to 250°C) on silicon nitride active metal brazing substrates. IEEE. Trans. Device. Mater. Relib. 2014, 14, 751-6.
17. Romanova, V.; Balokhonov, R.; Panin, A.; Kazachenok, M.; Kozelskaya, A. Micro- and mesomechanical aspects of deformation-induced surface roughening in polycrystalline titanium. Mater. Sci. Eng. A. 2017, 697, 248-58.
18. Han, J.; Li, X.; An, T.; Wang, Y.; Guo, F. Failure analysis and simulation of IGBT under active and passive thermal cycling. Microelectron. Reliab. 2025, 167, 115638.
19. Wang, S.; Song, H.; Chen, Y.; Zhang, S.; Hu, K.; Zhu, Y. Micro-mechanism and influencing factors of orange peel defects on bended surface of sintered pure copper heat pipe. Chinese. J. Rare. Metals. 2022, 46, 1-8.
20. Chen, Z.; Liu, Y.; Hu, T.; et al. Mechanism of improving thermal stability of oxygen-free copper by ultra-trace alloying. J. Alloys. Compd. 2026, 1050, 185875.
21. Sakai, T.; Xu, Z. Effect of purity on static grain growth in dynamically recrystallized copper. J. Japan. Inst. Metals. 1995, 59, 125-32.
22. Sun, T.; Geng, J.; Bian, Z.; et al. Enhanced thermal stability and mechanical properties of high-temperature resistant Al-Cu alloy with Zr and Mn micro-alloying. Trans. Nonferrous. Met. Soc. China. 2022, 32, 64-78.
23. Jiang, Y.; Li, S.; Liang, N.; et al. Revealing the high strength and high thermal stability of a nano-lamellar Cu-0.1 at.% Zr alloy. Acta. Mater. 2024, 276, 120163.
24. Hornbuckle, B. C.; Smeltzer, J. A.; Sharma, S.; et al. A high-temperature nanostructured Cu-Ta-Li alloy with complexion-stabilized precipitates. Science 2025, 387, 1413-7.
25. Zhang, Y.; Ji, Z.; Jia, C.; Liu, G.; Wan, F.; Zhan, Q. Influence of lanthanum on enhancement of mechanical and electrical properties of Cu-Al2O3 composites. J. Rare. Earths. 2019, 37, 534-40.
26. Chang, L.; Jia, B.; Li, S.; Zhu, X.; Feng, R.; Shang, X. Influence of cerium on solidification, recrystallization and strengthening of Cu-Ag alloys. Journal. of. Rare. Earths. 2017, 35, 1029-34.
27. Hao, Z.; Xie, G.; Liu, X.; Tan, Q.; Wang, R. The precipitation behaviours and strengthening mechanism of a Cu-0.4 wt% Sc alloy. J. Mater. Sci. Technol. 2022, 98, 1-13.
28. Zeng, Y.; Wu, Y.; Guo, Y.; et al. Effect of rare earth yttrium on properties of oxygen free copper processing material. Heat. Treatment. Technol. Equip. 2024, 45, 35-9.
29. Chen, Y.; Cheng, M.; Song, H.; Zhang, S.; Liu, J.; Zhu, Y. Effects of lanthanum addition on microstructure and mechanical properties of as-cast pure copper. J. Rare. Earths. 2014, 32, 1056-63.
30. Xu, C.; Peng, X.; Yang, B.; et al. The effect of trace rare earth La element on the microstructure and properties of deformed oxygen-free copper. J. Alloys. Compd. 2025, 1037, 182557.
31. Agnew, S. R.; Duygulu, Ö. Plastic anisotropy and the role of non-basal slip in magnesium alloy AZ31B. Int. J. Plast. 2005, 21, 1161-93.
32. Chen, Y.; Zhang, S. H.; Cheng, M.; Song, H. W.; Xu, A. W.; Liu, J. S. Effects of microalloying with La on microstructure and properties of cold rolled pure copper. Mater. Res. Innovations. 2014, 18, S4-1121.
33. Chen, Y.; Zhang, S.; Cheng, M.; Song, H.; Liu, J.; Xiong, S. Effects of microalloying with lanthanum on recrystallization of cold rolled pure copper. Proc. Eng. 2014, 81, 203-8.
34. Proville, L.; Bakó, B. Dislocation depinning from ordered nanophases in a model fcc crystal: From cutting mechanism to Orowan looping. Acta. Mater. 2010, 58, 5565-71.
35. Jiang, M.; Zhang, X.; Mei, H.; Xu, S.; Liu, L. The coupled effects of grain boundary strengthening and Orowan strengthening examined by dislocation dynamics simulations. Comput. Mater. Sci. 2024, 231, 112602.
36. Dai, J.; Chen, H.; Cui, Y.; et al. Deformation mechanisms of Al alloys containing shearable/non-shearable L12 precipitates: a comparative study under varied slip system activations. Acta. Mater. 2025, 301, 121607.
37. Tao, M.; Li, G.; Liu, B.; et al. Microstructure evolution and mechanical properties of high-temperature anti-softening Cu-Ni-Ti alloy. Mater. Sci. Eng. A. 2026, 953, 149748.
38. Wang, P.; Siddiqui, M. F.; Poletti, M. C.; Enzinger, N. Phase transformation and recrystallization of cold-rolled AISI 304L austenitic stainless steel during annealing. Mater. Des. 2025, 252, 113738.
39. Cheng, Q.; Tan, F.; Zhang, T.; et al. Microstructural analysis and its correlation to anneal hardening in a cobalt-nickel-based superalloy. Acta. Mater. 2025, 286, 120705.
40. Liu, Y.; Zhou, Y.; Lu, C.; et al. Nano-precipitates evolution and properties improvement mechanism of Cu-Zn-Ni-Si-X alloy strip based on multi-element microalloying and thermomechanical treatment. J. Mater. Res. Technol. 2023, 25, 107-19.
41. Liang, X.; Dodge, M.; Jiang, J.; Dong, H. Using transmission Kikuchi diffraction in a scanning electron microscope to quantify geometrically necessary dislocation density at the nanoscale. Ultramicroscopy 2019, 197, 39-45.
42. Ma, X.; Huang, C.; Moering, J.; et al. Mechanical properties of copper/bronze laminates: role of interfaces. Acta. Mater. 2016, 116, 43-52.
43. Calcagnotto, M.; Ponge, D.; Demir, E.; Raabe, D. Orientation gradients and geometrically necessary dislocations in ultrafine grained dual-phase steels studied by 2D and 3D EBSD. Mater. Sci. Eng. A. 2010, 527, 2738-46.
44. Abbasi, Z.; Abedi, H. R. Dynamic recrystallization behavior of selective laser melted 316L stainless steel. J. Mater. Res. Technol. 2023, 27, 6458-73.
45. Zhang, M.; Yang, J.; Li, H. The influence of rare earth ce on the microstructure and properties of cast pure copper. Materials 2024, 17, 2387.
46. Matson, D. M. Retained free energy as a driving force for phase transformation during rapid solidification of stainless steel alloys in microgravity. NPJ. Microgravity. 2018, 4, 22.
47. Velayarce, J. R.; Chen, X.; Berbenni, S.; Motz, C. On the migration of a high-angle grain boundary—effect of shear stress and energy jump-driving force on micro-bicrystals. Adv. Eng. Mater. 2024, 26, 2400406.
48. Sheikhani, A.; Roumina, R.; Mahmudi, R. Texture softening in a rare earth elements-containing AZ31 magnesium alloy during hot compression deformation. J. Mater. Res. Technol. 2022, 18, 4089-98.
49. Geranmayeh, A.; Ashrafizadeh, S. M.; Mahmudi, R. Microstructural stability and softening resistance of cast AZ81 and AZ81+1RE magnesium alloys. J. Mater. Res. Technol. 2025, 35, 3937-44.
50. Xu, C.; Peng, X.; Yang, B.; et al. The effect of trace rare earth La element on the recrystallization behavior of oxygen-free copper. J. Mater. Res. Technol. 2025, 39, 7005-19.
51. Ge, C.; Zhou, Y.; Jing, H.; et al. Large strain continuous deformation induces the formation of nanotwins and microbands to synergistically improve the strength and electrical conductivity of Cu-0.3Sn alloy wires. J. Alloys. Compd. 2025, 1039, 183281.
52. Shan, Y.; Zhang, Y.; Zhang, C.; et al. Study on the microstructure evolution and strengthening mechanism of Cu-Ni-Si alloy after two-stage rolling and aging. Mater. Des. 2025, 254, 113935.
53. Hu, T.; Chen, J.; Liu, J.; Liu, Z.; Wu, C. The crystallographic and morphological evolution of the strengthening precipitates in Cu-Ni-Si alloys. Acta. Mater. 2013, 61, 1210-9.
54. Shan, Y.; Zhang, C.; Zhang, Y.; et al. Influence of different rolling passes and deformation amounts on the microstructure evolution and strengthening mechanism of Cu-Ni-Si alloy. J. Mater. Res. Technol. 2024, 33, 3205-20.
55. Hu, G.; Zeng, L.; Du, H.; Wang, Q.; Fan, Z.; Liu, X. Combined effects of solute drag and Zener pinning on grain growth of a NiCoCr medium-entropy alloy. Intermetallics 2021, 136, 107271.
56. Zhang, L.; Ren, Y. Thermodynamics on the deoxidation of pure iron by single element deoxidizer. In: Handbook of non-metallic inclusions in steels. Singapore: Springer Nature Singapore; 2025. pp. 119-41.
57. Bramfitt, B. L. The effect of carbide and nitride additions on the heterogeneous nucleation behavior of liquid iron. Metall. Trans. 1970, 1, 1987-95.
58. Jiao, L.; Xie, L.; Zhu, Y.; et al. Grain boundary segregation mediated highly stable and high performance nanostructured MgAgSb bulk thermoelectric materials. Trans. Mater. Res. 2025, 1, 100016.
59. Dai, F.; Wen, B.; Sun, Y.; Ren, Y.; Xiang, H.; Zhou, Y. Grain boundary segregation induced strong UHTCs at elevated temperatures: a universal mechanism from conventional UHTCs to high entropy UHTCs. J. Mater. Sci. Technol. 2022, 123, 26-33.
60. Zhang, J.; Huang, T.; Lu, F.; et al. Unveiling the Re segregation at γ/γ′ interface in Ni-based superalloy. Scr. Mater. 2021, 204, 114131.
61. Wang, Y.; Yuan, Y.; Ji, W.; et al. Stabilizing nanocrystals via interface co-segregation and clustering. Acta. Mater. 2025, 301, 121589.
62. Zhou, Q.; Ding, Q.; Gao, Y.; Wei, X.; Zhang, Z.; Bei, H. Achieving superplasticity in a hard-to-deform precipitation strengthened Ni-based alloy by suppressing grain boundary brittleness. Acta. Mater. 2026, 304, 121760.
63. Liu, C.; Rao, J.; Sun, Z.; et al. Near-theoretical strength and deformation stabilization achieved via grain boundary segregation and nano-clustering of solutes. Nat. Commun. 2024, 15, 9283.
64. Qian, X.; Dong, Z.; Jiang, B.; et al. Influence of alloying element segregation at grain boundary on the microstructure and mechanical properties of Mg-Zn alloy. Mater. Des. 2022, 224, 111322.
65. Watanabe, S.; Kleppa, O. J. Thermochemistry of alloys of transition metals: part IV. Alloys of copper with scandium, yttrium, lanthanum, and lutetium. Metall. Trans. B. 1984, 15, 357-68.
66. Cirafici, S.; Palenzona, A. The lanthanum-copper system. J. Less. Common. Metals. 1977, 53, 199-203.
67. He, X.; Liu, H. Determination of the isothermal section of the Cu-Zr-Y ternary system at 978 K. J. Alloys. Compd. 2009, 475, 245-51.
68. Liu, J.; Wang, E.; Liu, Z.; Hu, L.; Fang, W. Phases interface in deformation processed Cu-15wt.%Cr composite prepared by elemental powders. Mater. Sci. Eng. A. 2004, 382, 301-4.
70. Huang, Z.; Wang, P.; Chen, F.; Shen, Q.; Zhang, L. Understanding solute effect on grain boundary strength based on atomic size and electronic interaction. Sci. Rep. 2020, 10, 16856.
Cite This Article
 Open Access
How to Cite
Download Citation
Export Citation File:
Type of Import
Tips on Downloading Citation
Citation Manager File Format
Type of Import
Direct Import: When the Direct Import option is selected (the default state), a dialogue box will give you the option to Save or Open the downloaded citation data. Choosing Open will either launch your citation manager or give you a choice of applications with which to use the metadata. The Save option saves the file locally for later use.
Indirect Import: When the Indirect Import option is selected, the metadata is displayed and may be copied and pasted as needed.
About This Article
Copyright

Data & Comments
Data
0










Comments
Comments must be written in English. Spam, offensive content, impersonation, and private information will not be permitted. If any comment is reported and identified as inappropriate content by OAE staff, the comment will be removed without notice. If you have any queries or need any help, please contact us at [email protected].