

fig15
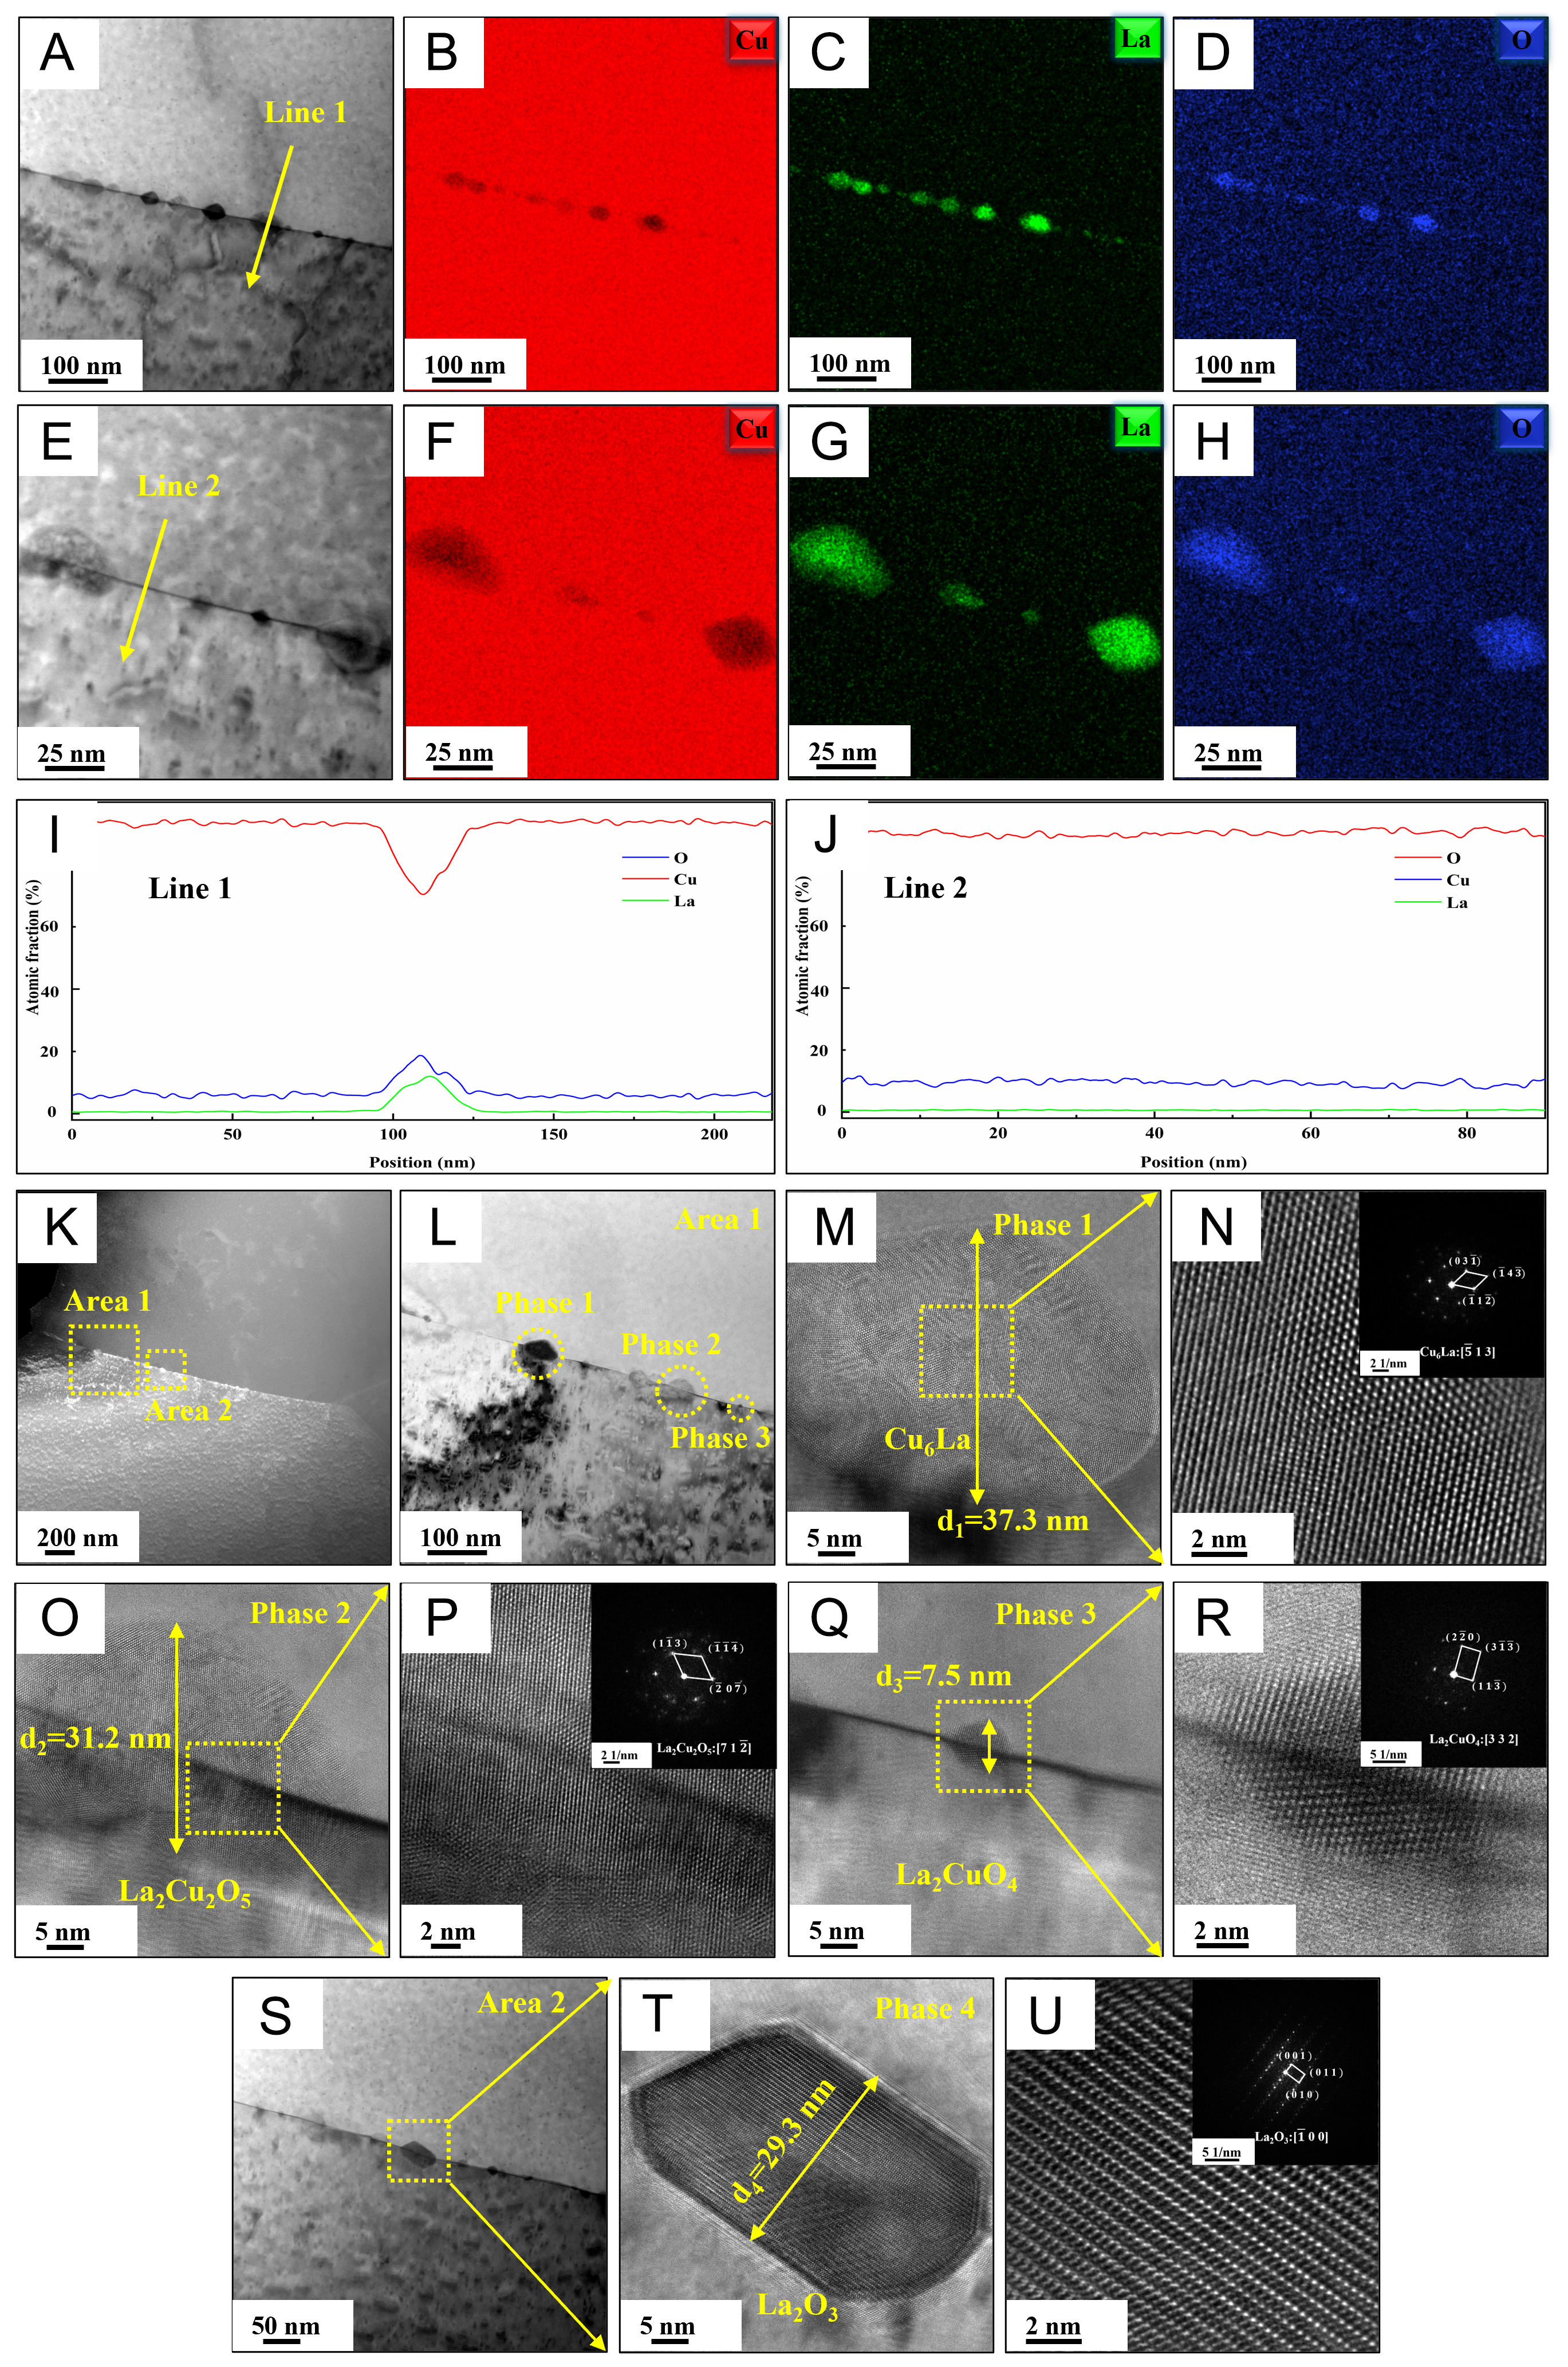
Figure 15. The TEM characterization of grain boundary segregation in La180 after annealing at 900 °C for 30 min: (A) and (E) TEM bright-field images of grain boundary segregation in La180, (B-D) EDS elemental map in (A), (F-H) EDS elemental map in (E), (I and J) EDS line scan, (K) TEM dark-field images of grain boundary segregation in La180, (L) TEM bright-field images of grain boundary segregation in Area 1, (M and N) HRTEM images and FFT of Phase 1, (O and P) HRTEM images and FFT of Phase 2, (Q and R) HRTEM images and FFT of Phase 3, (S) TEM bright-field images of grain boundary segregation in Area 2, (T and U) HRTEM images and FFT of Phase 4.





