
fig7
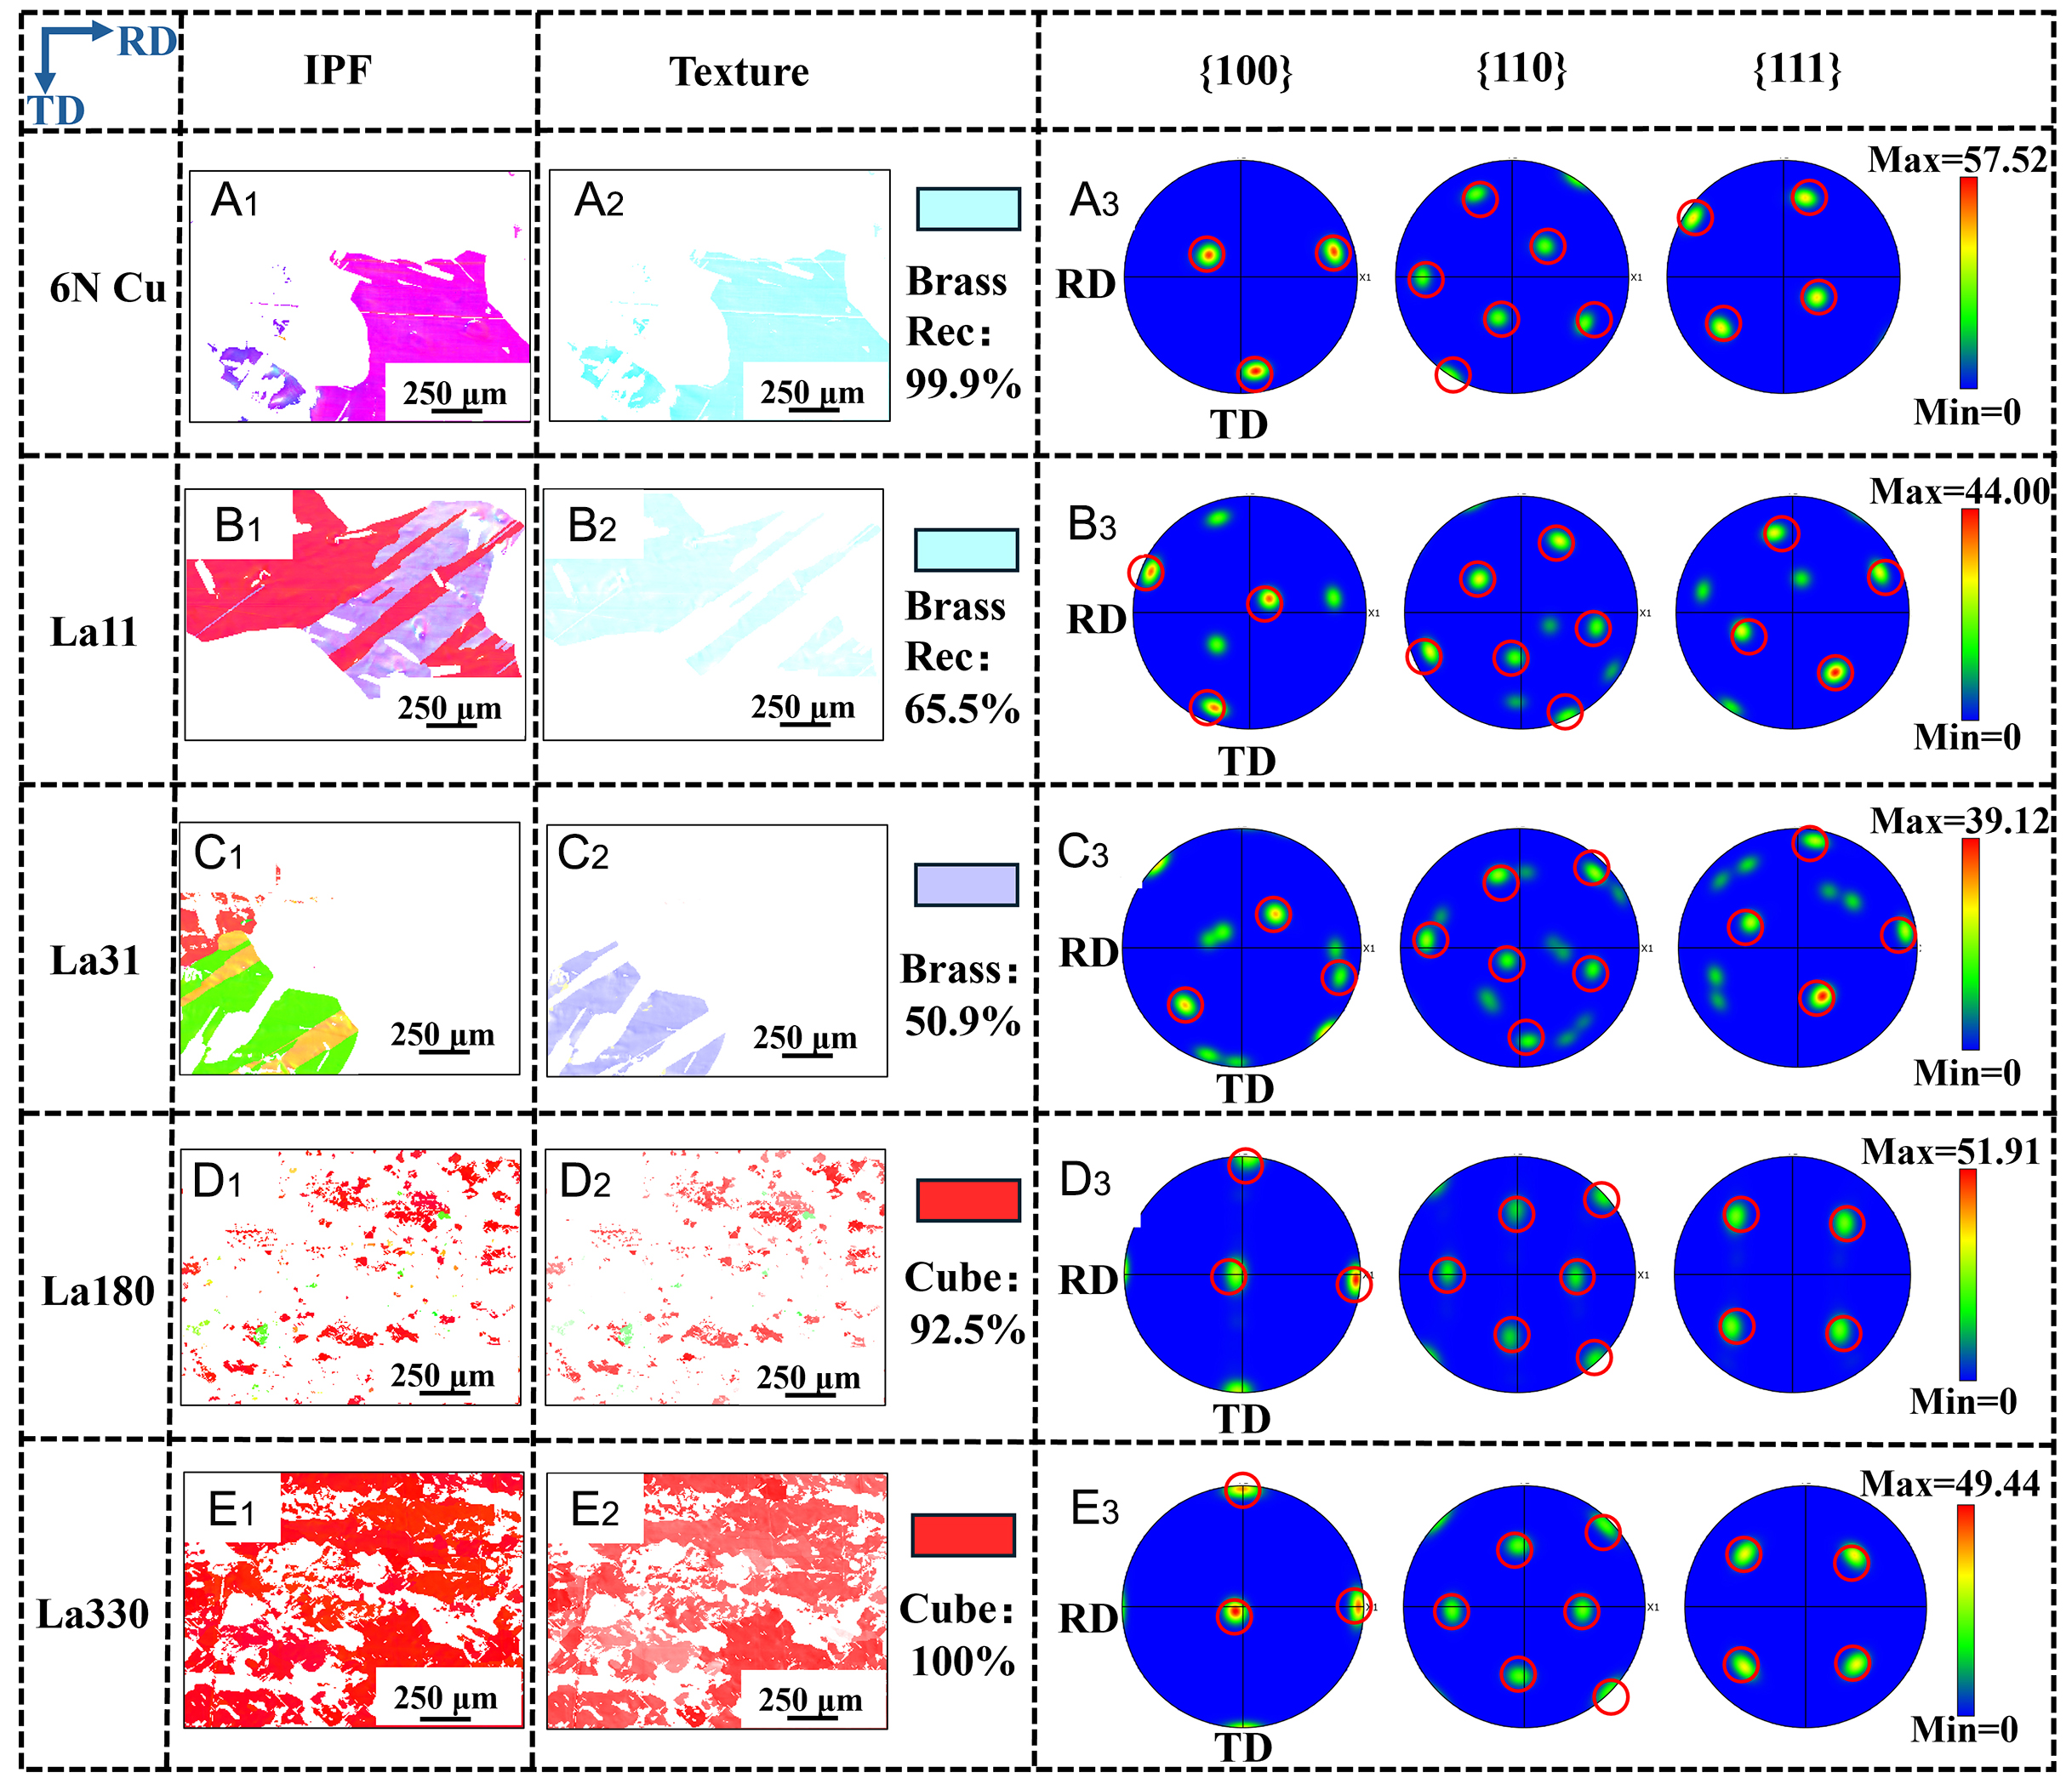
Figure 7. The IPF and texture maps of the pole figure and the corresponding regions of OFC with different La contents after annealing at 900 °C for 30 min: (A1-A3) 6N Cu, (B1-B3) La11, (C1-C3) La31, (D1-D3) La180, (E1-E3) La330.

Figure 7. The IPF and texture maps of the pole figure and the corresponding regions of OFC with different La contents after annealing at 900 °C for 30 min: (A1-A3) 6N Cu, (B1-B3) La11, (C1-C3) La31, (D1-D3) La180, (E1-E3) La330.


All published articles are preserved here permanently:
https://www.portico.org/publishers/oae/


