

fig8
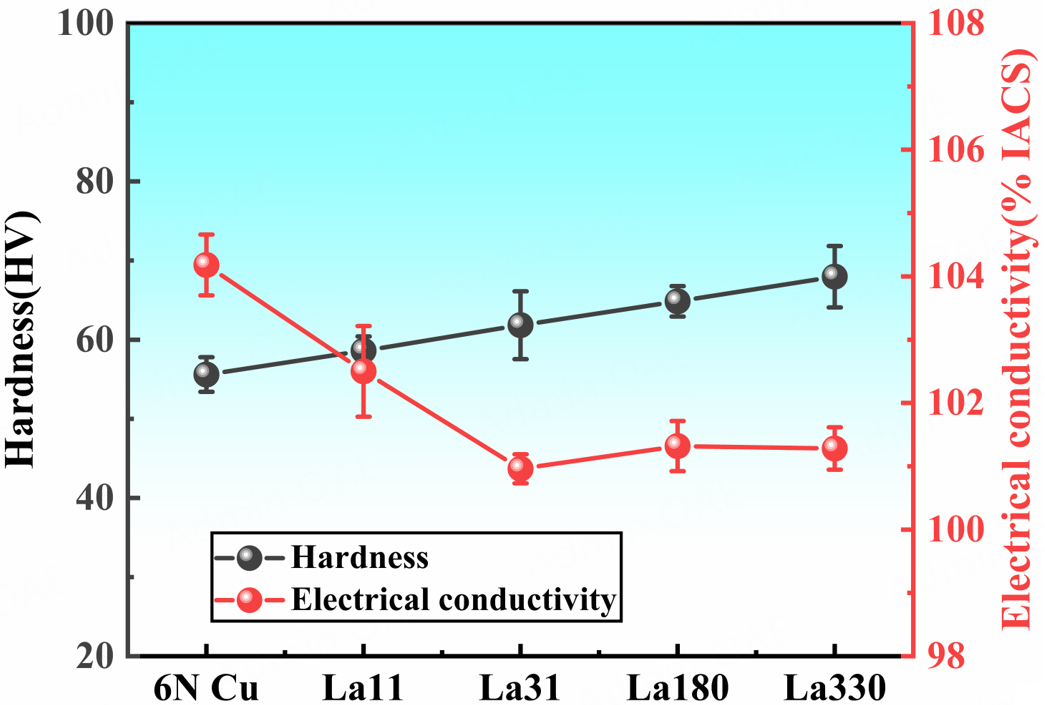
Figure 8. Results of electrical conductivity and hardness of OFC with different La contents after annealing at 900 °C for 30 min. Error bars denote the standard deviation (SD) of the measurements. For each sample, the conductivity is measured 5 times, and the average value is taken as the conductivity of the specimen measured.





