

fig14
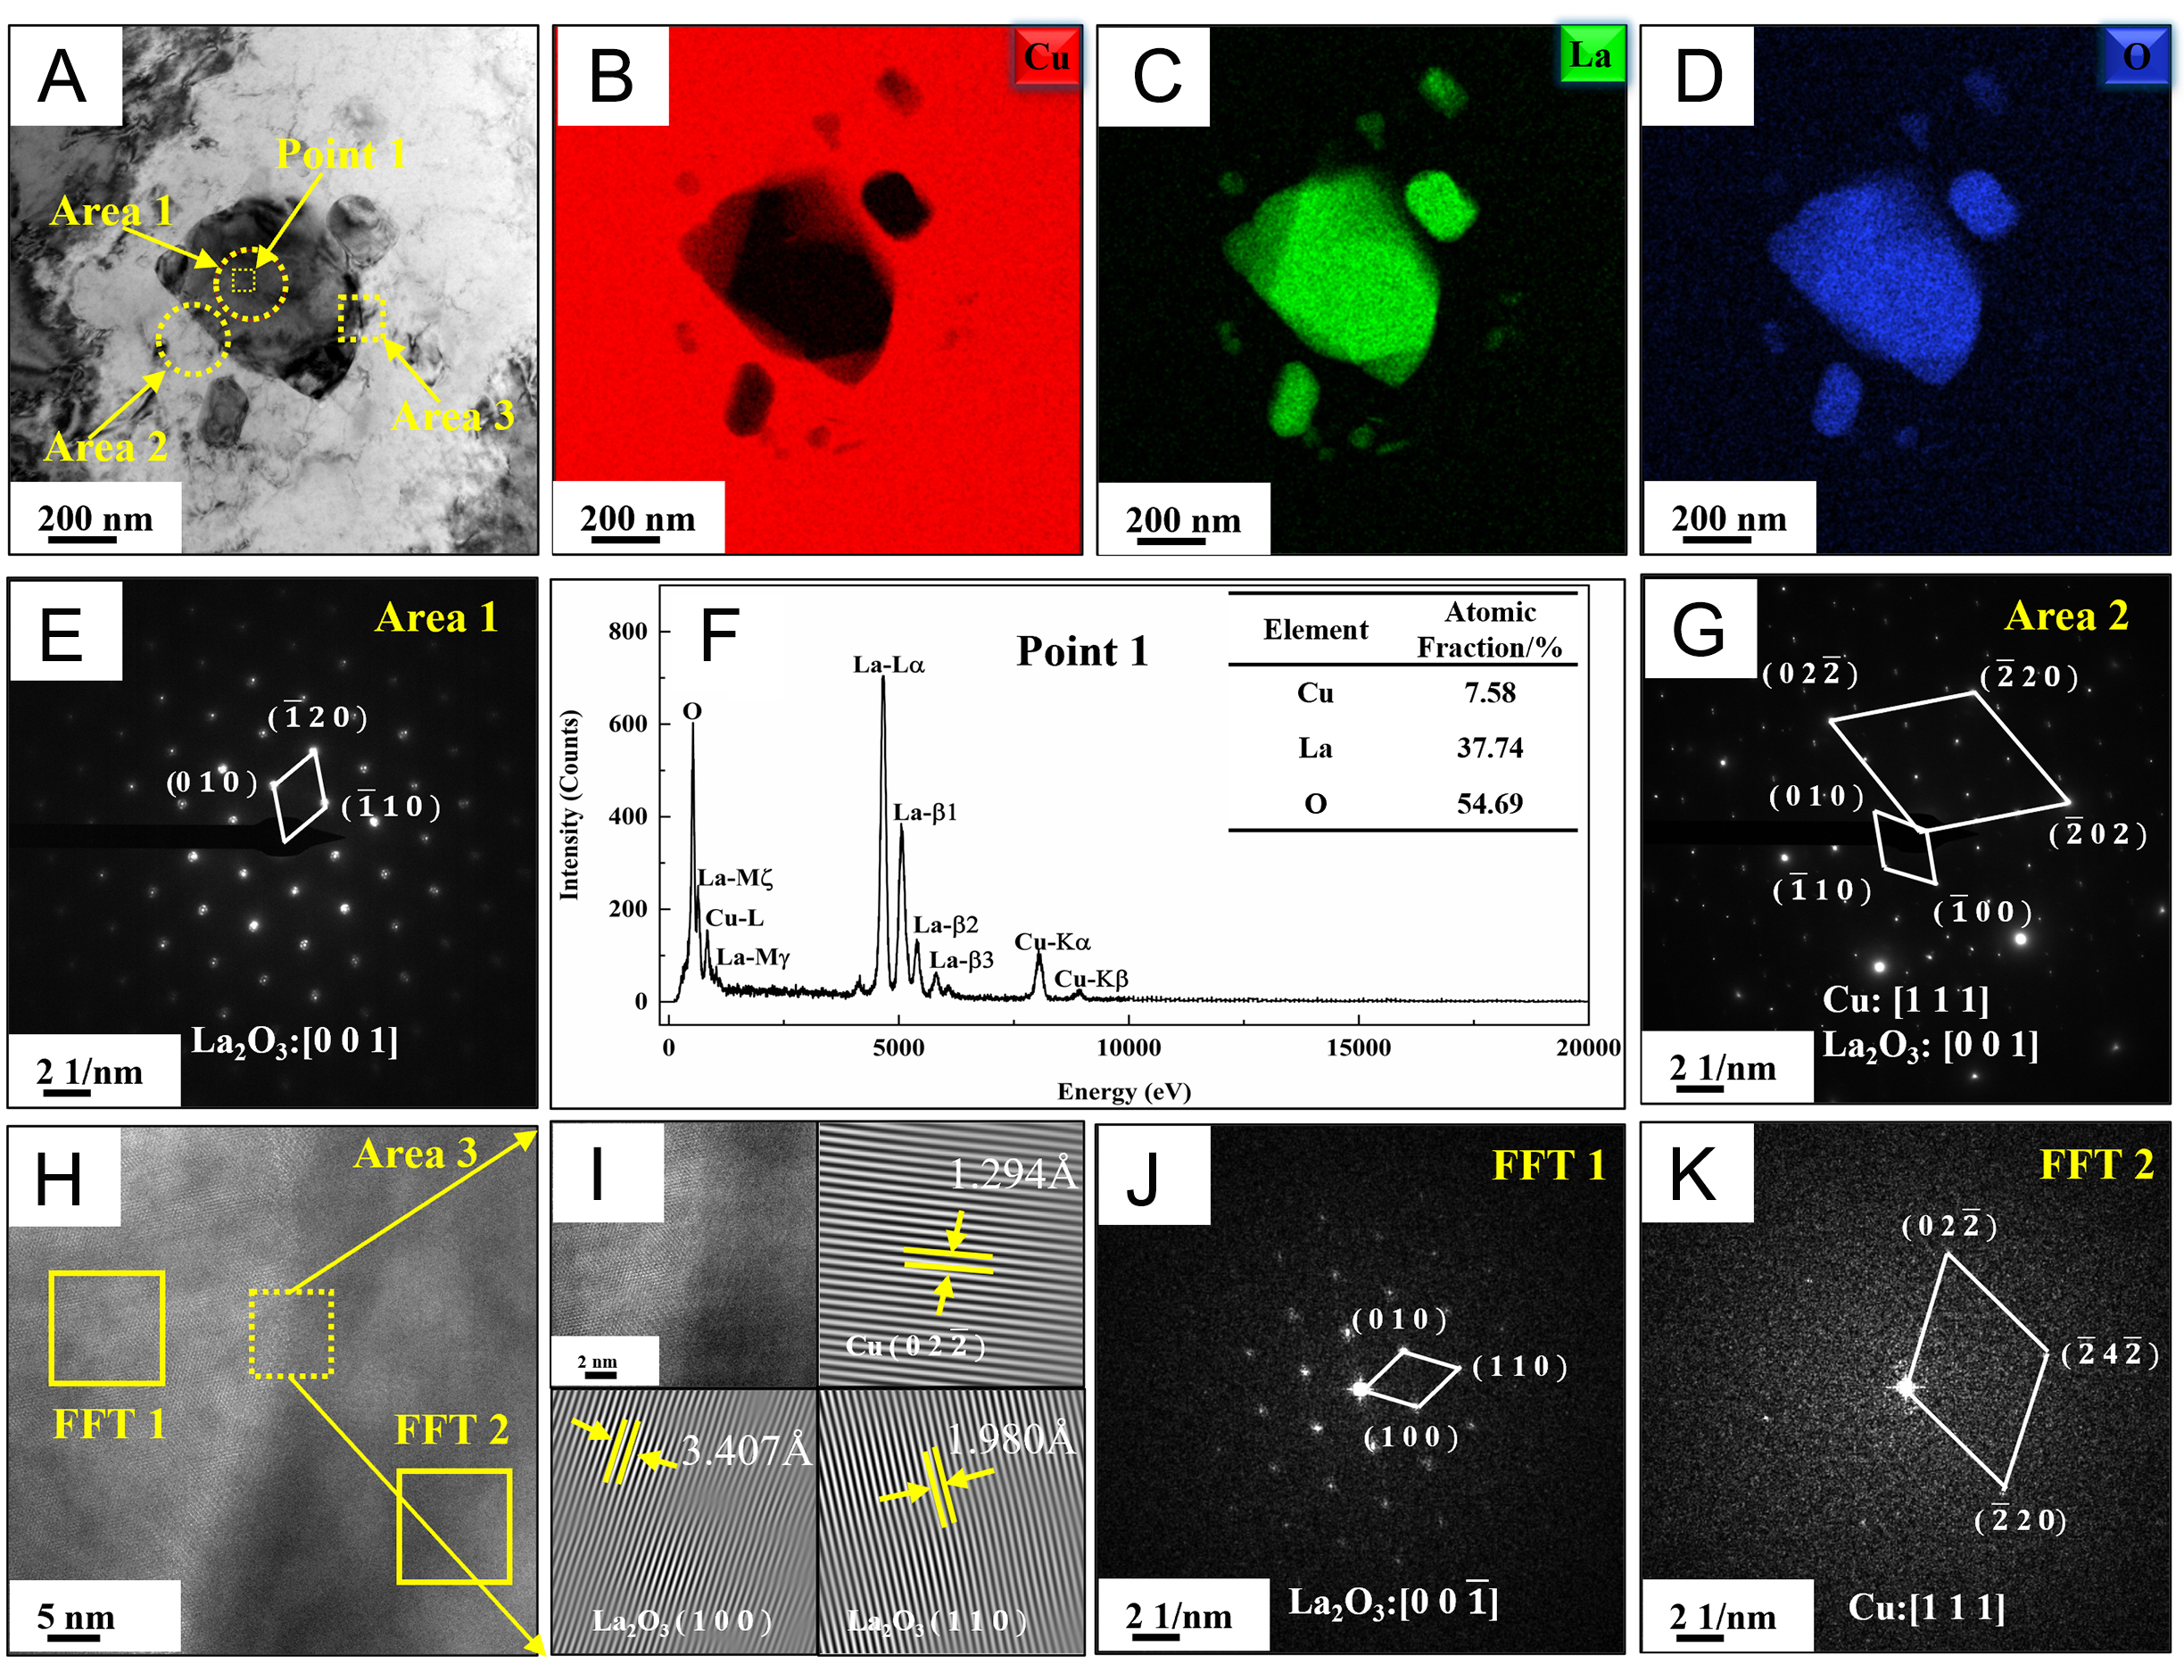
Figure 14. The TEM characterization of second phase in La180 after annealing at 900 °C for 30 min: (A) TEM bright-field images of second phase in La180, (B-D) EDS elemental map in (A), (E) electron diffraction pattern of La2O3 of Area 1, (F) Spectra from Point 1, (G) electron diffraction pattern of Area 2, (H) HRTEM images of Area 3, (I) enlarged image of the HRTEM image of (H) and the inverse Fast Fourier Transform (IFFT) lattice stripes, (J) FFT 1 in (H), (K) FFT 2 in (H).





