


Bioinformatics analysis and experimental validation of m3C RNA methylation regulators in hepatocellular carcinoma: expression, function, and prognostic value
 0
0 Abstract
Aim: Hepatocellular carcinoma (HCC) remains a major challenge due to poor prognosis. This study investigates
Methods: We integrated data from 486 HCC patients [The Cancer Genome Atlas (TCGA) and Gene Expression Omnibus (GEO) datasets] and 16 pairs of clinical tissue samples. The expression, mutation profiles, and prognostic significance of 6 m3C regulators were analyzed. Functional assays, including cell proliferation and migration, were performed, alongside immune infiltration analysis using single-sample gene set enrichment analysis (ssGSEA). Finally, an m3C scoring system was constructed to evaluate prognostic potential.
Results: Most m3C regulators (except METTL8) were upregulated in HCC tissues. Knockdown of METTL2, METTL6, ALKBH1, or ALKBH3, as well as overexpression of METTL8, inhibited HCC cell proliferation and migration. Two distinct m3C modification modes were identified, each associated with unique clinical features. The m3C score was positively correlated with longer overall survival in high-score patients and was associated with tumor mutation burden (TMB) and expression of PD-1 and CTLA4, suggesting its potential to predict immunotherapy response.
Conclusion: This study highlights the genetic variation and prognostic relevance of m3C methylation regulators in HCC and introduces a novel scoring system for prognosis prediction, providing a potential tool to guide HCC treatment strategies.
Keywords
INTRODUCTION
Primary liver cancer is one of the most common malignant tumors of the digestive system and ranks as the third leading cause of cancer-related deaths worldwide, posing a major global healthcare challenge[1,2]. Approximately 866,136 new liver cancer cases and 758,725 deaths occur annually worldwide[3], with hepatocellular carcinoma (HCC) being the predominant pathological subtype[4,5]. HCC is highly invasive and typically asymptomatic in its early stages; by the time clinical symptoms prompt diagnosis, the disease often progresses to an advanced stage, precluding the possibility of radical surgery[6-8]. Although advances in liver transplantation, minimally invasive resection, percutaneous ablation, radiotherapy, interventional therapy, systemic therapy, and immunotherapy have prolonged patient survival[9-13], the 5-year survival rate remains low, and overall prognosis remains poor. Thus, clarifying the pathogenesis of HCC is critical for developing new treatments and personalized medical strategies to improve patient outcomes and long-term survival.
HCC exhibits marked heterogeneity, and its genomic, epigenetic, and molecular expression profiles are critical for unraveling its pathogenesis[11-13]. With the continuous development of high-throughput sequencing technology, numerous RNA post-transcriptional modifications have been identified[14,15]. Transfer RNA (tRNA), one of the most abundant RNA species in cells, acts as a key adaptor in ribosome translation of the genetic code[16,17]. Among these modifications, 3-methylcytidine (m3C) methylation occurs at specific tRNA positions: in the cytoplasm, it is present at position 32 of the anticodon loop of tRNAThr, tRNASer, and tRNAArg, and at positions 20 or 47 of tRNALeu and tRNAMet-e[18]. This modification is essential for maintaining tRNA stability and biological function[19,20].
Notably, m3C methylation differs from other well-studied RNA modifications such as N6-methyladenosine (m6A)-which primarily modulates mRNA splicing, export, and translation. By contrast, m3C is predominantly enriched in tRNAs, where it enhances aminoacylation efficiency and ribosomal decoding fidelity. This unique tRNA targeting suggests that m3C may influence tumorigenesis through distinct mechanisms, such as regulation of protein synthesis in metabolic pathways, cell cycle control, and immune evasion-processes central to HCC pathogenesis.
Recent studies have implicated m3C methylation in tumor development, influencing proliferation, invasion, and metastasis by regulating tumor-related gene expression[21,22]. However, research on m3C is still in its early stages, and its role in tumors is context-dependent, functioning as a “double-edged sword” across cancer types[23,24]. For example, METTL6 promotes HCC cell proliferation by stabilizing tRNAMet, while METTL8 functions as a tumor suppressor in several malignancies. The specific roles of m3C and its key regulators in HCC-whether oncogenic or tumor-suppressive-remain unclear, as do their associations with clinicopathological features. Moreover, most studies have examined only one or two m3C regulators in isolation, neglecting their potential coordinated interactions, despite evidence that antitumor effects often rely on the interplay among multiple regulators. A comprehensive understanding of multi-regulator
Bioinformatics approaches now enable comprehensive analyses of m3C regulators and tumor characteristics[25,26]. Our study integrated relevant data from The Cancer Genome Atlas (TCGA) and Gene Expression Omnibus (GEO) to systematically assess m3C modification patterns in HCC. We examined genetic variations and gene expression of m3C methylation regulators, identified abnormally expressed regulators, and determined core and characteristic genes predictive of HCC prognosis through protein interaction analyses. Furthermore, by building a scoring system based on the m3C modification model, we evaluated patient prognosis according to m3C scores and HCC subtypes. Importantly, our findings reveal a role for m3C modification in promoting HCC progression and suggest a promising target for prognostic prediction and therapeutic intervention.
METHODS
Cell culture and clinical samples
The HCC cell line HepG2 was cultured in DMEM medium (Gibco, USA) supplemented with 10% fetal bovine serum (FBS; HyClone, USA) and 1% penicillin-streptomycin (HyClone, USA) at 37 °C in a humidified incubator with 5% CO2. HepG2 cells were transfected with shMETTL2, shMETTL6, shALKBH1, shALKBH3 or a METTL8 overexpression plasmid. Cells transfected with the empty vector served as controls. Transfections were performed using Lipofectamine 3000 reagent (Invitrogen) following the manufacturer’s protocol. Forty-eight hours after transfection, cells were harvested to assess overexpression or knockdown efficiency via Quantitative Real-time PCR (qRT-PCR). A total of 16 HCC tissues and the corresponding paracancerous tissues were collected from Xijing Hospital between August 2020 and August 2021. This study was approved by the Medical Ethics Committee of the First Affiliated Hospital of the Air Force Medical University and conducted in accordance with the Declaration of Helsinki and good clinical practice guidelines.
HCC data source and preprocessing
Gene expression data and clinical notes were obtained from 371 HCC patients in The Cancer Genome Atlas Liver Hepatocellular Carcinoma (TCGA-LIHC, downloaded March 2023) and 115 patients from the GEO dataset GSE76427 (downloaded April 2023), totaling 486 patients. Patients with incomplete clinical information (e.g., missing survival time, Tumor Node Metastasis (TNM) stage, or gene expression data) were excluded. Table 1 presents the clinical and pathological characteristics of all 486 patients. RNA sequencing data (Fragments Per Kilobase of exon model per Million mapped fragments, FPKM value) from the TCGA dataset were downloaded from the Genomic Data Commons (GDC, https://portal.gdc.cancer.gov/) and converted to transcripts per million (TPM) values. The “ComBat” algorithm in the sva software package was used to correct batch effects caused by non-biological deviation. Copy number variation (CNV) analysis was performed using somatic mutation data obtained from the TCGA database. All analyses were conducted using R software (version 4.2.2) and R Bioconductor packages.
Clinical and pathological characteristics of HCC patients
| Parameters | Values | Total (n = 486) (%) |
| Age | Median (IQR) | 61 (53-70) |
| Range (Min, Max) | 14-93 | |
| ≤ 65 | 297 (61.1%) | |
| > 65 | 188 (38.7%) | |
| Unknown | 1 (0.2%) | |
| Gender | Male | 343 (70.6%) |
| Female | 143 (29.4%) | |
| G stage | 0 | 4 (0.8%) |
| 1 | 129 (26.5%) | |
| 2 | 205 (42.2%) | |
| 3 | 131 (27.0%) | |
| 4 | 12 (2.5%) | |
| Unknown | 5 (1.0%) | |
| TNM stage | I | 226 (46.5%) |
| II | 121 (24.9%) | |
| III | 106 (21.8%) | |
| IV | 8 (1.6%) | |
| Unknown | 25 (5.2%) | |
| Clinical T-stage | T1 | 181 (37.2%) |
| T2 | 94 (19.3%) | |
| T3 | 80 (16.5%) | |
| T4 | 13 (2.7%) | |
| Unknown | 118 (24.3%) | |
| Clinical N-stage | N0 | 252 (51.9%) |
| N1 | 4 (0.8%) | |
| Unknown | 230 (47.3%) | |
| Clinical M-stage | M0 | 266 (54.7%) |
| M1 | 4 (0.8%) | |
| Unknown | 216 (44.5%) |
qRT-PCR
Total mRNA was isolated from liver samples or cells using TRIzol reagent (Merck, 93,289-100 mL) and reverse-transcribed into cDNA with a high-capacity cDNA reverse transcription kit (TAKARA) according to the manufacturer’s instructions. mRNA levels were quantified by qRT-PCR using SYBR Green (TAKARA). The relative expression of each cDNA was calculated using the 2-ΔΔCt method with β-actin as the endogenous control. The primer sequences used in this study are shown in Table 2.
Primer sequences
| Primer name | Primer sequence |
| METTL2A | Forward: 5’-GAAACCTGGCGGGATGATGC-3’ |
| Reverse: 5’-AGCGTGTCCAGTTCCTCTTGT-3’ | |
| METTL2B | Forward: 5’-ACTTCTTCACACAAGAGGAACTG-3’ |
| Reverse: 5’-TCGGCGGTCCACCAGATT-3’ | |
| METTL6 | Forward: 5’-CAGGCAAGGATTCTCACCTCT-3’ |
| Reverse: 5’-TGGTCCAGTGTCTGTCTTTGA-3’ | |
| METTL8 | Forward: 5’-GGGATCACATGCAGTGGTCTA-3’ |
| Reverse: 5’-CCCTCAACAGCCAATTACGAT-3’ | |
| ALKBH1 | Forward: 5’-AAACTTTTCCGCTTCTACCGTC-3’ |
| Reverse: 5’-TTTGAGTCCATAGGCTTGCCA-3’ | |
| ALKBH3 | Forward: 5’-TGGGCTGCCCCTGTTAAAAG-3’ |
| Reverse: 5’-TGTCAATCACTCGTGGCTCAG-3’ | |
| β-Actin | Forward: 5’-CATGTACGTTGCTATCCAGGC-3’ Reverse: 5’-CTCCTTAATGTCACGCACGAT-3’ |
| shMETTL2 | 5’-GCTGAAGATCTGCTGAAAT-3’ |
| shMETTL6 | 5’-CCAGATGTTCTGCTGATTA-3’ |
| LV-METTL8 | Forward: 5’-GGGATCACATGCAGTGGTCTA-3’ Reverse: 5’-CCCTCAACAGCCAATTACGAT-3’ |
| shALKBH1 | 5’-GGTGAAGATGCTGATGAAT-3’ |
| shALKBH3 | 5’-GCTGATGTCTGCTGAAGT-3’ |
CCK8 cell proliferation assay
Cells were digested, centrifuged, and resuspended to obtain a single-cell suspension. Cell counts were calculated using a Bio-Rad automatic cell counter. In a 96-well plate, 3,000 cells were seeded per well, with five replicate wells per group. Treated cells were maintained in the 96-well plates, and cell viability was measured daily for five days using the Cell Counting Kit-8 (CCK8, GLPBIO, USA).
Cell wound healing assay (scratch migration test)
Horizontal reference lines were drawn on the back of 6-well plates using a ruler. Cells in the logarithmic growth phase were seeded at 1 × 10⁶ cells/mL (200 μL per well) and cultured overnight. A pipette tip was used to create scratches perpendicular to the reference lines. Cells were washed three times with phosphate buffer saline (PBS) to remove detached cells, then incubated in serum-free medium at 37 °C with 5% CO2. Images of the wound area were captured at 0 and 24 h.
Unsupervised clustering of m3C regulators
Six regulators (METTL2A, METTL2B, METTL6, METTL8, ALKBH1, and ALKBH3) were extracted from the TCGA dataset to identify m3C modification patterns. Interaction information for these regulators was obtained from the STRING database (https://string-db.org), and a protein-protein interaction (PPI) network was constructed based on expression relationships. Unsupervised clustering was performed on the expression profiles of these six m3C regulators to identify distinct modification patterns and classify patients for further analysis. Cluster number and stability were determined using a consensus clustering algorithm. The ConsensusClusterPlus package was used to perform the analysis, repeated 1,000 times to ensure classification stability.
Gene set variation analysis and functional annotation
To investigate differences in biological processes associated with m3C modification, Gene Set Variation Analysis (GSVA) enrichment analysis was conducted using the “GSVA” R package. GSVA is a nonparametric, unsupervised method typically used to estimate changes in pathway and biological process activity in expression datasets. The “c2. cp. Kegg. v7.4. symbols” gene set was downloaded from the MSigDB database for GSVA analysis. Corrected P values < 0.05 were considered statistically significant. Functional annotation of m3C-related genes was performed using the clusterProfiler package.
Estimation of tumor microenvironment cell infiltration
The single-sample gene set enrichment analysis (ssGSEA) algorithm was applied to quantify the relative abundance of tumor microenvironment (TME)-infiltrating cells. Gene sets defining each TME immune cell type were obtained from Charoentong et al.[27], encompassing human immune cell subtypes such as activated CD4+ and CD8+ T cells, dendritic cells, macrophages, natural killer cells, and regulatory T cells. The ssGSEA enrichment scores represented the relative abundance of each TME-infiltrating cell in each sample.
Identification of differentially expressed genes among m3C phenotypes
Patients were classified into three m3C modification modes according to the expression of the six regulators. The empirical Bayesian method in the limma R package was used to identify differentially expressd genes (DEGs) among these modes. DEGs were considered significant at an adjusted P value < 0.001.
m3C score system
To quantify m3C modification patterns in individual tumors, an m3C scoring system was developed. DEGs from different m3C clusters were normalized, and overlapping genes were identified. Unsupervised clustering was performed on these overlapping DEGs, and a consensus clustering algorithm determined the number and stability of gene groups. Genes significantly associated with prognosis were identified using a univariate Cox regression model, and principal component analysis (PCA) was conducted to construct m3C prognosis-related genes. The m3C score was calculated as: m3C score = Σ (PC1i+PC2i), where i represents the expression level of each m3C prognosis-related gene. Immunophenotypic score (IPS, developed by Charoenton, predict responses to CTLA-4 and PD-L1 antibodies. Correlations between IPS subgroups and m3C molecular groups were evaluated in this study.
Statistical analysis
All statistical analyses were performed using R software (V4.2.2). Repeated one-way ANOVA was used for CCK and wound healing assay results. Categorical variables were analyzed with the chi-square or Fisher’s exact test. Gene expression differences between groups were assessed using the Wilcoxon or Kruskal-Wallis test. Pearson or Spearman correlation analyses were conducted to evaluate relationships between variables. A univariate Cox regression model was used to calculate risk ratios for associated genes. Statistical significance was defined as P < 0.05.
RESULTS
Expression of m3C-related molecules in HCC and their effects on HCC cell lines
To validate the expression of m3C regulators in clinical liver cancer specimens, we collected tumor and adjacent non-tumor tissues from 16 patients in our hospital. We then measured the relative mRNA levels of m3C regulators. The results showed that, except for METTL8, which was expressed at significantly lower levels in tumor tissues compared with adjacent tissues, the expression of all other m3C regulators was significantly higher in tumor tissues [Figure 1A]. To examine the biological functions of these regulators in HCC, we established lentivirus-based cell lines with knockdown of METTL2, METTL6, ALKBH1, and ALKBH3, as well as overexpression of METTL8, based on their differential expression patterns observed in HCC tissues by qRT-PCR. To assess cell proliferation and migration, we performed CCK8 assays and wound healing (scratch migration) tests. The wound healing assay demonstrated that knockdown of METTL2, METTL6, ALKBH1, and ALKBH3, as well as overexpression of METTL8, significantly reduced the migratory capacity of HCC cells compared with controls [Figure 1B]. Similarly, clone formation assays showed that these manipulations also inhibited HCC cell proliferation [Figure 1C], consistent with the results of the CCK8 assay.
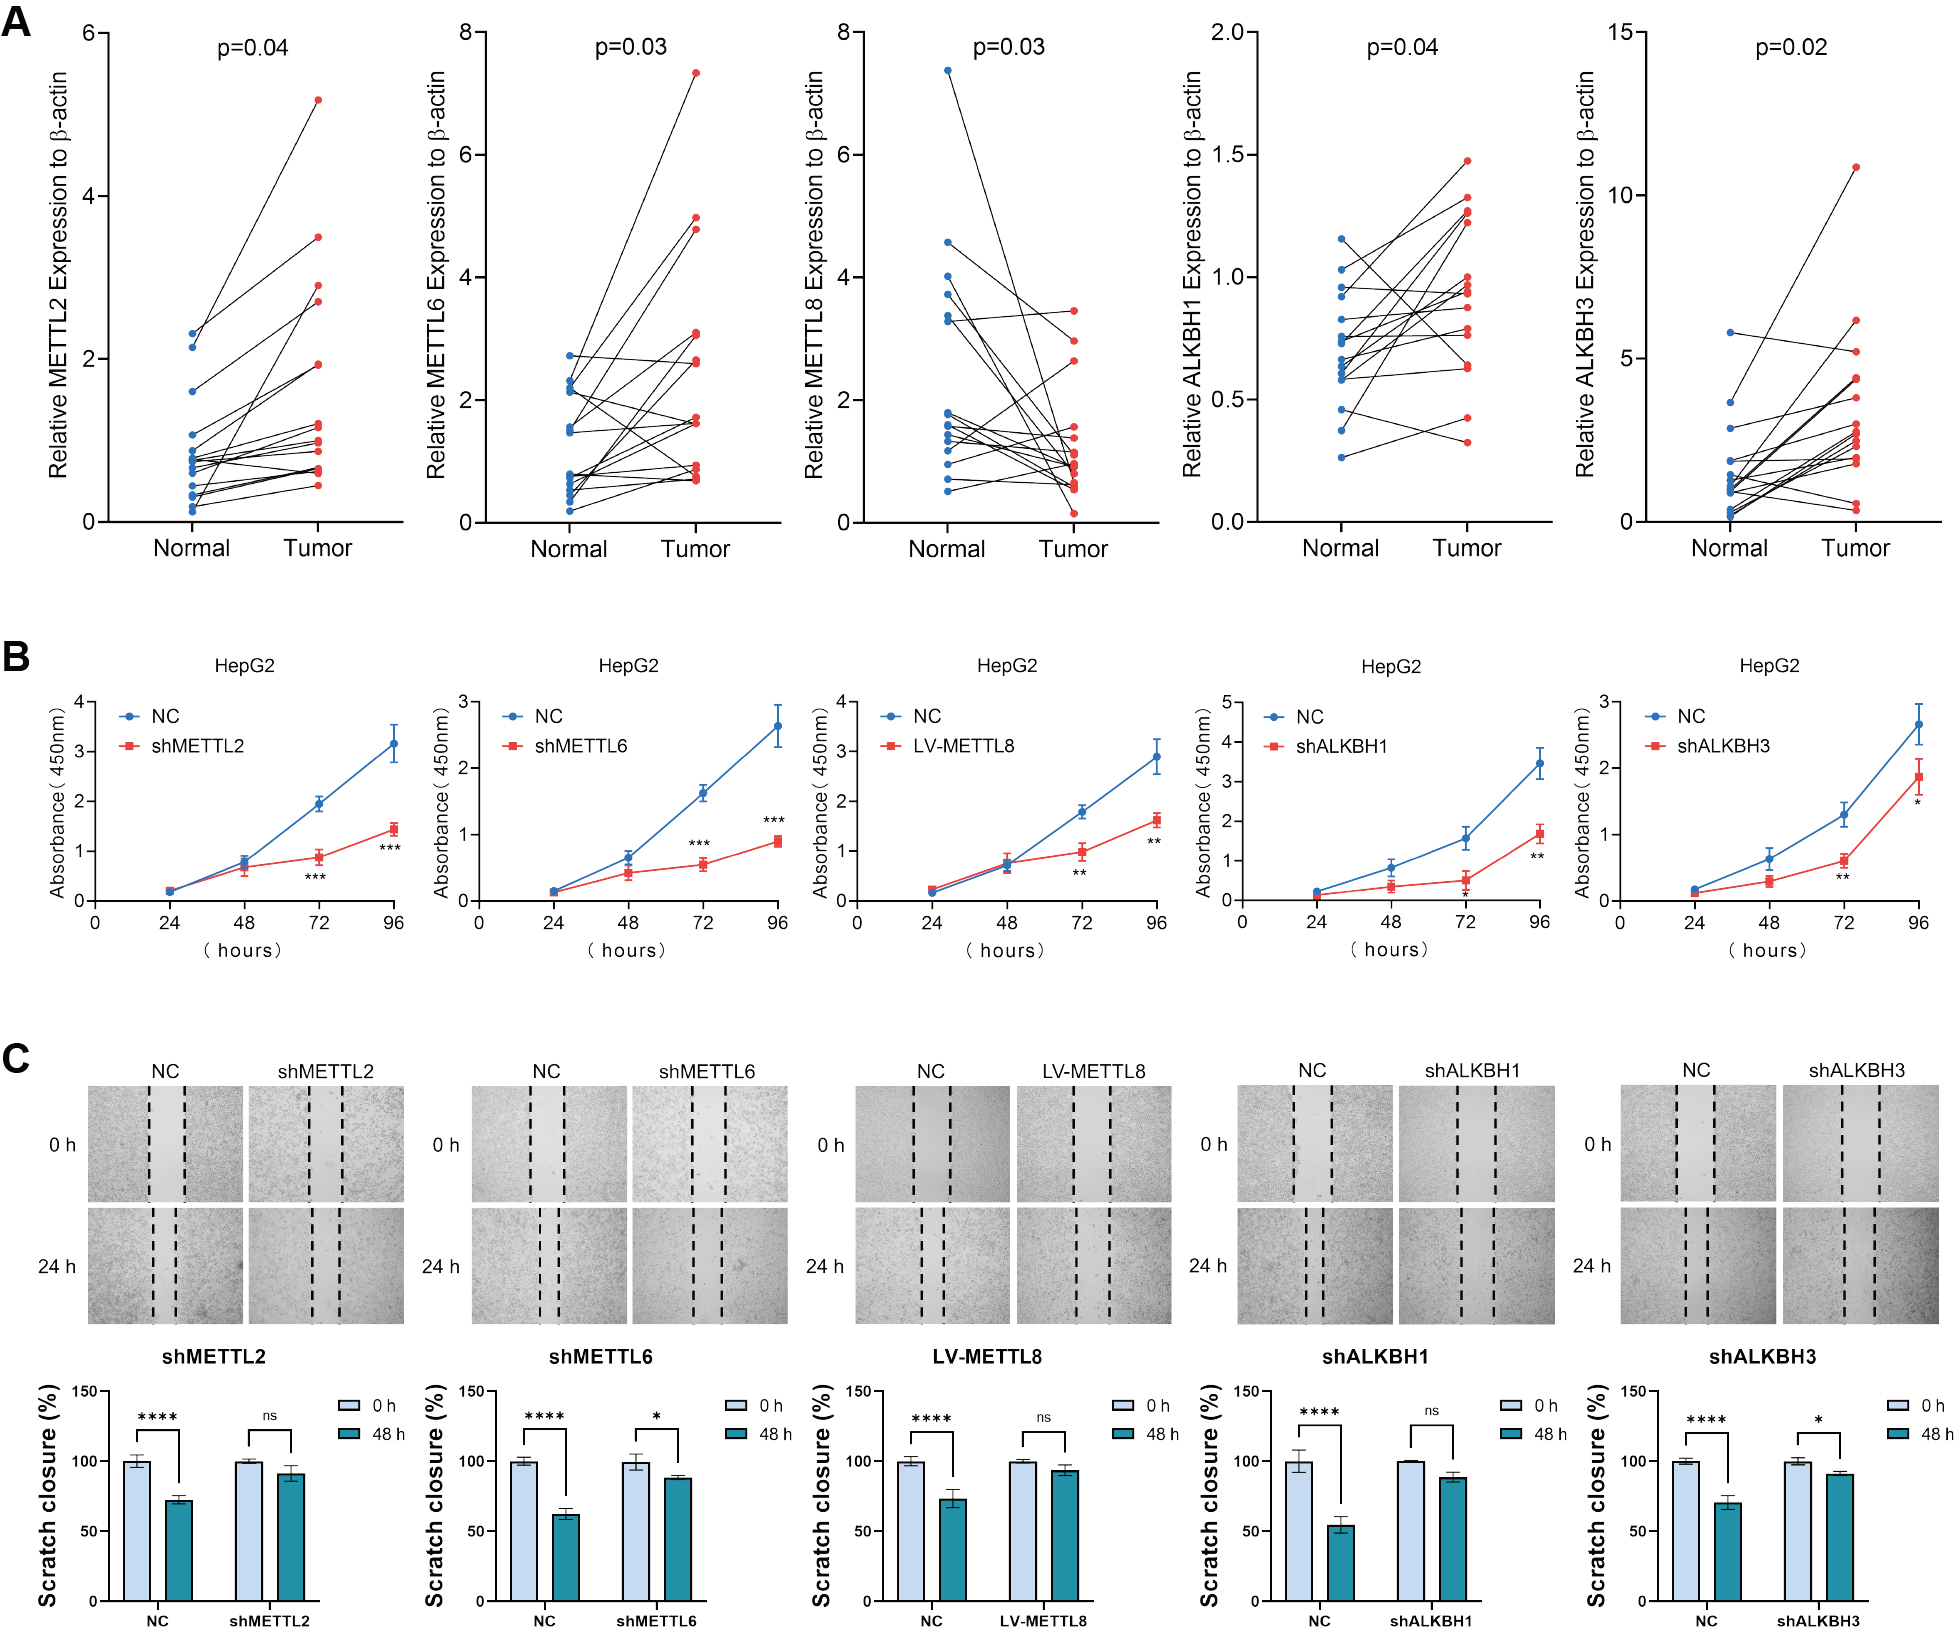
Figure 1. Expression of m3C-related molecules in HCC and their effects on HCC cell lines. (A) Relative mRNA expression levels of six m3C regulators in 16 pairs of HCC and adjacent tissues measured by qRT-PCR; (B) CCK8 assay assessing HCC cell proliferation following m3C regulator knockdown or overexpression; (C) Wound healing assay evaluating changes in cell migration ability after overexpression or downregulation of m3C regulators. (**** P < 0.0001, *** P <0.001, ** P <0.01, * P < 0.05, ns: not significant, P > 0.05). HCC: Hepatocellular carcinoma; m3C: 3-methylcytidine; qRT-PCR: quantitative real-time PCR.
Genetic variation of m3C regulators in HCC
A PPI network of six m3C regulators was established using the STRING database, with different colors indicating their distinct functions [Figure 2A]. CNV analysis revealed noticeable alterations in m3C regulators [Figure 2B] and their chromosomal locations are shown in Figure 2C. To assess whether these genetic mutations influence m3C regulator expression in HCC, we analyzed the mRNA expression levels of regulators in both tumor and adjacent non-tumor samples. Based on database-derived results, differential expression analysis showed that METTL2A, METTL2B, and METTL6 were significantly dysregulated between HCC and paracancerous tissues [Figure 2D]. The distribution of these expression differences is presented in Figure 2E. Mutation frequency analysis demonstrated that four m3C-related genes were mutated in 8 of 371 samples (2.16%), with most m3C regulators exhibiting low mutation rates (< 1%). Only METTL2B showed a relatively higher mutation rate (4/371), indicating that m3C regulators are largely conserved and stable during HCC progression [Figure 2F]. Correlation analysis further revealed significant associations among m3C regulators [Figure 2G]. Survival analyses using TCGA and GEO cohorts indicated that six m3C genes were closely associated with the prognosis of HCC patients [Figure 2H]. A prognostic network was constructed to illustrate the interactions between m3C-related genes and patient outcomes, highlighting the strong relationship between m3C regulators and HCC prognosis [Figure 2I]. Collectively, these results indicate that variations in the expression of m3C regulators may play a critical role in the initiation and progression of HCC.
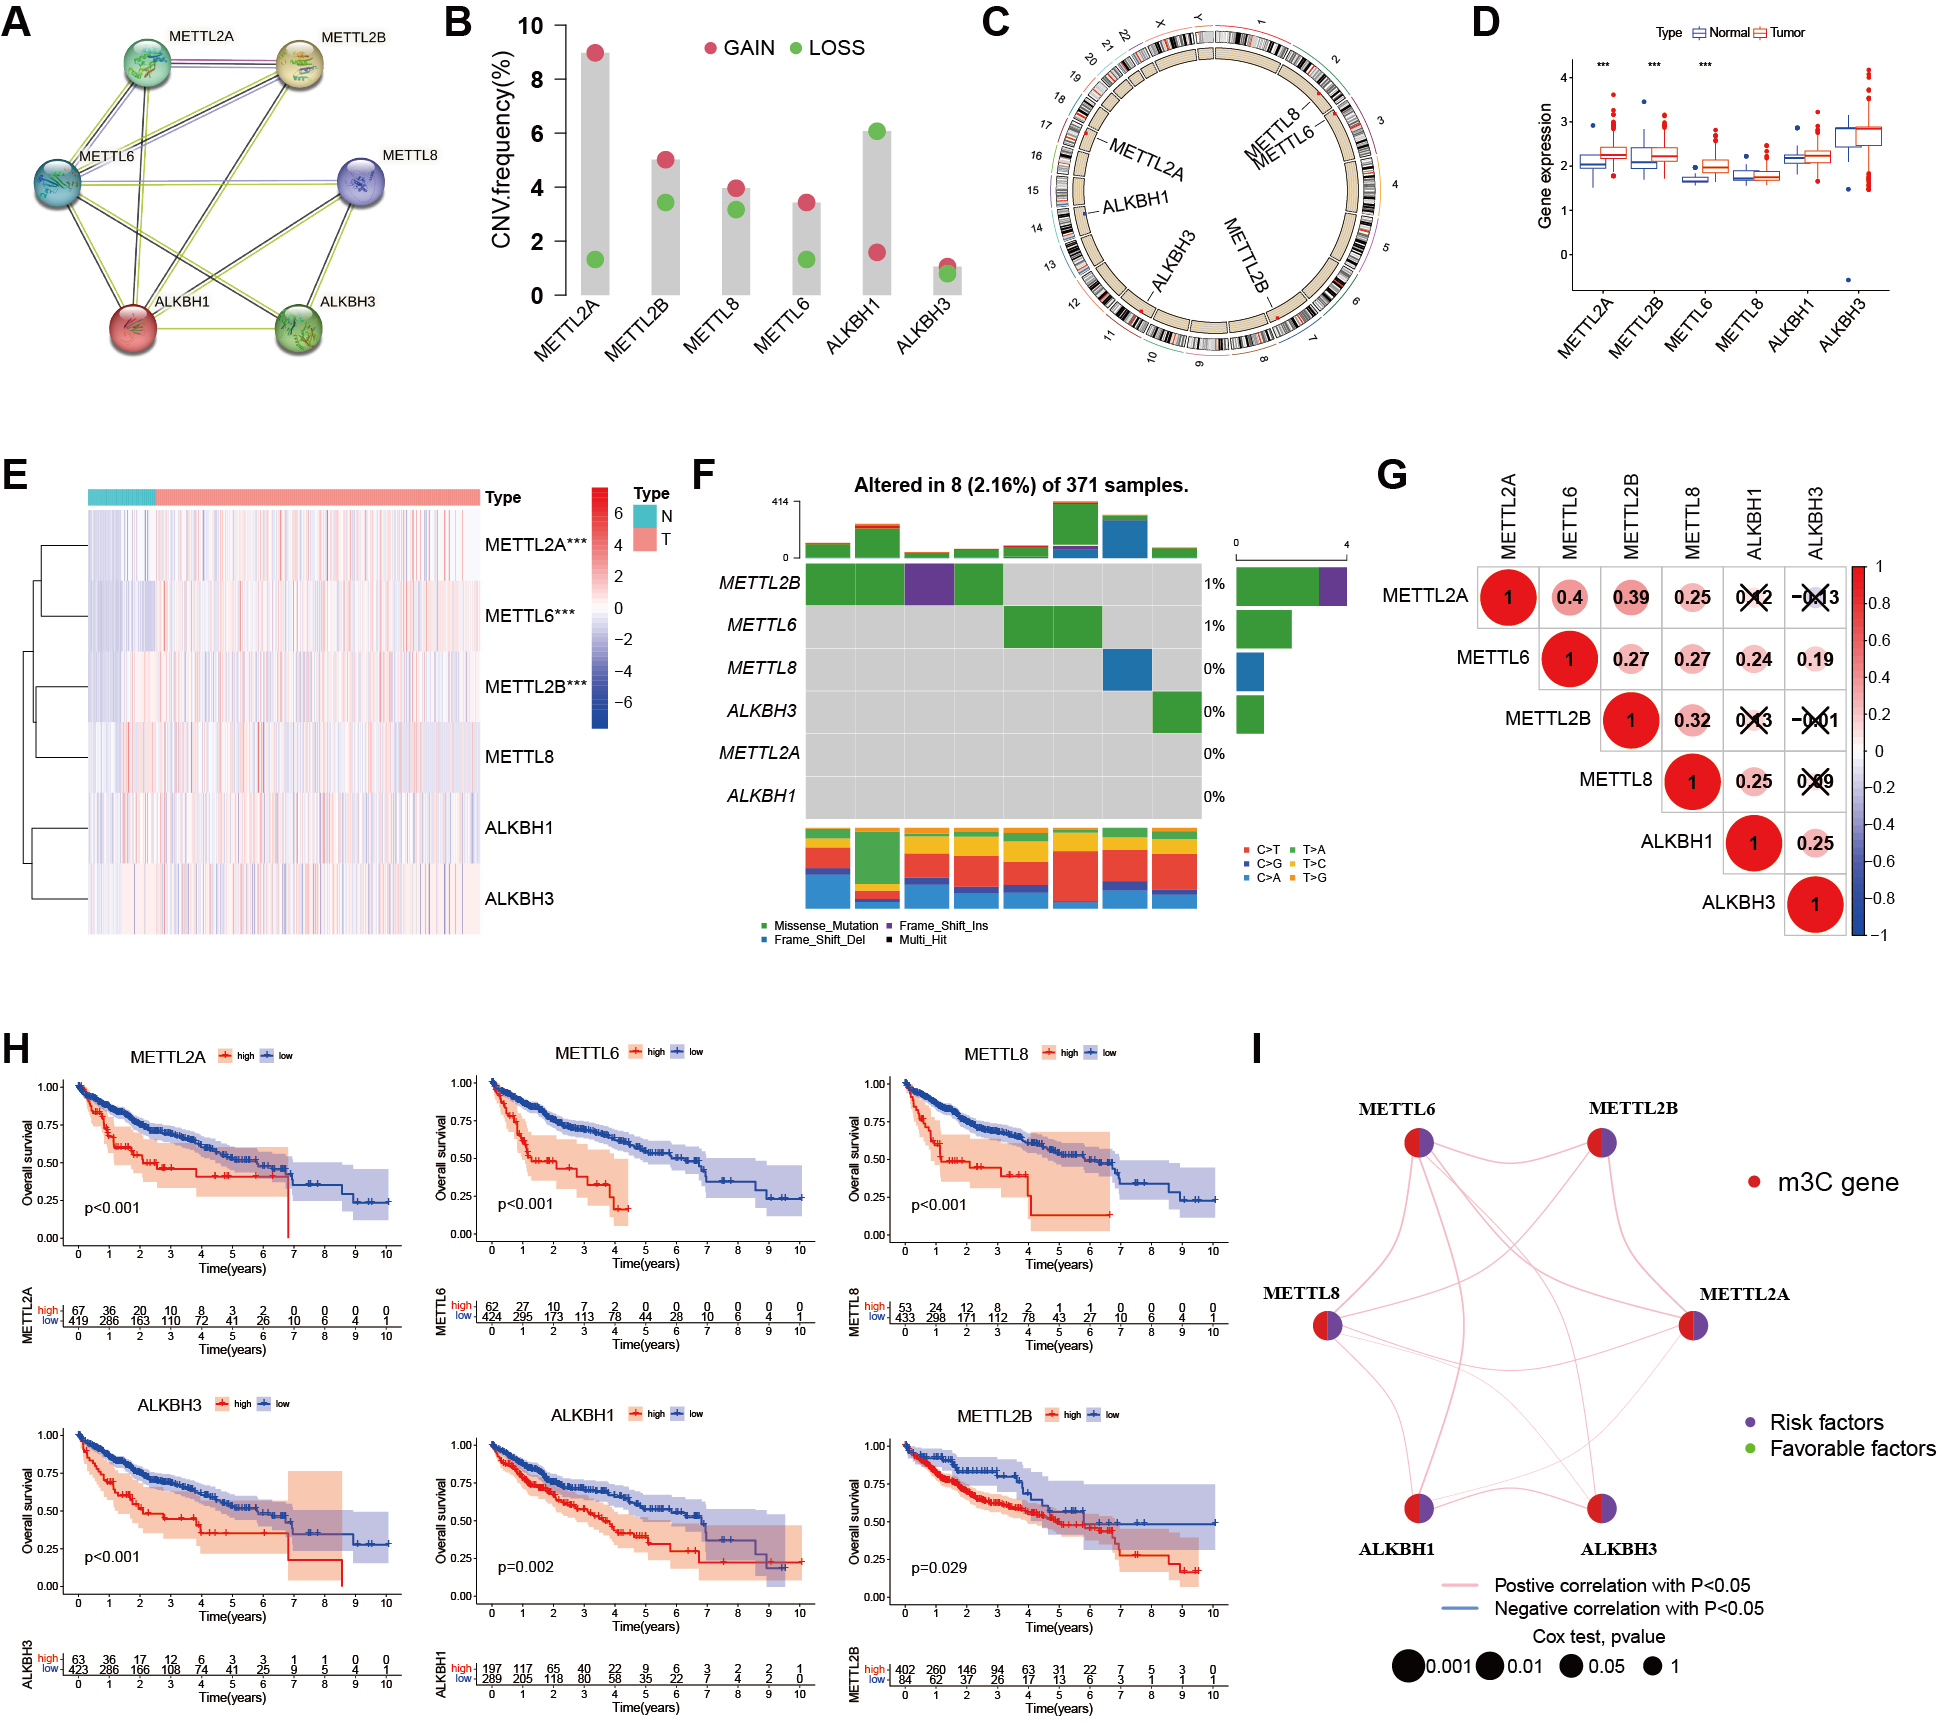
Figure 2. Genetic variation of m3C regulators in liver cancer. (A) PPI network of six m3C regulators constructed using the STRING database; (B) Histogram showing the CNV frequency of the six m3C regulators; (C) Chromosomal locations of CNV alterations in m3C regulators; (D) Boxplot comparing m3C regulator expression levels in normal and cancer samples (*** P < 0.001, ** P < 0.01, * P < 0.05, ns > 0.05); (E) Heatmap of mRNA expression levels of m3C regulators in normal and cancer samples (same significance notation as in D); (F) Mutation frequency of m3C regulators in the TCGA-LIHC cohort (n = 371). The discrepancy with the total cohort size (n = 486) is due to 115 GEO cases lacking somatic mutation data; (G) Pearson correlation analysis of the six m3C methylation regulators in HCC; (H) Prognostic analysis of six m3C regulators using TCGA and GEO databases; (I) Prognostic network showing co-expression relationships among the six m3C regulators. Peripheral nodes represent m3C-related genes, and connections indicate co-expression relationships. Node size reflects the prognostic impact of each regulator. Statistical significance was determined by Cox analysis (P < 0.001, P < 0.01, P < 0.05, P < 1). HCC: Hepatocellular carcinoma; m3C: 3-methylcytidine; PPI: protein-protein interaction; CNV: copy number variation; TCGA-LIHC: the cancer genome atlas liver hepatocellular carcinoma; GEO: gene expression omnibus; ns: not significant.
Determination of the m3C modification model
To explore the role of m3C regulators in prognostic outcomes and clinicopathological characteristics of HCC patients, we used the “CONSENSES Cluster Plus” tool to perform unsupervised clustering of HCC patient data based on m3C methylation regulators. As shown in Figure 3A, the most stable clustering result was obtained when k = 2. Principal component analysis confirmed that this classification method effectively distinguished the two subgroups. Boxplot analysis revealed significant differences in the expression of m3C molecules between the two genotypes [Figure 3C]. Heatmap analysis further demonstrated distinct distributions of clinical features across the two m3C subgroups [Figure 3D]. GSVA was then conducted, revealing pathway-level differences between the two groups [Figure 3E]. Finally, differential analysis of immune cell infiltration was performed using the ssGSEA method, and the resulting immune cell scores were compared between groups. The boxplot illustrated differential expression of m3C in relation to specific immune cell populations [Figure 3F].
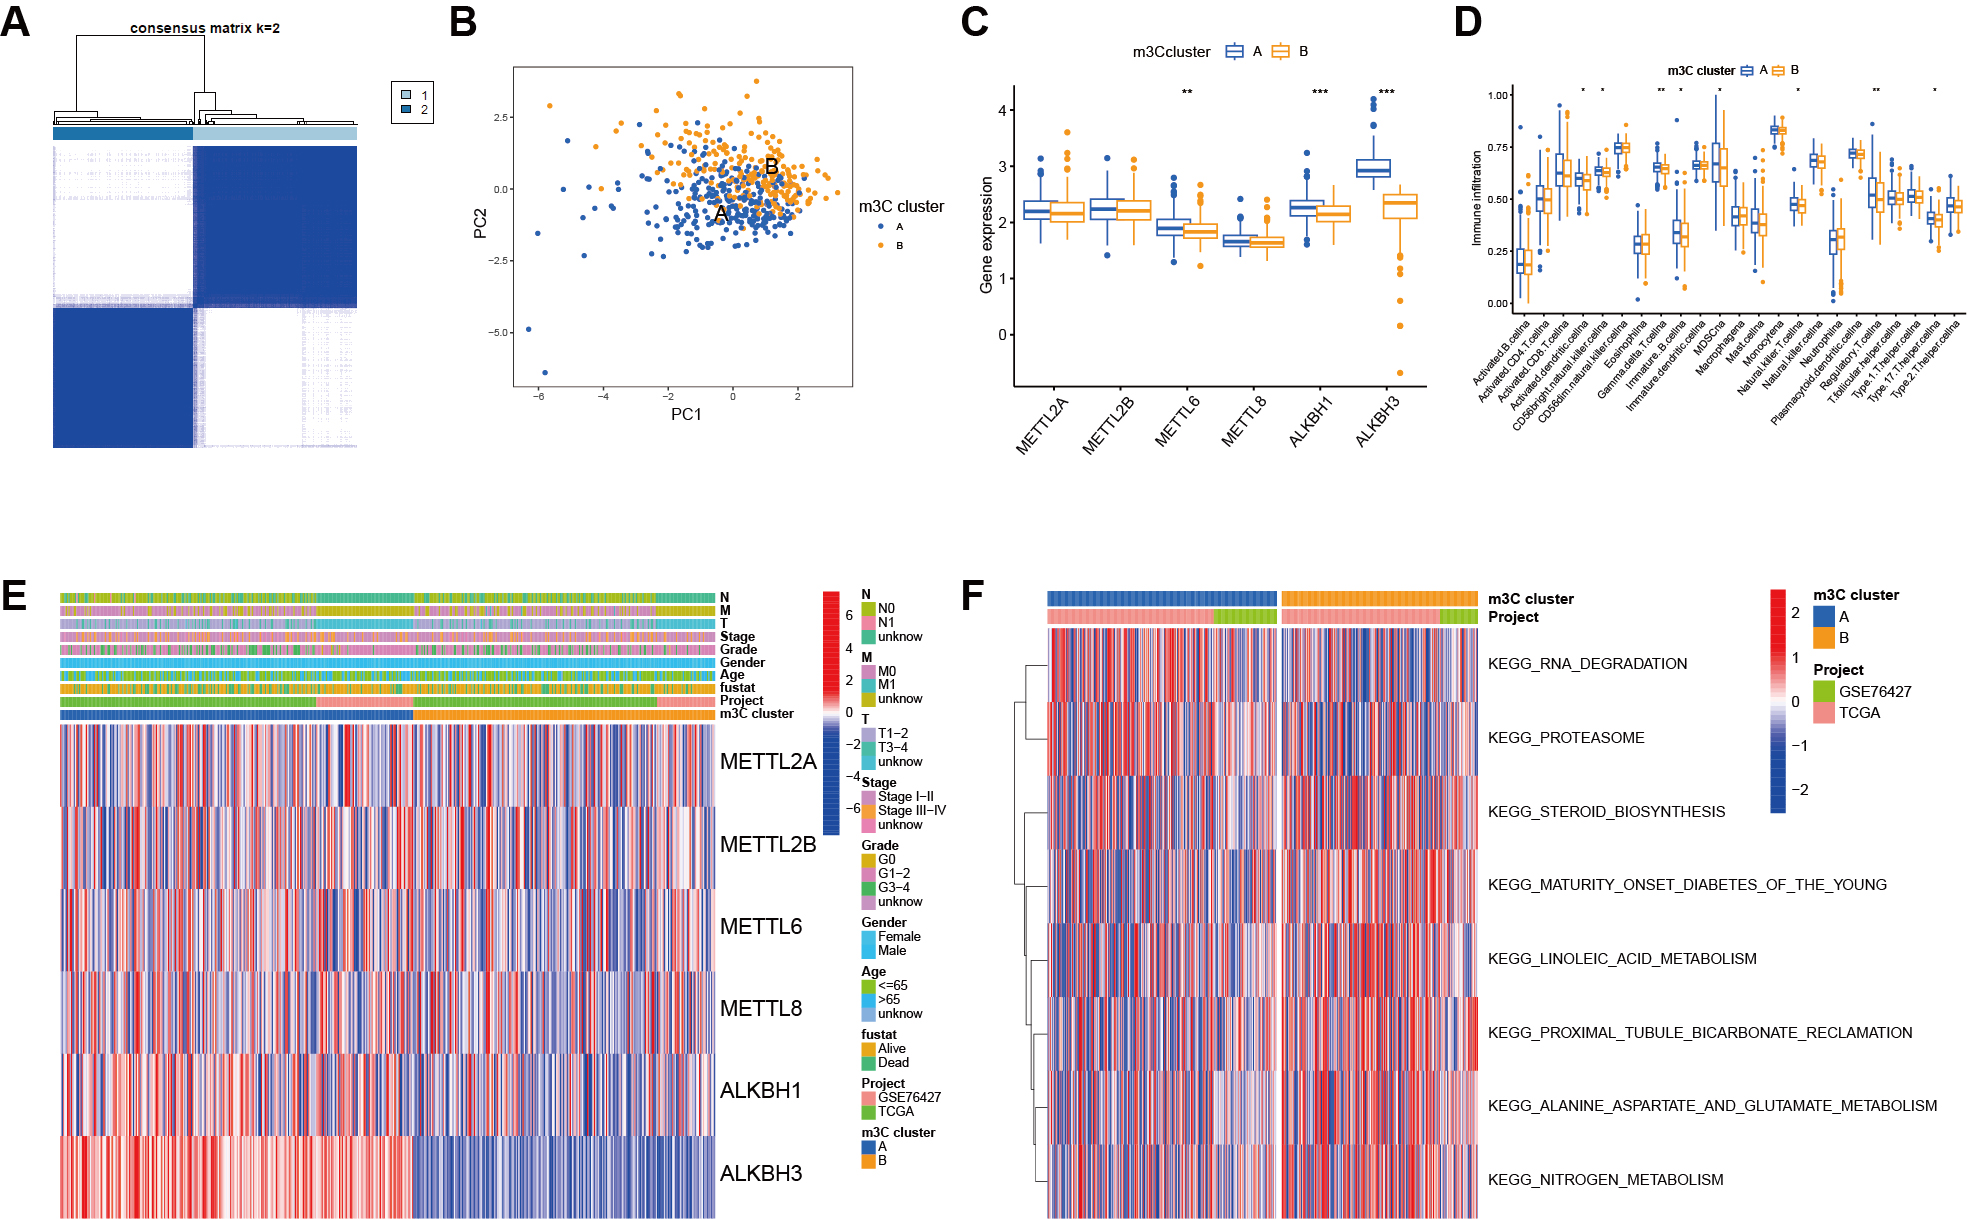
Figure 3. Determination of the m3C modification mode. (A) Two stable subgroups were identified based on the expression similarity of m3C methylation regulators; (B) PCA confirmed that m3C-related genes could distinguish samples between the two subtypes; (C) Boxplot showing differential m3C expression across genotypes; (D) Heatmap illustrating distinct clinical feature distributions between m3C subgroups; (E) GSVA enrichment analysis highlighting biological differences between the two m3C modification modes; (F) ssGSEA analysis showing the abundance of TME-infiltrating cells across the two m3C modification modes.(***P < 0.001, **P < 0.01, *P < 0.05, ns > 0.05). m3C: 3-methylcytidine; PCA: principal component analysis; GSVA: gene set variation analysis; ssGSEA: single-sample gene set enrichment analysis; TME: tumor microenvironment.
Functional annotation of m3C-related genes
Although HCC patients were uniformly clustered using a consensus clustering algorithm, the potential genetic alterations among these m3C-related genes and their functional interactions remain unclear. To address this, we identified the overlapping DEGs between the two m3C clusters. Figure 4A presents the protein-protein interaction network of these DEGs. Interaction data were obtained from the STRING database, and the PPI network was constructed based on expression relationships, with a cut-off interaction score of 0.9 (highest confidence). Kyoto Encyclopedia of Genes and Genomes (KEGG) enrichment analysis revealed that the DEGs were primarily enriched in RNA degradation and endocytosis pathways [Figure 4B]. Gene Ontology (GO) enrichment analysis was then performed to further characterize the functional roles of these DEGs, as shown in the bar and bubble plots. The results [Figure 4C] demonstrated that differential genes were distributed across nearly all cellular functions. In the biological process (BP) category, they were predominantly associated with macroautophagy. In the cellular component (CC) category, enrichment was observed in spliceosomal complexes, which are key structures for pre-mRNA splicing, consistent with m3C’s role in post-transcriptional regulation. In the molecular function (MF) category, the DEGs were mainly associated with ubiquitin-like protein binding.
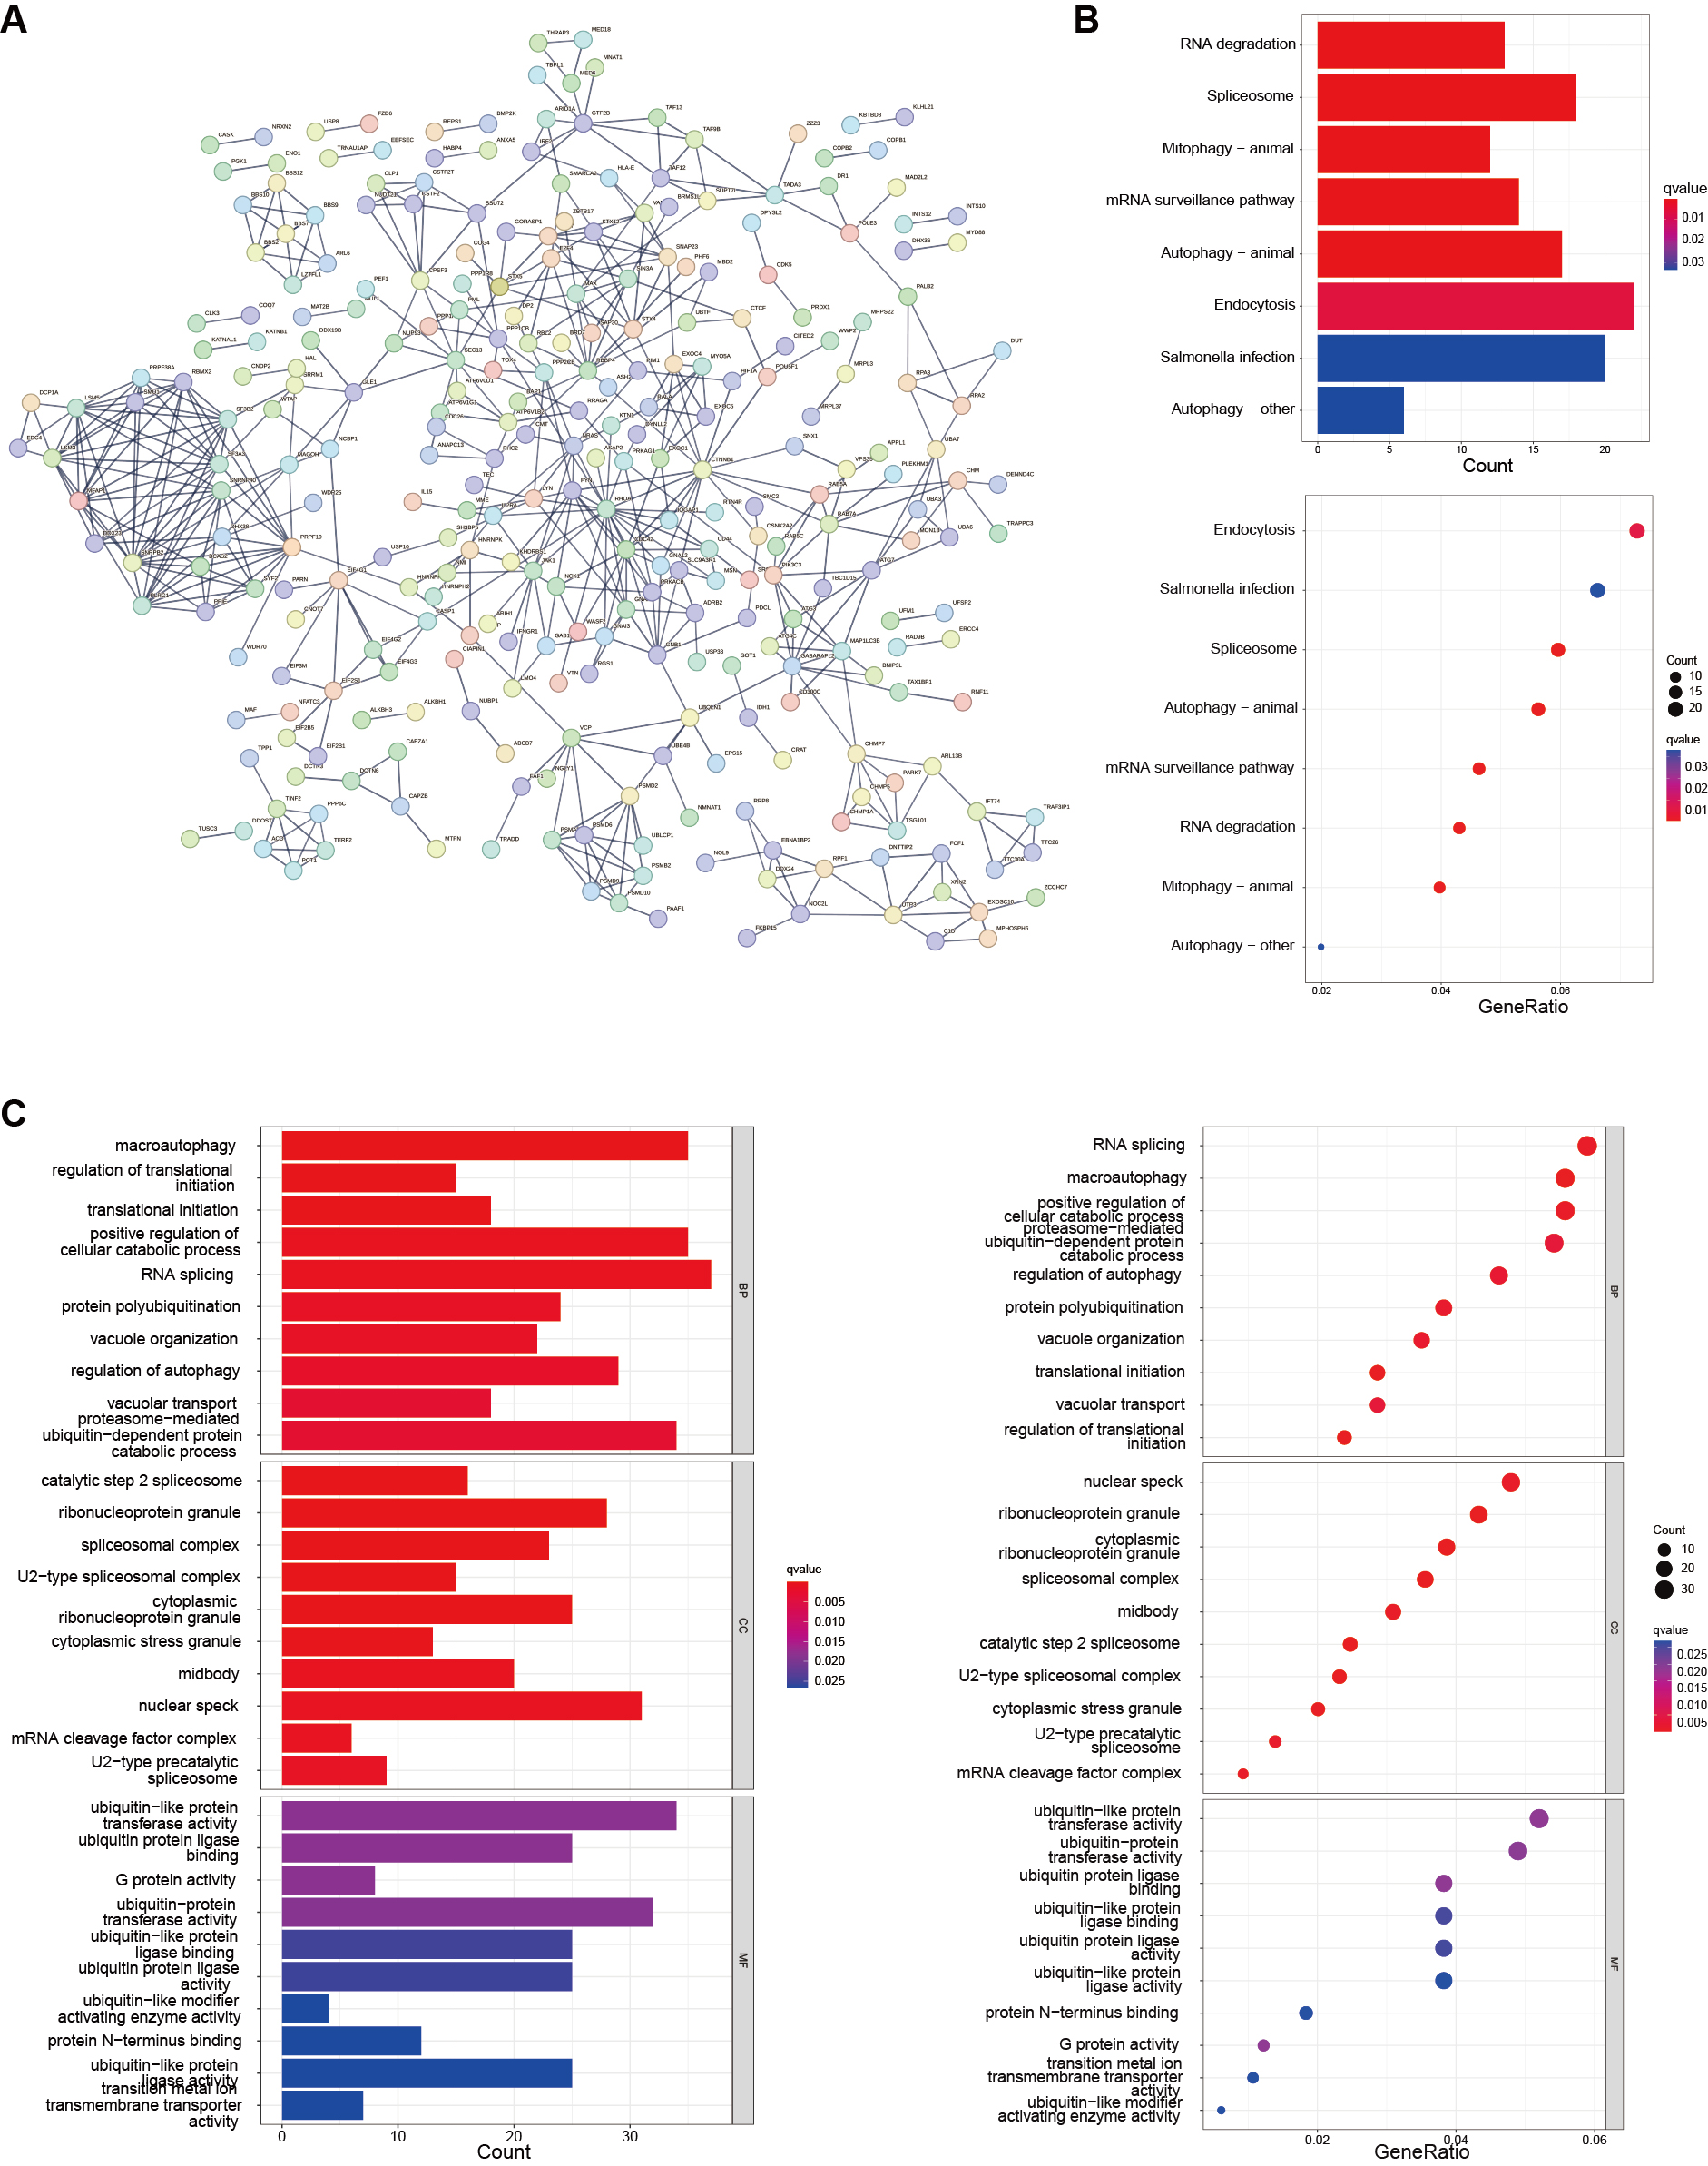
Figure 4. Functional characterization of m3C-related subgroups. (A) A total of 676 DEGs were identified from the intersection of two m3C-defined clusters, and a PPI network was constructed; (B) KEGG enrichment analysis of DEGs, where bar and bubble color depth represents the number of enriched genes; (C) GO enrichment analysis of DEGs across biological process (BP), cellular component (CC), and molecular function (MF) categories. m3C: 3-methylcytidine; PPI: protein-protein interaction; DEGs: differentially expressd genes; KEGG: kyoto encyclopedia of genes and genomes; GO: gene ontology.
Construction of m3C gene subgroups
We performed survival analysis on individual genes using the database to identify prognosis-related genes. Next, we conducted unsupervised consensus clustering, which classified the patients into three distinct m3C gene subgroups [Figure 5A]. Kaplan-Meier survival curves were then plotted for HCC patients according to genotype [Figure 5B]. The results showed significant differences among the three m3C subgroups, with patients in genotype A having the poorest prognosis (P < 0.001). In the box plot, the abscissa represents m3C-related genes and the ordinate indicates gene expression [Figure 5C]. The results demonstrated differential expression of m3C-related molecules across the three subgroups, with most of these genes showing high expression in genotype A. The heatmap based on genotype further illustrated gene expression patterns [Figure 5D], where the abscissa represents samples, the ordinate represents genes, and colors (blue and yellow) indicate subgroup classification. Clinical information was displayed at the top of the heatmap, highlighting distinct clinical characteristics across subgroups. Additionally, immune cell analysis revealed differential expression of m3C-related genes in tumor-infiltrating immune cells [Figure 5E].
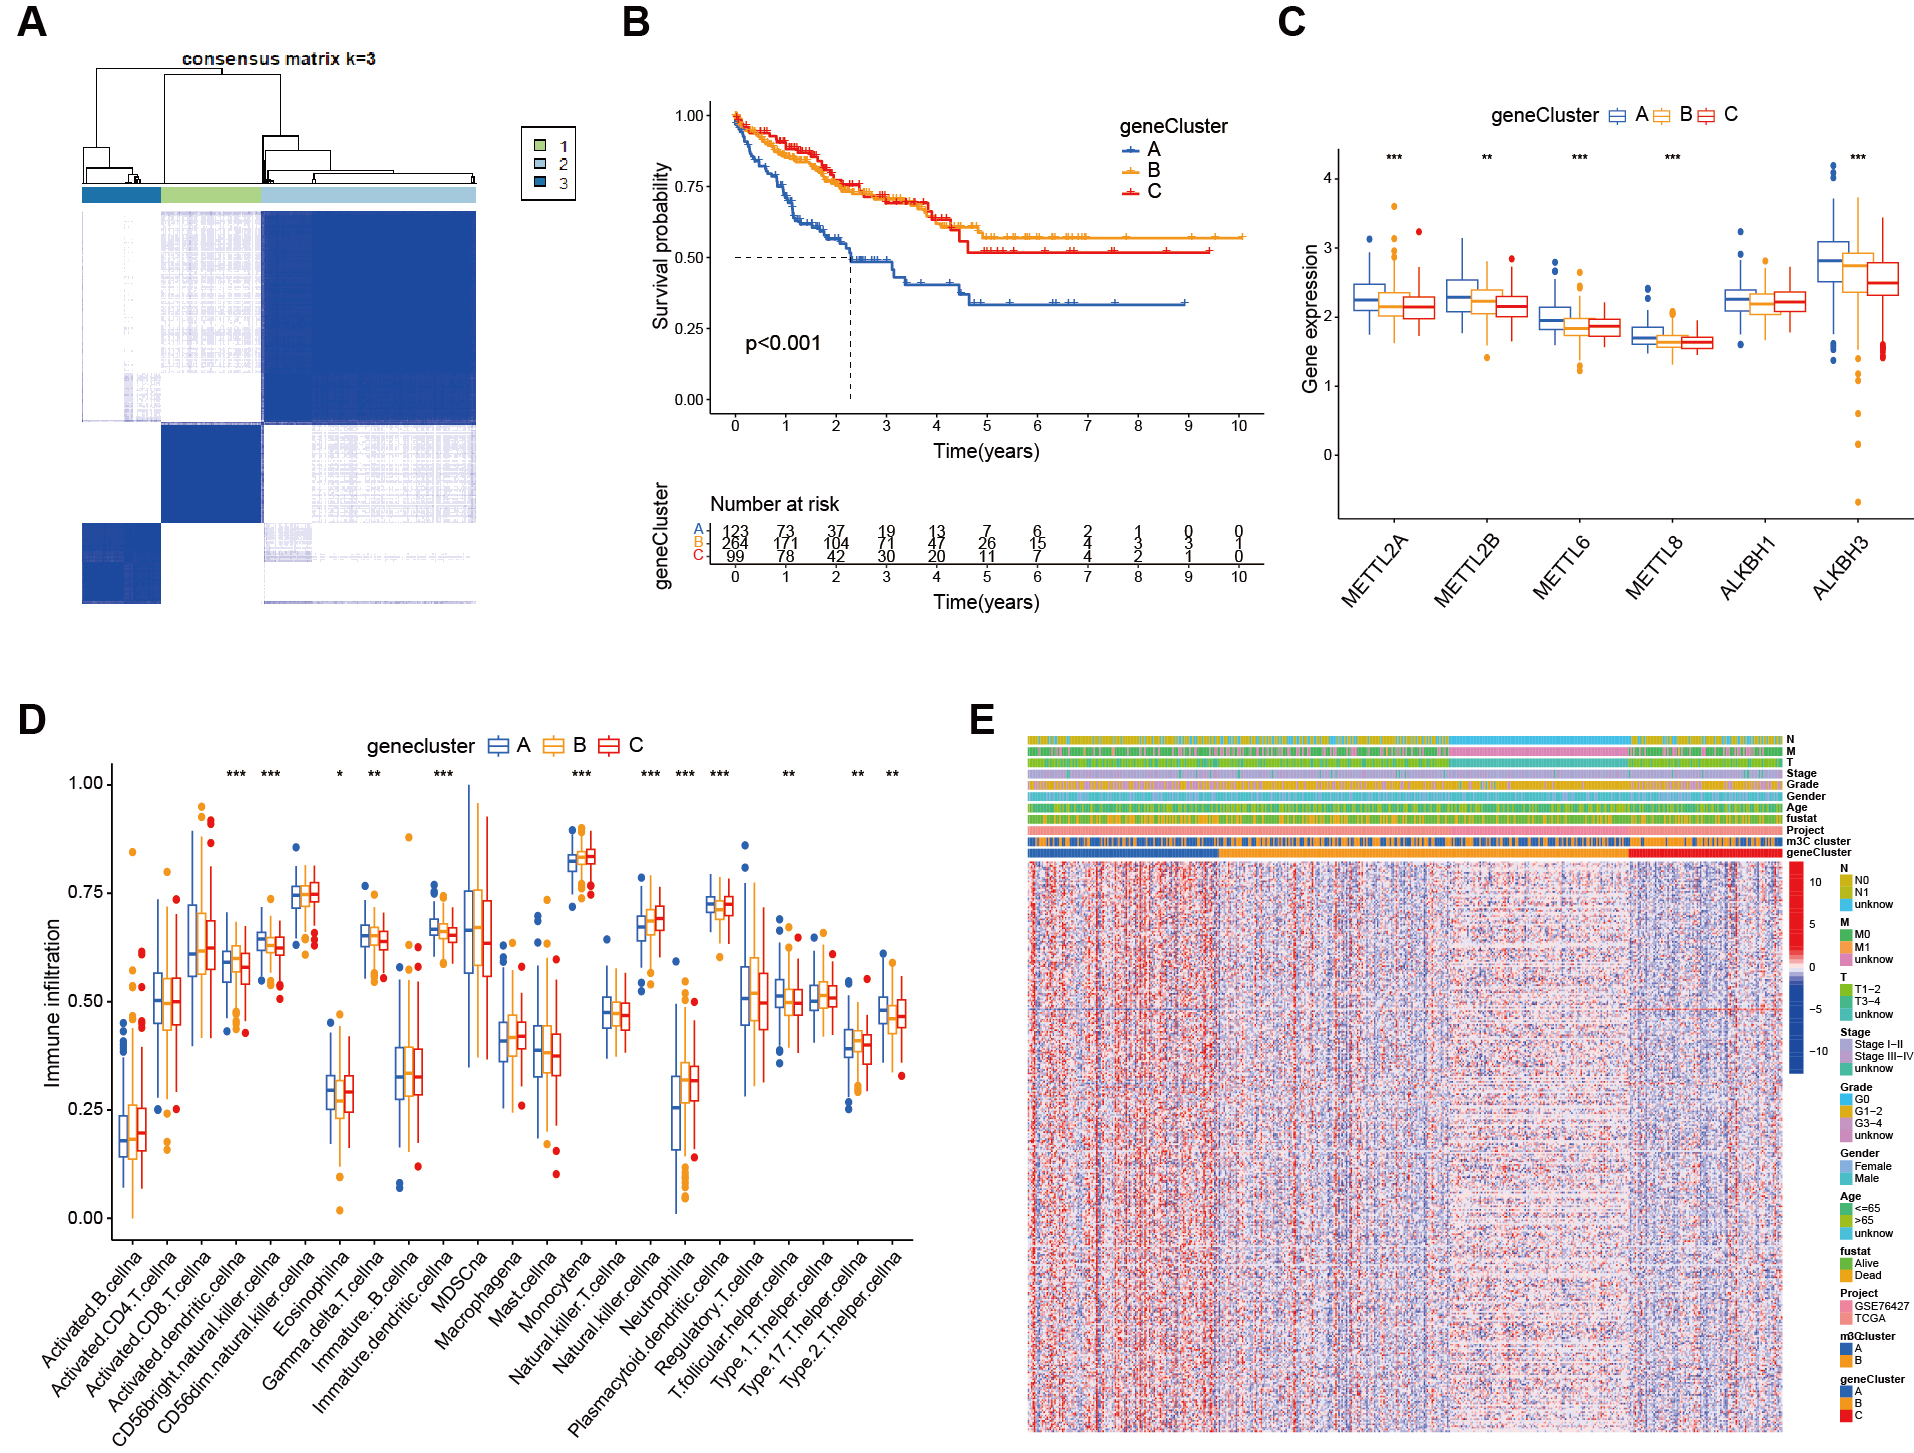
Figure 5. Functional annotation of m3C-related genes. (A) From the DEGs, 330 genes related to HCC prognosis were screened and patients were clustered accordingly, with the most stable results observed when dividing into three groups; (B) Kaplan-Meier survival analysis showed a significant difference between the three genotyping groups; patients in genotype A had a significantly poorest prognosis (P < 0.01); (C) Box plots showed differential expression of m3C molecules across the genotypes; (D) Heatmaps based on genotyping revealed distinct clinical characteristics between the groups; (E) ssGSEA analysis demonstrated the abundance of TME infiltrating cells across the two m3C modification subtypes (*** P <0.001, ** P <0.01, * P < 0.05, ns > 0.05). m3C: 3-methylcytidine; DEGs: differentially expressd genes; HCC: hepatocellular carcinoma; ssGSEA: single-sample gene set enrichment analysis; TME: tumor microenvironment; ns: not significant.
Biological characteristics of the m3C score
To quantify the m3C modification pattern based on DEGs, we developed an evaluation system termed the m3C score. As shown in Figure 6A, the m3C score was significantly correlated with both the m3C clusters and the m3C gene clusters. Survival analysis [Figure 6B] indicated that patients in the high m3C score group had a worse prognosis compared to those in the low score group. Figure 6C presents an alluvial diagram illustrating the distribution of samples across m3C classification, genotype, m3C score, and survival status. Immune correlation analysis further revealed associations between m3C scores and various immune cell populations. As shown in Figure 6D, higher m3C scores were positively correlated with activated CD4 T cells, gamma delta T cells, immature B cells, immature dendritic cells, and several other immune cell types. Conversely, they were negatively correlated with CD56dim natural killer cells, eosinophils, monocytes, neutrophils, and type 17 T helper cells.
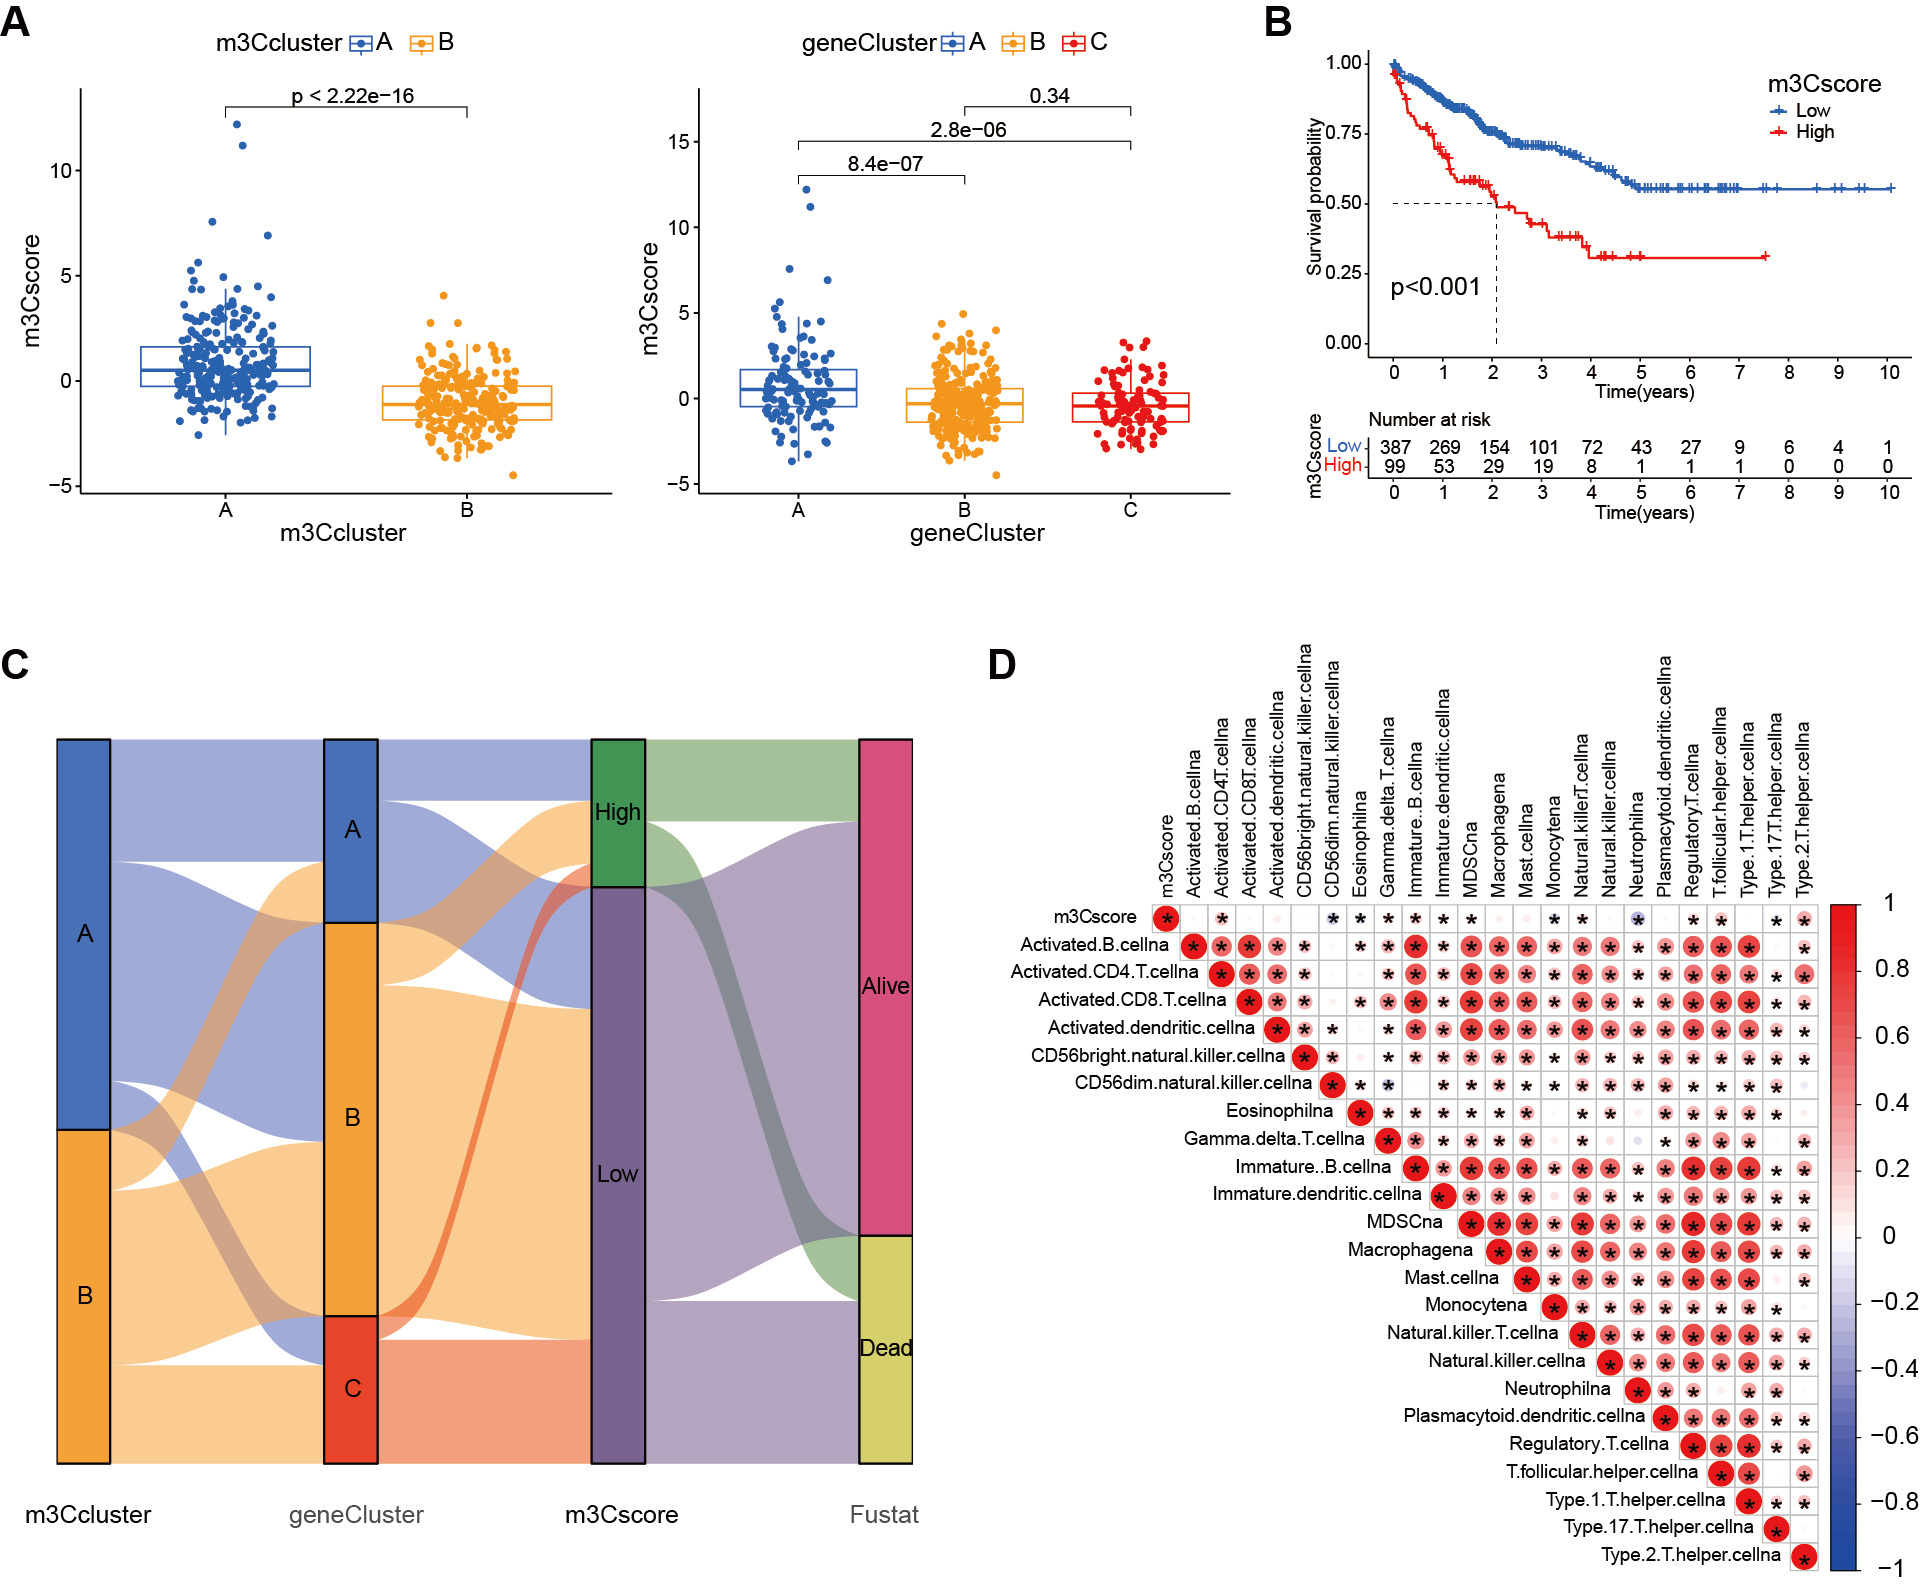
Figure 6. Construction of the m3C scoring system. (A) Box plots showing significant differences in m3C scores between m3C subtypes and genotypes; (B) Kaplan-Meier survival curves demonstrating a significant difference between high and low m3C score groups, with patients in the low-score group exhibiting relatively good prognosis; (C) Alluvial diagram illustrating changes in m3C subtype, genotype, m3C score, and survival status; (D) Correlation between the m3C score and immune cell infiltration as revealed by immune correlation analysis. m3C: 3-methylcytidine.
The role of m3C score in HCC immunotherapy
We first performed a significance test to evaluate the relationship between the m3C score and Tumor Mutational Burden (TMB) in patients with HCC. Survival analysis showed that patients with lower mutation counts exhibited better survival outcomes compared to those with higher counts (P = 0.047, Figure 7A). Further integration of TMB and m3C scores revealed that patients in the low TMB/low m3C score group had a significantly better prognosis, whereas those in the high TMB/high m3C score group had a poorer prognosis (P < 0.001, Figure 7B). Somatic mutation analysis indicated that TP53 and CTNNB1 mutation rates were generally higher in the high m3C score group compared to the low group [Figure 7C]. Consistently, Figure 7D demonstrates that patients with high m3C scores had lower survival rates than those with low scores. A rank test further confirmed that low m3C scores were associated with prolonged survival [Figure 7E]. Next, we examined the clinical implications of the m3C score. Since HCC is highly immunogenic and tends to respond better to immunotherapy than less immunogenic cancers, early prediction of disease progression and treatment efficacy is crucial for improving patient outcomes. To explore the association between immunotherapy markers and the m3C score, we analyzed PD-L1 and CTLA-4 expression levels. Both were significantly higher in the high m3C score group compared to the low group [Figure 7F]. We also evaluated the relationship between the m3C score and biomarkers of targeted therapy, finding that Kirsten rats sarcoma viral oncogene homolog (KRAS) and V-raf murine sarcoma viral oncogene homolog B1 (BRAF) expression levels were markedly elevated in the high m3C score group [Figure 7G]. The IPS was then employed to assess individual responses to CTLA4 and PD-1 antibodies. We evaluated how the m3C score influenced IPS and responses to immune checkpoint blockade therapy. As shown in Figure 7H, the median IPS was significantly higher in the low m3C score group across all four subgroups defined by positive or negative CTLA-4 and PD-L1 status. This suggests that, regardless of PD-L1 or CTLA-4 expression, patients with low m3C scores are more likely to benefit from antibody-based immunotherapy.
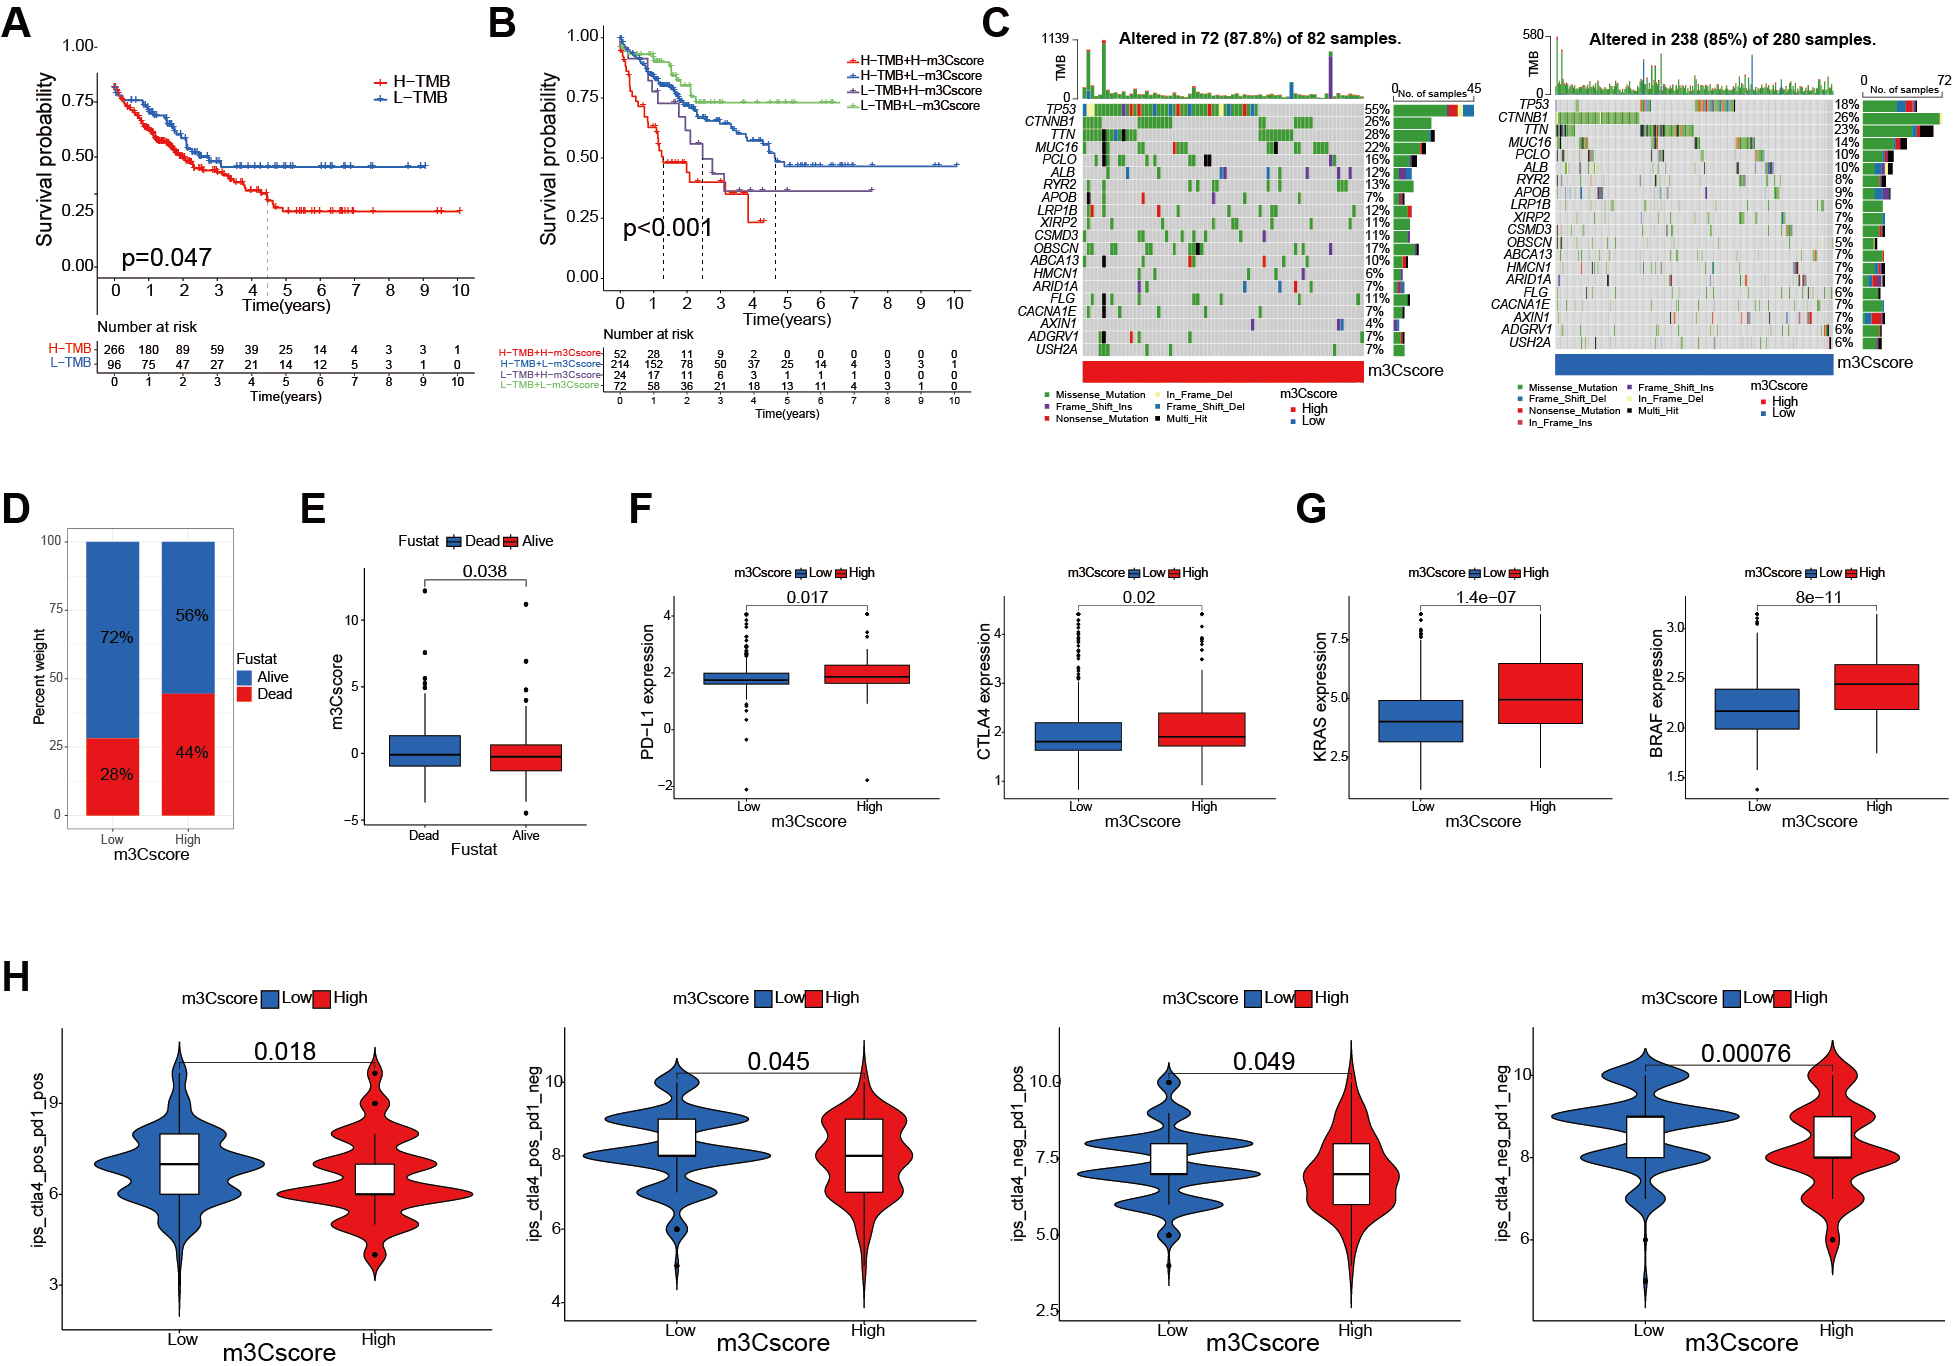
Figure 7. Clinical evaluation of the m3C score. (A) Kaplan-Meier survival curves of patients with high and low TMB (P = 0.047); (B) Survival analysis combining TMB and m3C scores (P = 0.003, log-rank test); (C) Waterfall plot comparing low and high m3C score groups; (D) Survival vs. death ratios in high and low m3C score groups; (E) Comparison of m3C scores between surviving and deceased patients (P < 0.001, Wilcoxon test); (F) Relationship between m3C score and immunotherapy markers in HCC patients (P < 0.05, Wilcoxon test); (G) Relationship between m3C score and targeted therapy biomarkers in HCC patients (P < 0.001, Wilcoxon test); (H) Differences in immunophenoscore between m3C score groups (P < 0.0001, Wilcoxon test). m3C: 3-methylcytidine; HCC: hepatocellular carcinoma; TMB: tumor mutation burden.
Clinical evaluation of the m3C score
We further analyzed the relationship between the m3C score and various clinical characteristics of HCC patients. The results showed that across subgroups divided by age, gender, and tumor stage, patients with low m3C scores had better survival outcomes than those with high scores. These findings suggest that the m3C score may serve as a useful prognostic indicator for HCC patients with diverse clinical characteristics
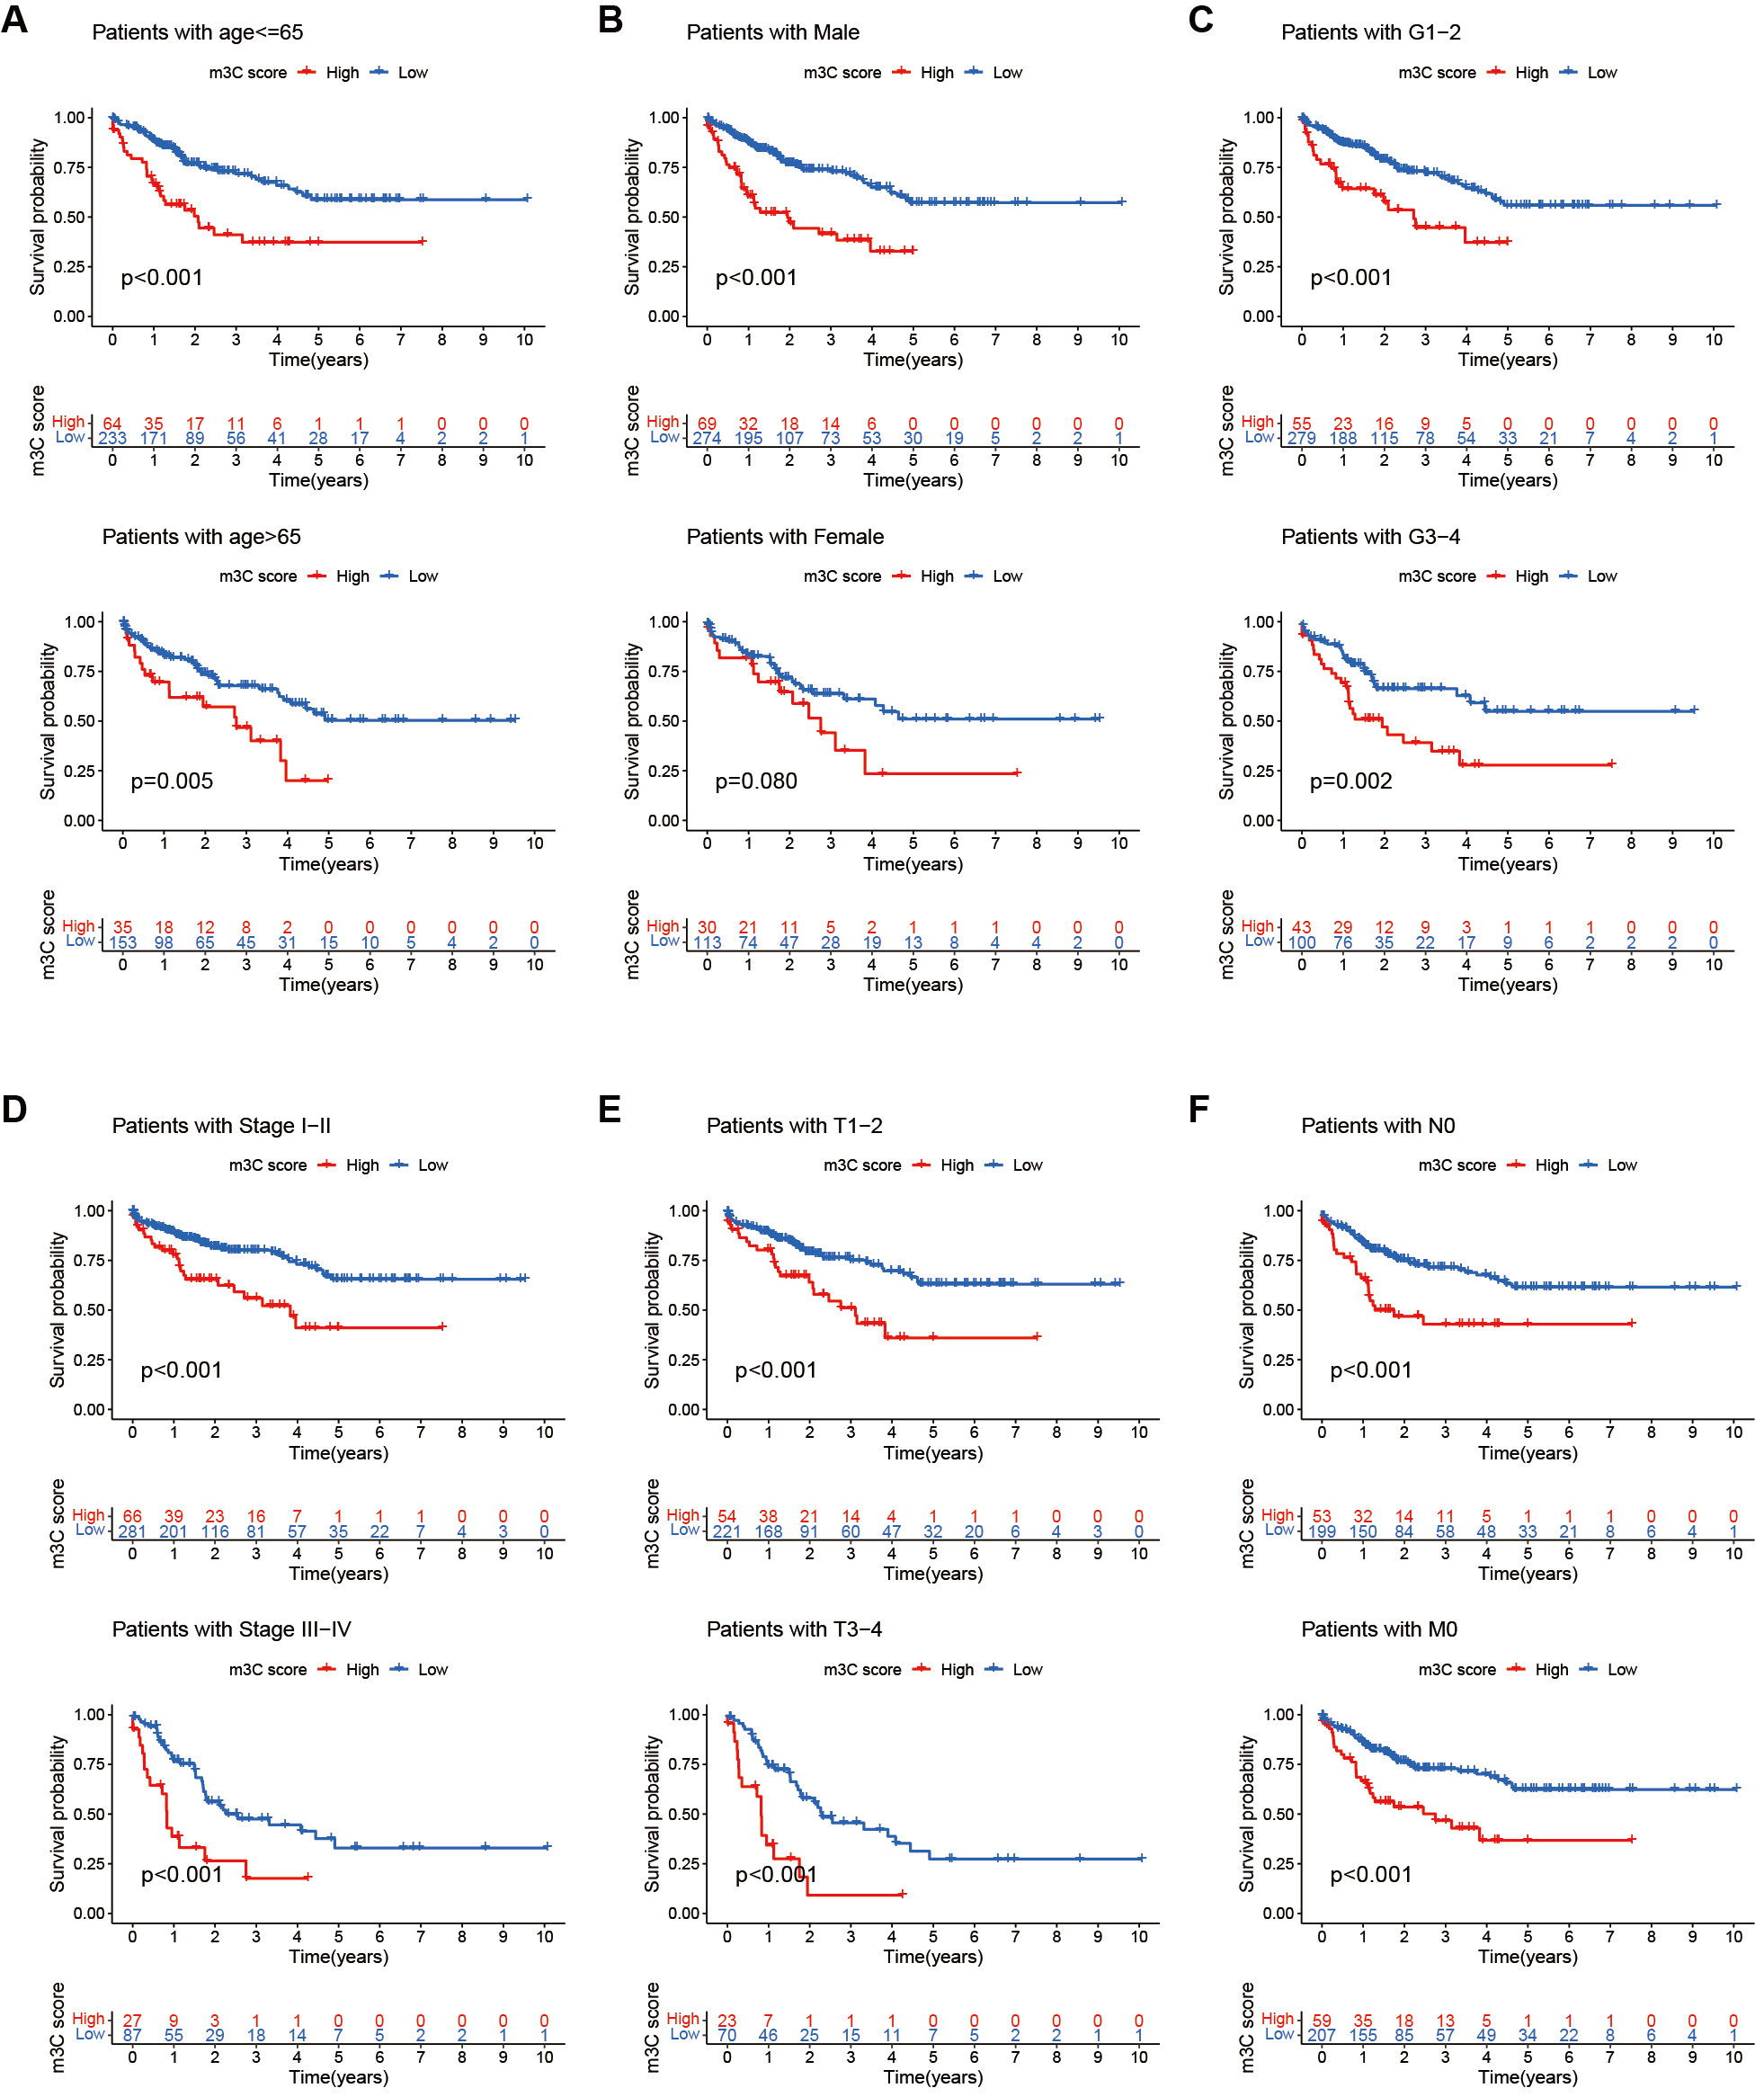
Figure 8. Clinical evaluation of the m3C score. (A-F) Comparison of 5-year survival rates between high and low m3C score groups across different age groups, genders, and tumor T, N, and M stages. Survival analysis revealed that patients with low m3C scores consistently exhibited higher 5-year survival rates than those with high scores in multiple clinical subgroups (P < 0.05). m3C:
DISCUSSION
In this study, we performed a comprehensive evaluation of m3C modification patterns in HCC using data from the TCGA and GEO databases. We identified DEGs associated with m3C subtypes, constructed a gene cluster model, and developed a quantitative scoring system for m3C modification patterns.
HCC presents significant challenges in early diagnosis and prognosis, making it a major global public health concern[1,2,28,29]. To identify prognostic biomarkers for HCC, it is crucial to elucidate the molecular mechanisms underlying its progression[30-32]. While epigenetic reprogramming is known to play a pivotal role in tumor progression[33-35], the contribution of post-transcriptional mRNA modifications in HCC remains incompletely understood. Unlike m6A-which primarily regulates mRNA splicing and
Ignatova et al. reported that METTL6, a tRNA m3C methyltransferase, regulates pluripotency and tumor cell growth: its deletion inhibits HCC cell proliferation, colony formation, and anchorage-independent growth, while reduced expression correlates with improved survival, underscoring its prognostic value[22]. Building on these insights, our literature review identified six key m3C-related genes (METTL2A, METTL2B, METTL6, METTL8, ALKBH1, ALKBH3). Using TCGA and GEO datasets, we found METTL2A, METTL2B, and METTL6 significantly upregulated in HCC tissues. Moreover, expression of all six genes showed a significant negative correlation with survival-suggesting adverse effects on prognosis. Their broad distribution across tumors and interconnections within regulatory networks indicate cooperative functions in cancer progression, as well as potential as therapeutic targets.
To further investigate their role in HCC, we performed consensus clustering based on the expression of 26 m3C regulators, stratifying patients into two subgroups. PCA, GSVA, and immune infiltration analyses revealed distinct m3C methylation landscapes and clinical features. However, survival rates were similar between subgroups-suggesting this classification alone may be insufficient for prognostic modeling. We therefore analyzed DEGs at the intersection of these subgroups, identified prognostic risk genes via univariate Cox regression, and constructed a risk prediction model using consensus clustering. Prognostic analysis confirmed that patients in subgroup A had significantly better outcomes than those in subgroup B, validating the model’s predictive accuracy.
Because m3C regulators act mainly as post-transcriptional modifiers, we focused on downstream DEGs, identified prognostic markers, and used them to refine clustering-based stratification. This analysis again revealed substantial differences in patient outcomes, with subgroup A showing superior survival, thereby supporting the utility of our prognostic model in HCC.
Given the heterogeneity of m3C modification patterns across patients, a quantitative scoring system is essential for personalized treatment. We therefore developed the m3C score, which quantifies individual modification patterns. A lower m3C score was associated with better prognosis and correlated with both m3C subtypes and prognosis-related DEG clusters. Immune correlation analysis showed that the score negatively correlated with 10 of 23 immune cell types, suggesting that m3C methylation may promote HCC progression by modulating immune infiltration. Furthermore, associations with clinical characteristics and TNM staging demonstrated the score’s independent prognostic value, supporting its application in patient stratification and therapeutic decision making.
Clinically, the m3C score’s association with TMB, PD-1, and CTLA4 expression suggests its potential utility in predicting immunotherapy efficacy. Patients with high scores exhibited higher PD-1/CTLA4 expression and IPS, indicating possible responsiveness to immune checkpoint blockade. Nonetheless, this requires validation in independent cohorts with available treatment response data before translation into clinical practice.
Our study has several limitations. First, the clinical validation sample size was small (16 paired samples), limiting the generalizability of m3C regulator expression patterns. Second, bioinformatics analyses relied heavily on TCGA and GEO data; although ComBat correction was applied, batch effects cannot be fully ruled out. Third, functional validation was limited to in vitro experiments using HepG2 cells, whereas in vivo studies (e.g., xenograft models) are needed to confirm the role of m3C regulators in tumor growth. Fourth, the molecular mechanisms by which m3C modifications affect RNA degradation and endocytosis-such as direct RNA targets of METTL2A/B-remain to be elucidated, requiring methods such as m3C-seq. Additionally, our immune infiltration analysis was based solely on ssGSEA; future studies incorporating approaches such as CIBERSORT or MCP-counter will be valuable for cross-validation. Finally, the mechanistic links between m3C modification and immune cell recruitment (e.g., via chemokines such as CXCL9/10 or antigen-presenting molecules) need deeper exploration.
In summary, we investigated the genetic variability and prognostic significance of m3C regulators in HC, and established a scoring system to predict prognosis and support treatment evaluation. Our findings enhance understanding of m3C-mediated regulation in HCC and provide a framework for personalized treatment. To strengthen framework applicability, future work will include prospective real-world cohorts, in vivo validation, and multi-omics analyses to address current limitations.
DECLARATIONS
Acknowledgments
The authors sincerely thank the TCGA, GEO, and HPA databases for providing access to extensive datasets that supported this study. The authors also thank Liu Hong for valuable advice on the implementation of this study. This work was previously posted as a preprint https://doi.org/10.21203/rs.3.rs-4251076/v1. The present manuscript includes additional analyses and revised interpretations of the data.
Authors’ contributions
Conception and design, administrative support: Liu H, and Xiao Li; Hong L, Li X
Collection and assembly of data, data analysis and interpretation: Wei Z, Jun L, Yi W; Zhou W, Lin J,
Manuscript writing: Zhou W, Lin J, Wang Y, Fan A
Final approval of the manuscript: Zhou W, Lin J, Wang Y, Fan A, Hong L, Li X
Availability of data and materials
Our data were mined and analyzed using TCGA, GEO, and HPA databases. Further inquiries regarding the original data can be addressed to the corresponding author.
Financial support and sponsorship
This research was funded by the National Natural Science Foundation of China (No.82372693).
Conflicts of interest
All authors declared that there are no conflicts of interest.
Ethical approval and consent to participate
The authors are accountable for all aspects of the work and for ensuring that any questions related to the accuracy or integrity of the study are appropriately addressed. The trial was conducted in accordance with the Declaration of Helsinki (as revised in 2013). The use of human tissue was approved by the Medical Ethics Committee of the First Affiliated Hospital of the Air Force Medical University (#KY20203211-1). Written informed consent was obtained from all participants.
Consent for publication
Not applicable.
Copyright
© The Author(s) 2025.
REFERENCES
1. Qin J, Gong Q, Zhou C, et al. Differential expression pattern of CC chemokine receptor 7 guides precision treatment of hepatocellular carcinoma. Signal Transduct Target Ther. 2025;10:229.
2. Sung H, Ferlay J, Siegel RL, et al. Global cancer statistics 2020: GLOBOCAN estimates of incidence and mortality worldwide for 36 cancers in 185 countries. CA Cancer J Clin. 2021;71:209-49.
3. Li M, Cao S, Xu RH. Global trends and epidemiological shifts in gastrointestinal cancers: insights from the past four decades. Cancer Commun. 2025;45:774-88.
4. Donne R, Lujambio A. The liver cancer immune microenvironment: therapeutic implications for hepatocellular carcinoma. Hepatology. 2023;77:1773-96.
5. Thangaraj JL, Coffey M, Lopez E, Kaufman DS. Disruption of TGF-β signaling pathway is required to mediate effective killing of hepatocellular carcinoma by human iPSC-derived NK cells. Cell Stem Cell. 2024;31:1327-1343.e5.
6. Moris D, Martinino A, Schiltz S, et al. Advances in the treatment of hepatocellular carcinoma: an overview of the current and evolving therapeutic landscape for clinicians. CA Cancer J Clin. 2025.
7. Sangro B, Sarobe P, Hervás-Stubbs S, Melero I. Advances in immunotherapy for hepatocellular carcinoma. Nat Rev Gastroenterol Hepatol. 2021;18:525-43.
8. Hu Y, Shen ZH. Practice of precision surgery in primary liver cancer. Hepatobiliary Pancreat Dis Int. 2021;20:108-9.
9. Haber PK, Castet F, Torres-Martin M, et al. Molecular markers of response to anti-PD1 therapy in advanced hepatocellular carcinoma. Gastroenterology. 2023;164:72-88.e18.
10. Llovet JM, De Baere T, Kulik L, et al. Locoregional therapies in the era of molecular and immune treatments for hepatocellular carcinoma. Nat Rev Gastroenterol Hepatol. 2021;18:293-313.
11. Chan YT, Zhang C, Wu J, et al. Biomarkers for diagnosis and therapeutic options in hepatocellular carcinoma. Mol Cancer. 2024;23:189.
12. Schwabe RF, Greten TF. Gut microbiome in HCC - mechanisms, diagnosis and therapy. J Hepatol. 2020;72:230-8.
13. Arvanitakis K, Mitroulis I, Germanidis G. Tumor-associated neutrophils in hepatocellular carcinoma pathogenesis, prognosis, and therapy. Cancers. 2021;13:2899.
14. Suzuki T. The expanding world of tRNA modifications and their disease relevance. Nat Rev Mol Cell Biol. 2021;22:375-92.
15. Zhou JB, Wang ED, Zhou XL. Modifications of the human tRNA anticodon loop and their associations with genetic diseases. Cell Mol Life Sci. 2021;78:7087-105.
16. McCown PJ, Ruszkowska A, Kunkler CN, et al. Naturally occurring modified ribonucleosides. Wiley Interdiscip Rev RNA. 2020;11:e1595.
17. Suzuki T, Yashiro Y, Kikuchi I, et al. Complete chemical structures of human mitochondrial tRNAs. Nat Commun. 2020;11:4269.
18. Huang MH, Peng GX, Mao XL, et al. Molecular basis for human mitochondrial tRNA m3C modification by alternatively spliced METTL8. Nucleic Acids Res. 2022;50:4012-28.
19. Mao XL, Li ZH, Huang MH, et al. Mutually exclusive substrate selection strategy by human m3C RNA transferases METTL2A and METTL6. Nucleic Acids Res. 2021;49:8309-23.
20. Cui J, Liu Q, Sendinc E, Shi Y, Gregory RI. Nucleotide resolution profiling of m3C RNA modification by HAC-seq. Nucleic Acids Res. 2021;49:e27.
21. Schöller E, Marks J, Marchand V, et al. Balancing of mitochondrial translation through METTL8-mediated m3C modification of mitochondrial tRNAs. Mol Cell. 2021;81:4810-4825.e12.
22. Ignatova VV, Kaiser S, Ho JSY, et al. METTL6 is a tRNA m3C methyltransferase that regulates pluripotency and tumor cell growth. Sci Adv. 2020;6:eaaz4551.
23. Zhang LH, Zhang XY, Hu T, et al. The SUMOylated METTL8 Induces R-loop and Tumorigenesis via m3C. iScience. 2020;23:100968.
24. Feng Q, Wang D, Xue T, et al. The role of RNA modification in hepatocellular carcinoma. Front Pharmacol. 2022;13:984453.
25. Ma CJ, Ding JH, Ye TT, Yuan BF, Feng YQ. AlkB homologue 1 demethylates N3-methylcytidine in mRNA of mammals. ACS Chem Biol. 2019;14:1418-25.
26. Wang X, Han Y, Li J, et al. Multi-omics analysis of copy number variations of RNA regulatory genes in soft tissue sarcoma. Life Sci. 2021;265:118734.
27. Charoentong P, Finotello F, Angelova M, et al. Pan-cancer immunogenomic analyses reveal genotype-immunophenotype relationships and predictors of response to checkpoint blockade. Cell Rep. 2017;18:248-62.
28. Finn RS, Qin S, Ikeda M, et al; IMbrave150 Investigators. Atezolizumab plus bevacizumab in unresectable hepatocellular carcinoma. N Engl J Med. 2020;382:1894-905.
29. Calderaro J, Seraphin TP, Luedde T, Simon TG. Artificial intelligence for the prevention and clinical management of hepatocellular carcinoma. J Hepatol. 2022;76:1348-61.
30. Yang C, Huang X, Li Y, Chen J, Lv Y, Dai S. Prognosis and personalized treatment prediction in TP53-mutant hepatocellular carcinoma: an in silico strategy towards precision oncology. Brief Bioinform. 2021;22:bbaa164.
31. Meng Y, Sang Y, Liao J, et al. Single cell transcriptional diversity and intercellular crosstalk of human liver cancer. Cell Death Dis. 2022;13:261.
32. Fujita M, Yamaguchi R, Hasegawa T, et al. Classification of primary liver cancer with immunosuppression mechanisms and correlation with genomic alterations. EBioMedicine. 2020;53:102659.
33. Kan RL, Chen J, Sallam T. Crosstalk between epitranscriptomic and epigenetic mechanisms in gene regulation. Trends Genet. 2022;38:182-93.
34. Wang B, Wang Z, Zhou Z, et al. Inhibition of 6-phosphogluconate dehydrogenase suppresses esophageal squamous cell carcinoma growth and enhances the anti-tumor effects of metformin via the AMPK/mTOR pathway. Mol Cancer. 2025;24:97.
35. Tian Y, Xiao H, Yang Y, et al. Crosstalk between 5-methylcytosine and N6-methyladenosine machinery defines disease progression, therapeutic response and pharmacogenomic landscape in hepatocellular carcinoma. Mol Cancer. 2023;22:5.
36. Lentini JM, Alsaif HS, Faqeih E, Alkuraya FS, Fu D. DALRD3 encodes a protein mutated in epileptic encephalopathy that targets arginine tRNAs for 3-methylcytosine modification. Nat Commun. 2020;11:2510.
37. Chen R, Zhou J, Liu L, Mao XL, Zhou X, Xie W. Crystal structure of human METTL6, the m3C methyltransferase. Commun Biol. 2021;4:1361.
38. Lee SA, Lee KH, Kim H, Cho JY. METTL8 mRNA methyltransferase enhances cancer cell migration via direct binding to ARID1A. Int J Mol Sci. 2021;22:5432.
39. Chang Q, Chen P, Yin J, et al. Discovery and validation of bladder cancer related excreted nucleosides biomarkers by dilution approach in cell culture supernatant and urine using UHPLC-MS/MS. J Proteomics. 2023;270:104737.
Cite This Article
How to Cite
Download Citation
Export Citation File:
Type of Import
Tips on Downloading Citation
Citation Manager File Format
Type of Import
Direct Import: When the Direct Import option is selected (the default state), a dialogue box will give you the option to Save or Open the downloaded citation data. Choosing Open will either launch your citation manager or give you a choice of applications with which to use the metadata. The Save option saves the file locally for later use.
Indirect Import: When the Indirect Import option is selected, the metadata is displayed and may be copied and pasted as needed.
About This Article
Copyright

Data & Comments
Data
0


Comments
Comments must be written in English. Spam, offensive content, impersonation, and private information will not be permitted. If any comment is reported and identified as inappropriate content by OAE staff, the comment will be removed without notice. If you have any queries or need any help, please contact us at [email protected].