


fig2
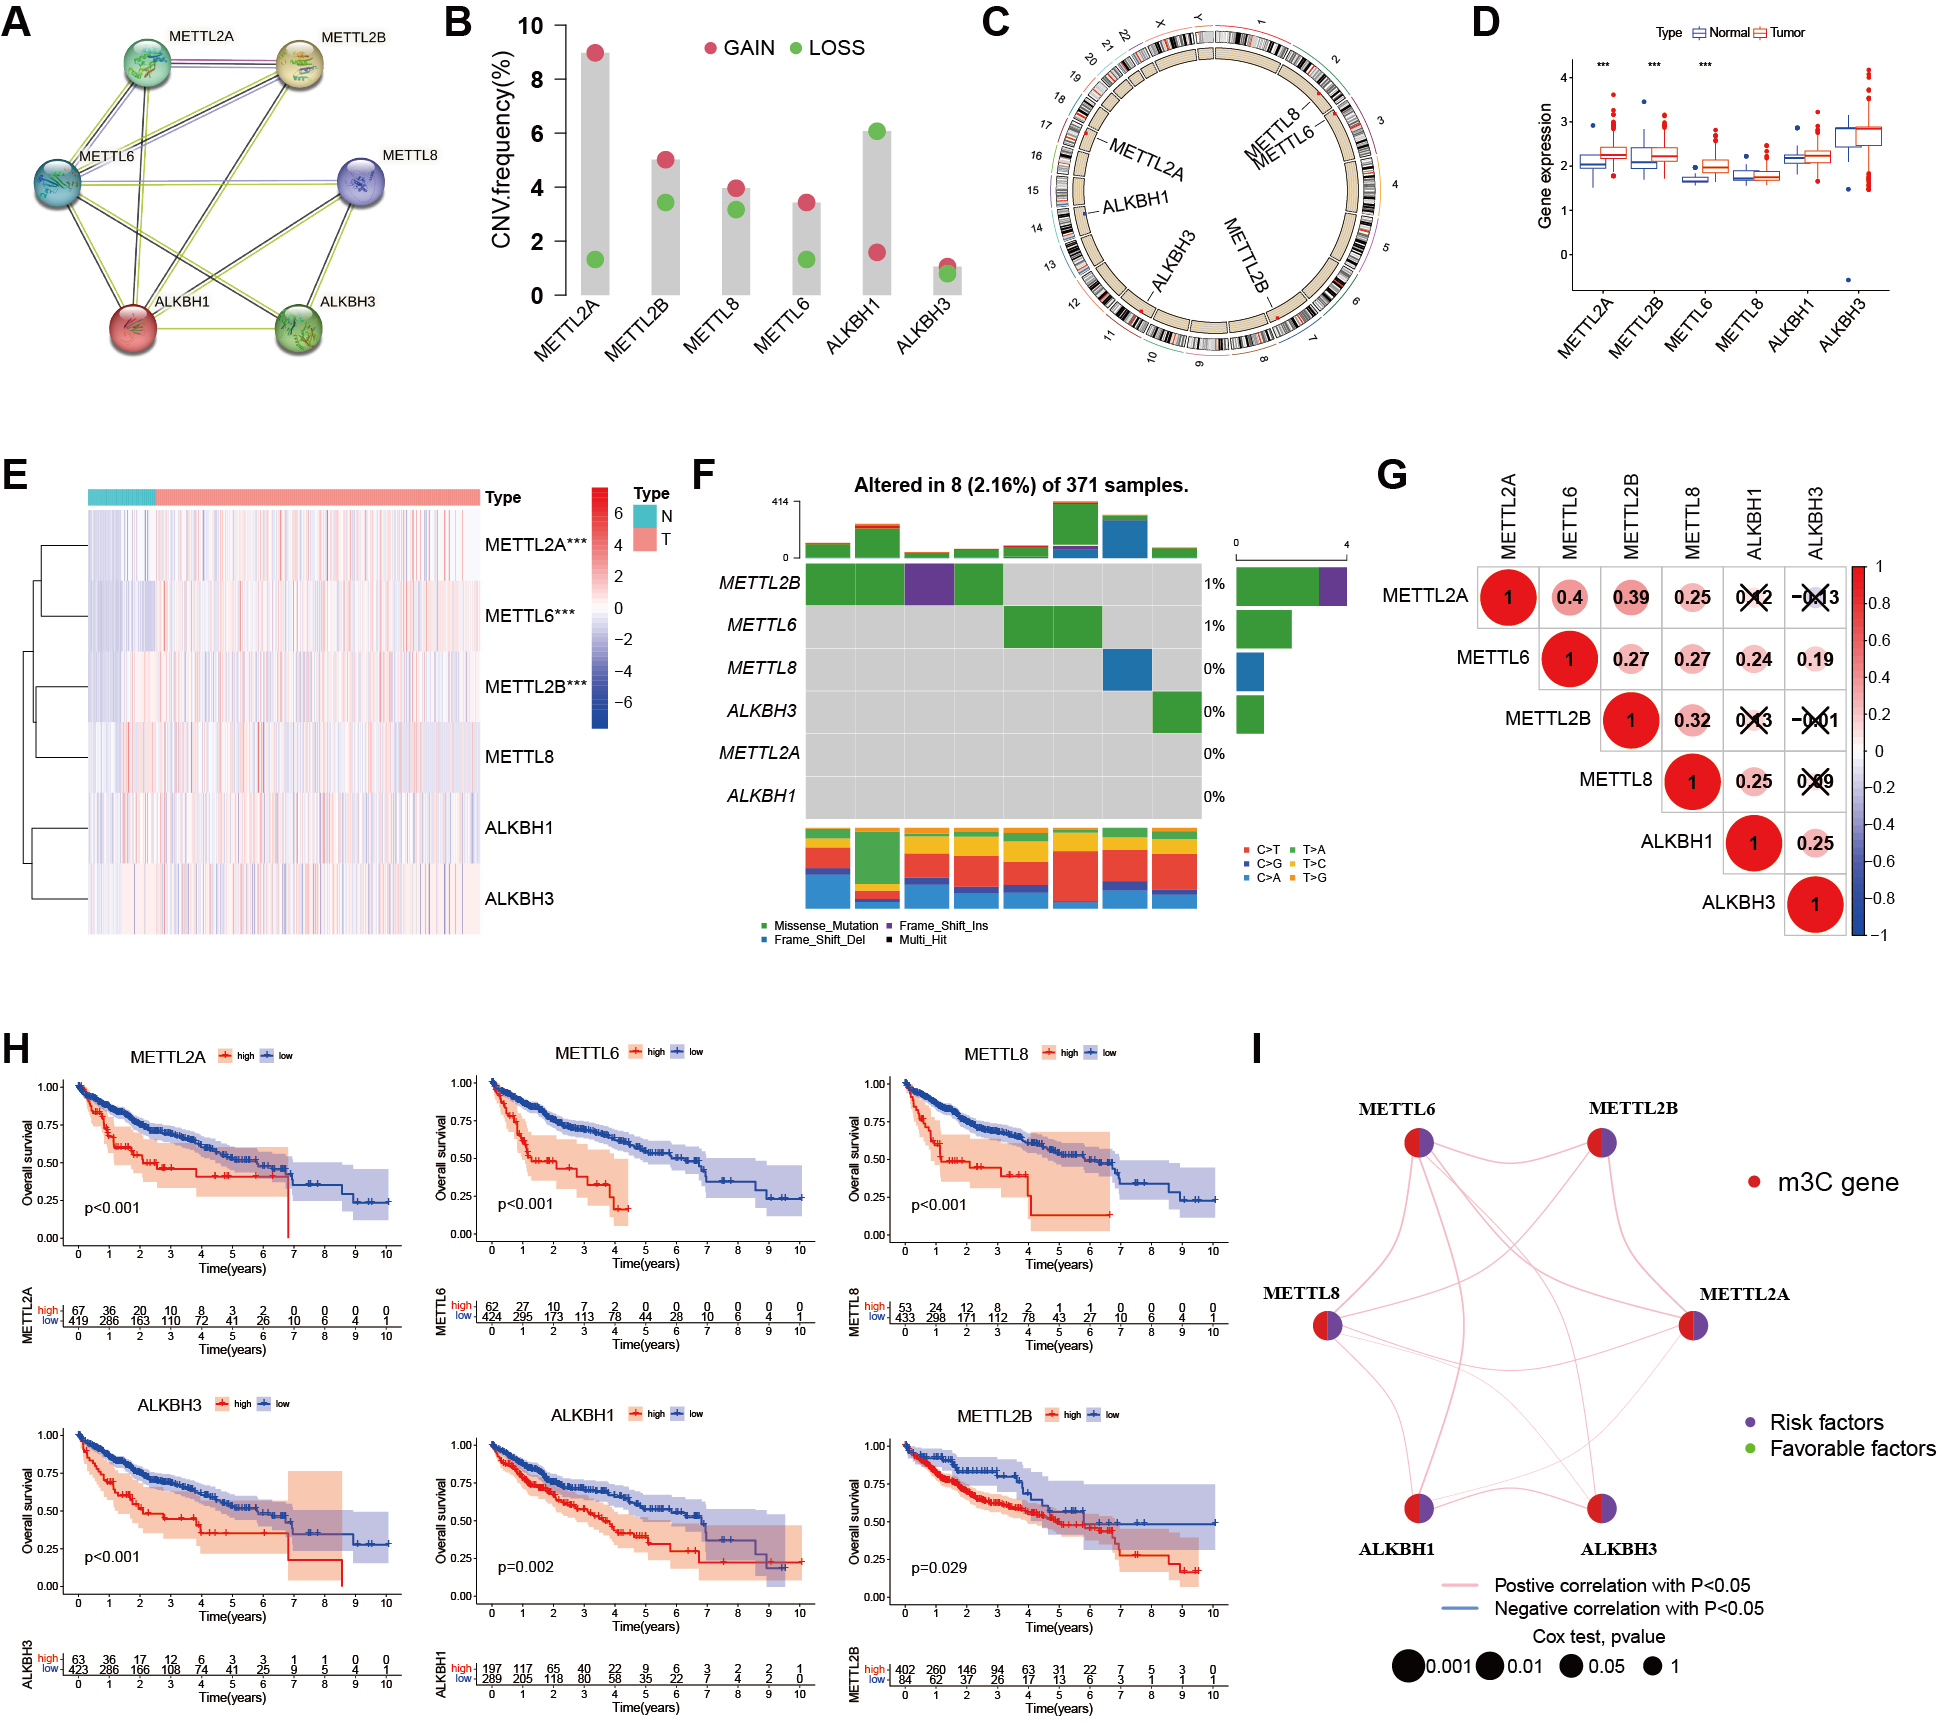
Figure 2. Genetic variation of m3C regulators in liver cancer. (A) PPI network of six m3C regulators constructed using the STRING database; (B) Histogram showing the CNV frequency of the six m3C regulators; (C) Chromosomal locations of CNV alterations in m3C regulators; (D) Boxplot comparing m3C regulator expression levels in normal and cancer samples (*** P < 0.001, ** P < 0.01, * P < 0.05, ns > 0.05); (E) Heatmap of mRNA expression levels of m3C regulators in normal and cancer samples (same significance notation as in D); (F) Mutation frequency of m3C regulators in the TCGA-LIHC cohort (n = 371). The discrepancy with the total cohort size (n = 486) is due to 115 GEO cases lacking somatic mutation data; (G) Pearson correlation analysis of the six m3C methylation regulators in HCC; (H) Prognostic analysis of six m3C regulators using TCGA and GEO databases; (I) Prognostic network showing co-expression relationships among the six m3C regulators. Peripheral nodes represent m3C-related genes, and connections indicate co-expression relationships. Node size reflects the prognostic impact of each regulator. Statistical significance was determined by Cox analysis (P < 0.001, P < 0.01, P < 0.05, P < 1). HCC: Hepatocellular carcinoma; m3C: 3-methylcytidine; PPI: protein-protein interaction; CNV: copy number variation; TCGA-LIHC: the cancer genome atlas liver hepatocellular carcinoma; GEO: gene expression omnibus; ns: not significant.


