


fig3
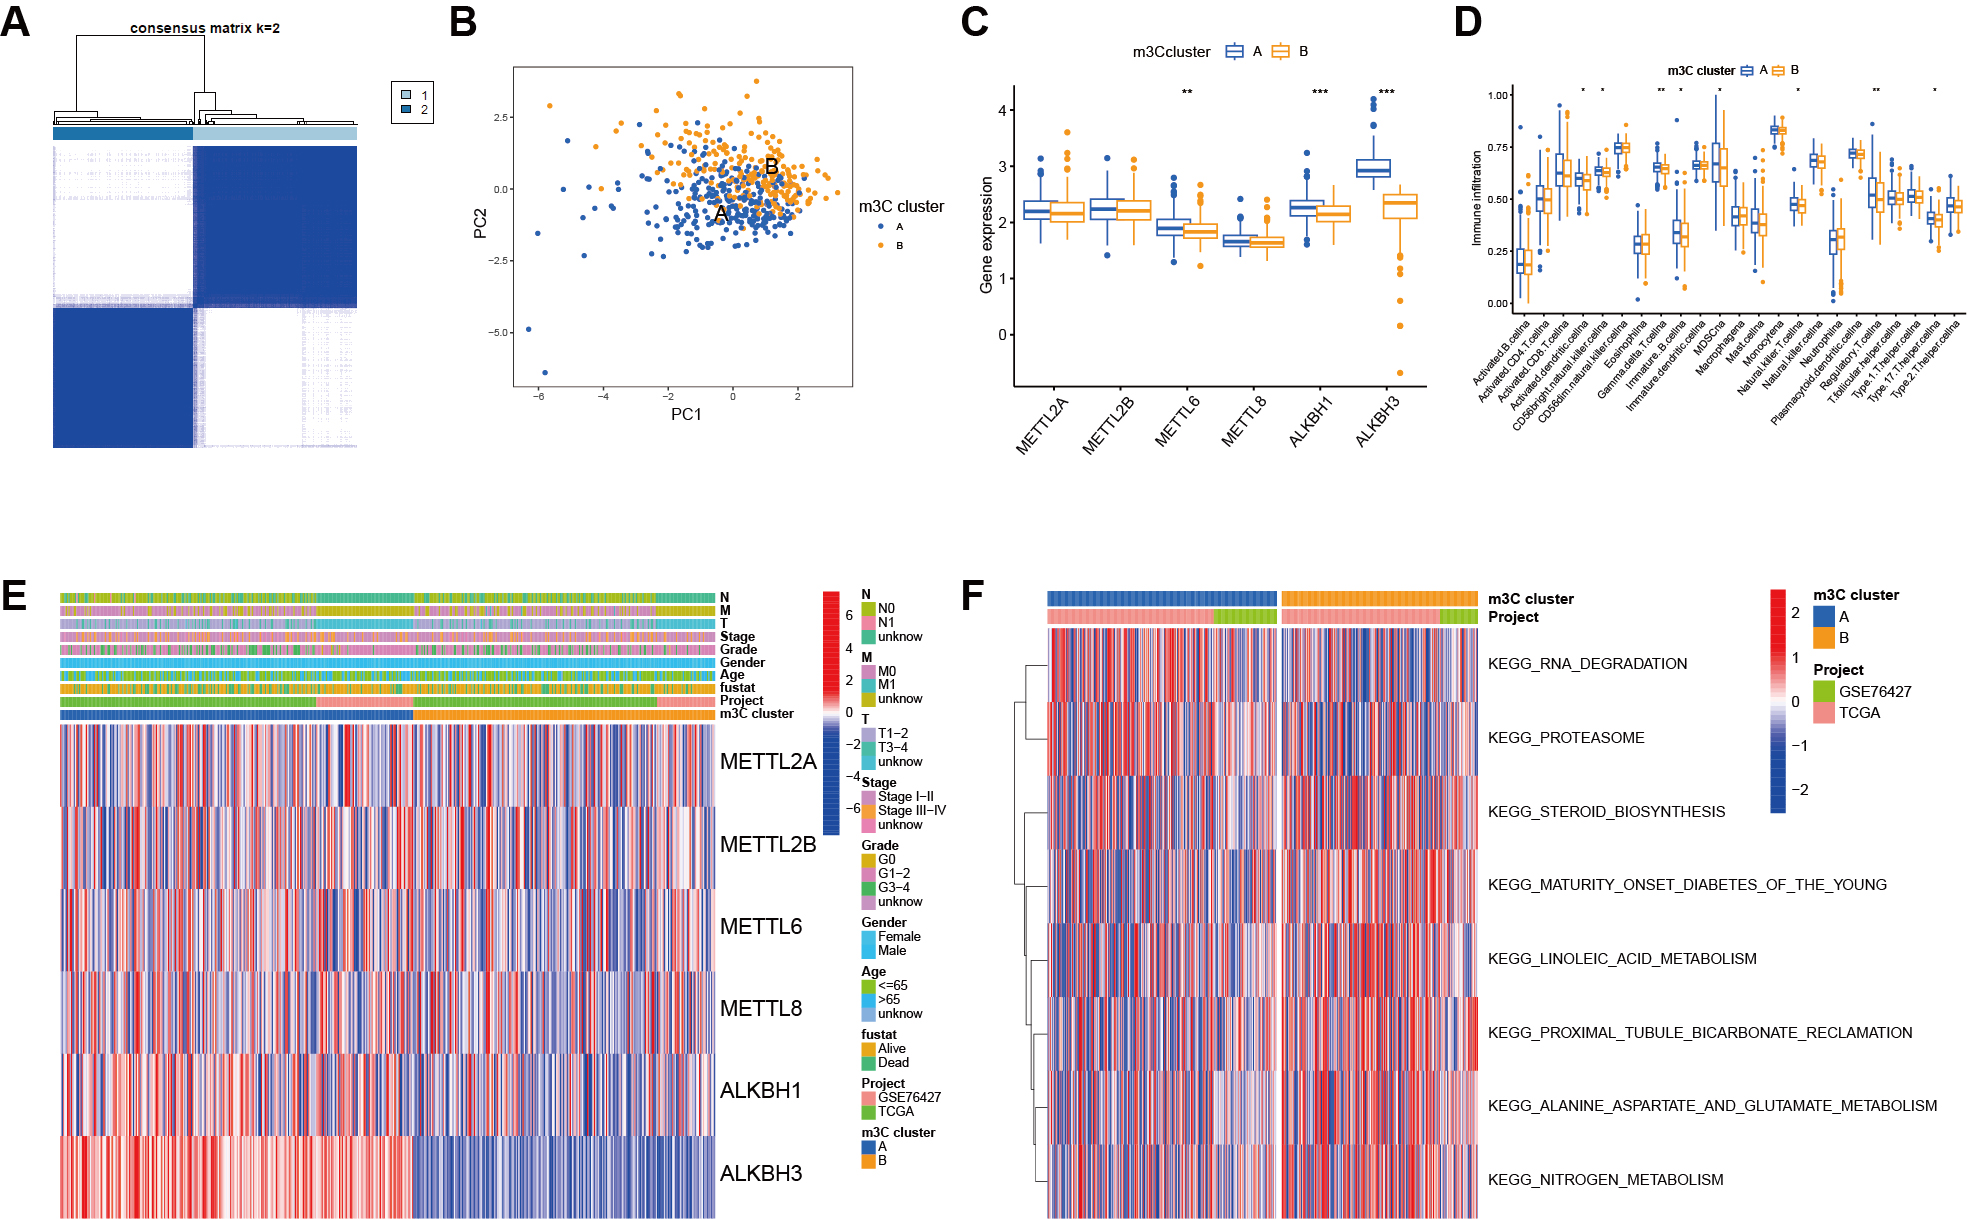
Figure 3. Determination of the m3C modification mode. (A) Two stable subgroups were identified based on the expression similarity of m3C methylation regulators; (B) PCA confirmed that m3C-related genes could distinguish samples between the two subtypes; (C) Boxplot showing differential m3C expression across genotypes; (D) Heatmap illustrating distinct clinical feature distributions between m3C subgroups; (E) GSVA enrichment analysis highlighting biological differences between the two m3C modification modes; (F) ssGSEA analysis showing the abundance of TME-infiltrating cells across the two m3C modification modes.(***P < 0.001, **P < 0.01, *P < 0.05, ns > 0.05). m3C: 3-methylcytidine; PCA: principal component analysis; GSVA: gene set variation analysis; ssGSEA: single-sample gene set enrichment analysis; TME: tumor microenvironment.


