


fig6
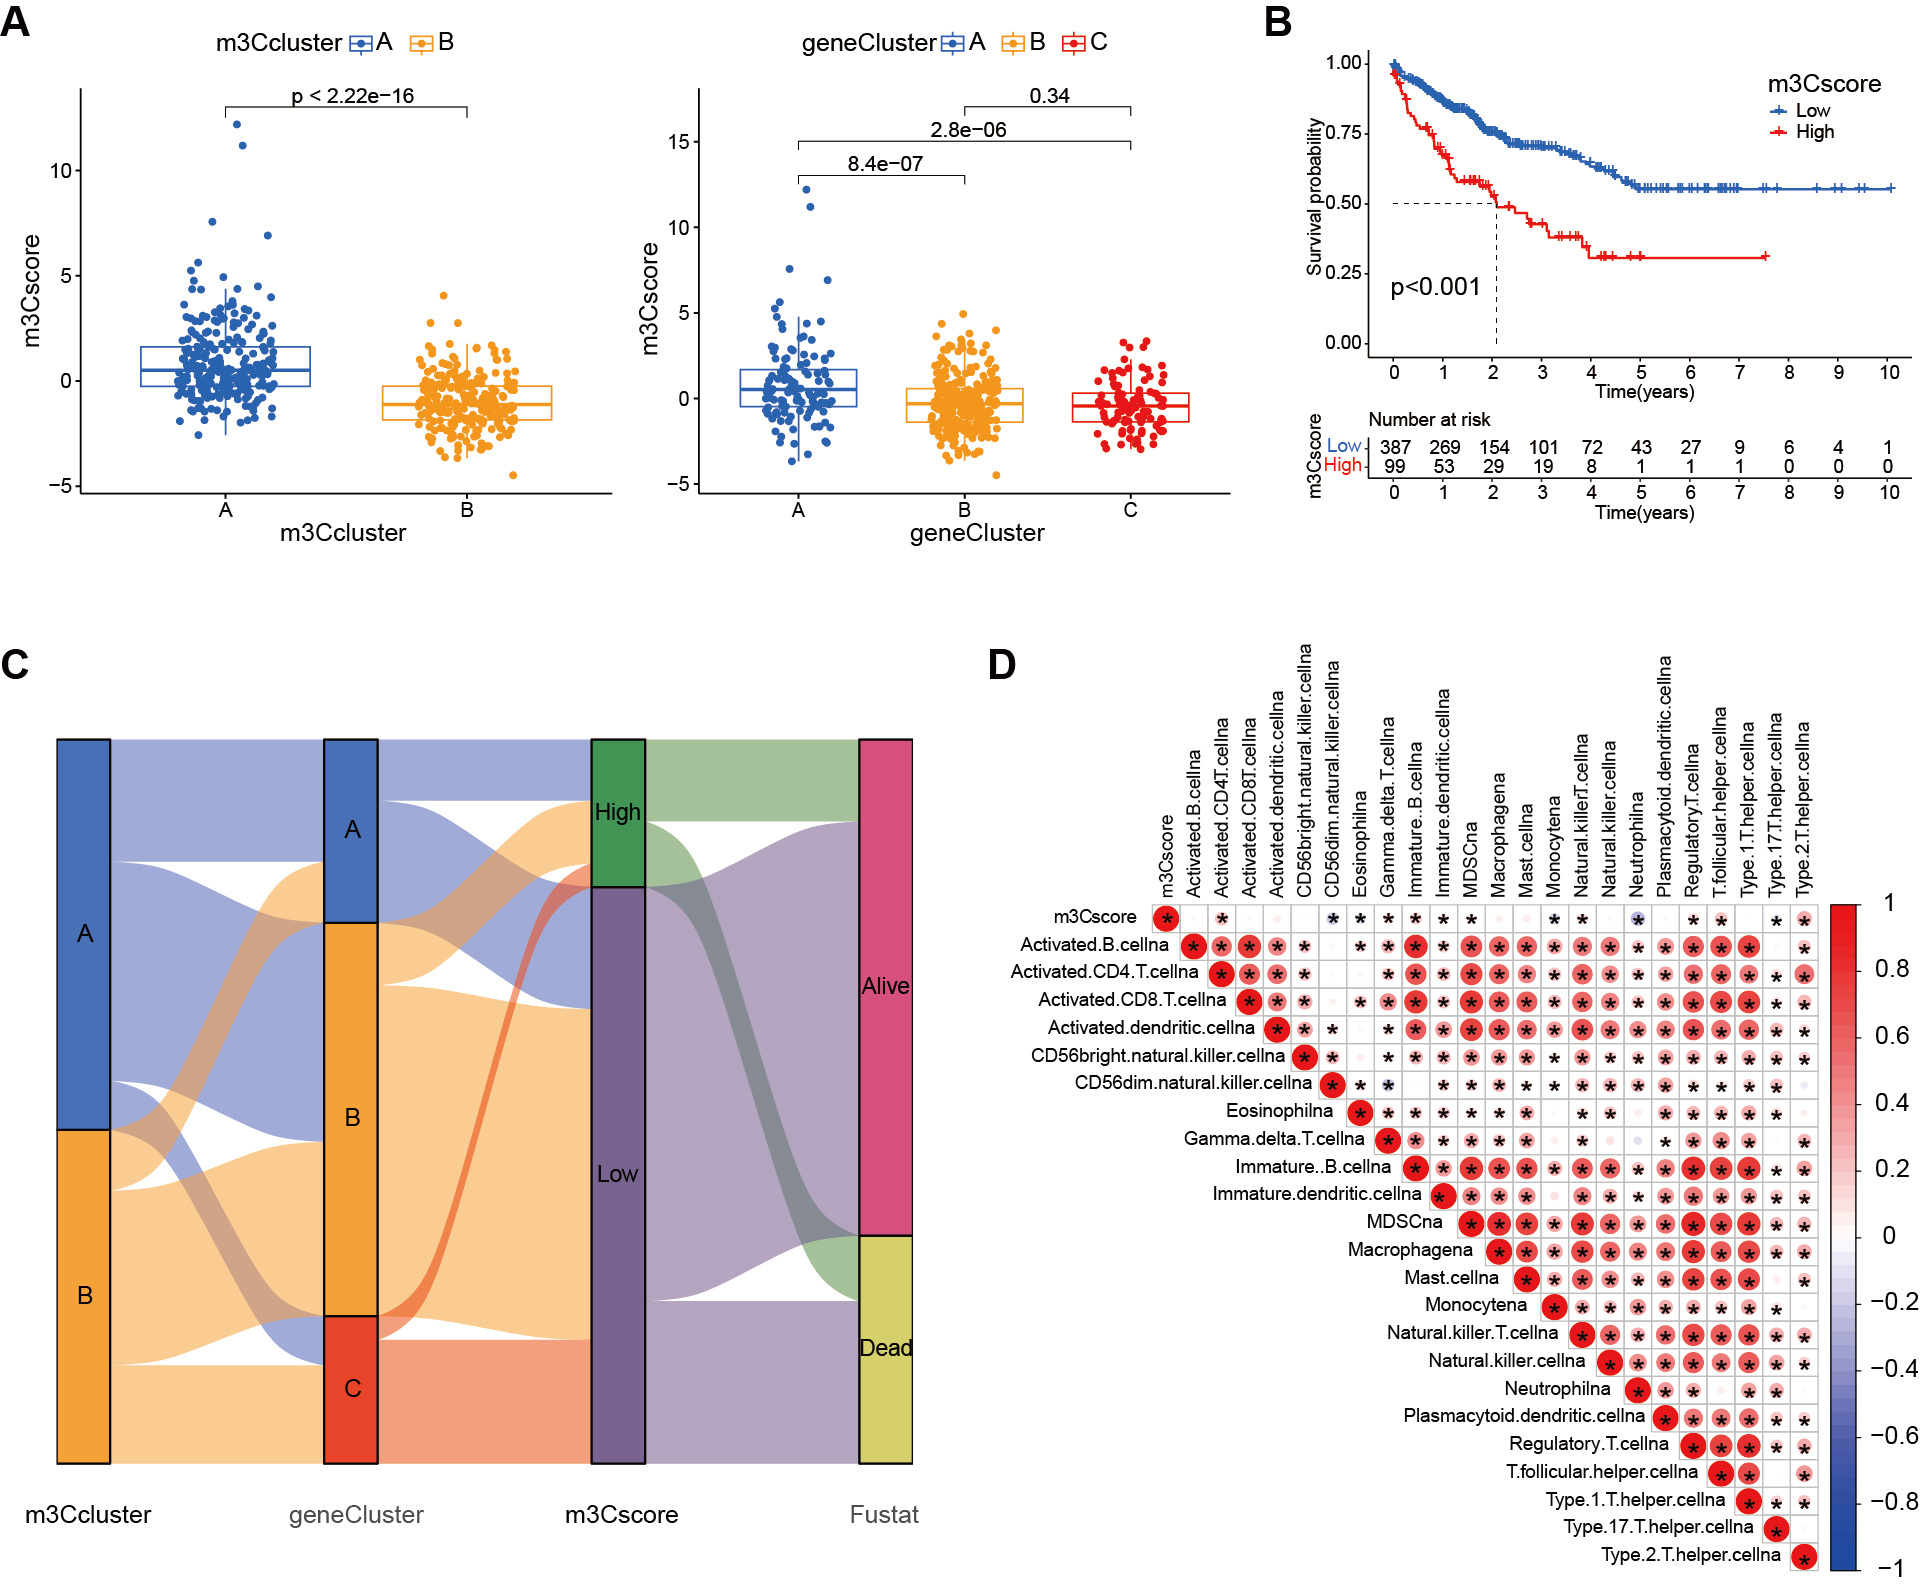
Figure 6. Construction of the m3C scoring system. (A) Box plots showing significant differences in m3C scores between m3C subtypes and genotypes; (B) Kaplan-Meier survival curves demonstrating a significant difference between high and low m3C score groups, with patients in the low-score group exhibiting relatively good prognosis; (C) Alluvial diagram illustrating changes in m3C subtype, genotype, m3C score, and survival status; (D) Correlation between the m3C score and immune cell infiltration as revealed by immune correlation analysis. m3C: 3-methylcytidine.


