


fig7
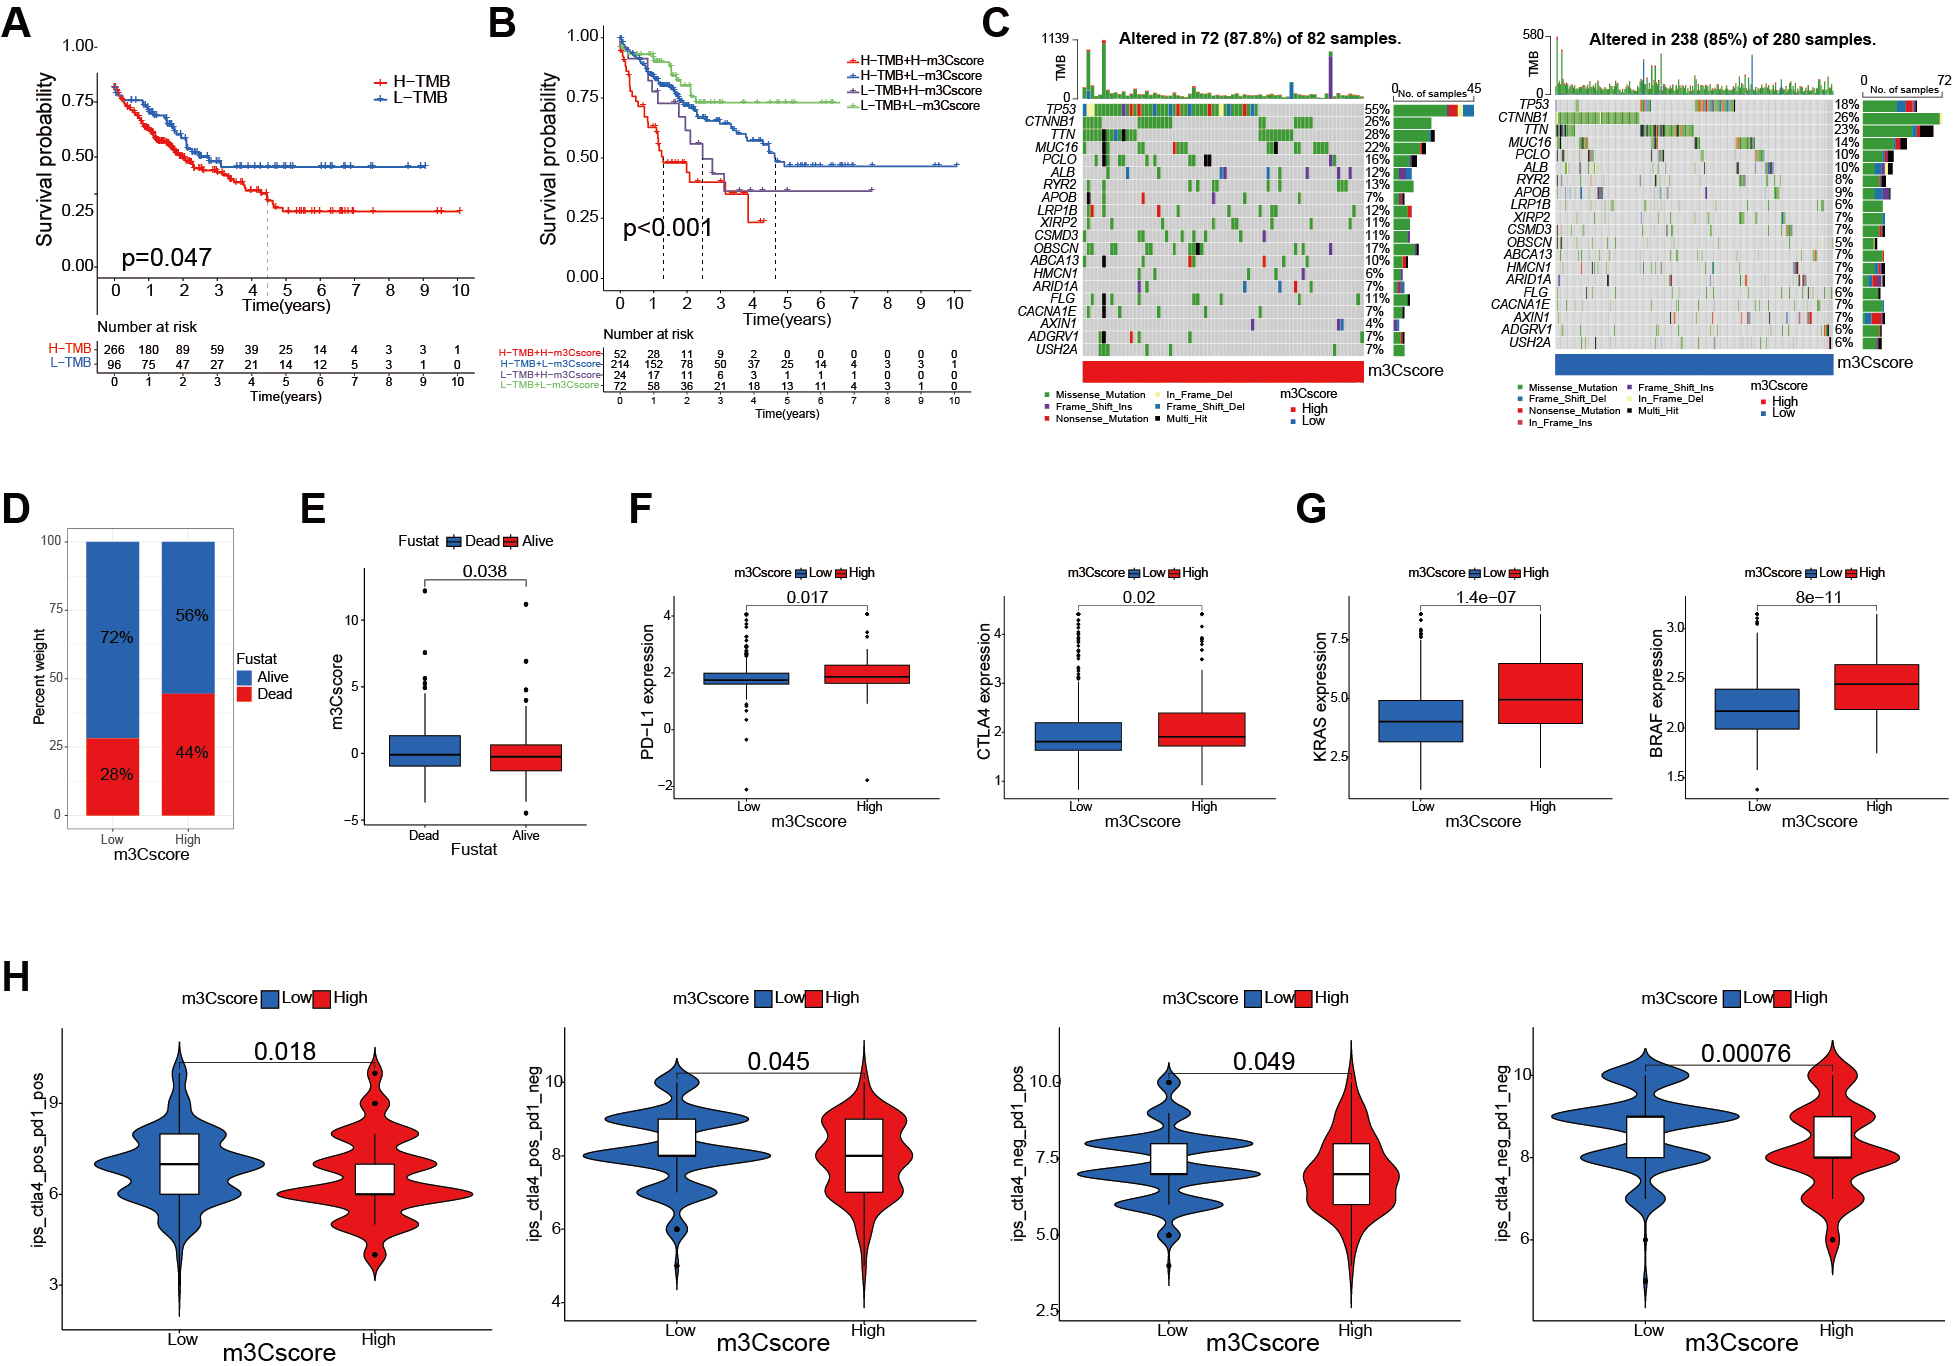
Figure 7. Clinical evaluation of the m3C score. (A) Kaplan-Meier survival curves of patients with high and low TMB (P = 0.047); (B) Survival analysis combining TMB and m3C scores (P = 0.003, log-rank test); (C) Waterfall plot comparing low and high m3C score groups; (D) Survival vs. death ratios in high and low m3C score groups; (E) Comparison of m3C scores between surviving and deceased patients (P < 0.001, Wilcoxon test); (F) Relationship between m3C score and immunotherapy markers in HCC patients (P < 0.05, Wilcoxon test); (G) Relationship between m3C score and targeted therapy biomarkers in HCC patients (P < 0.001, Wilcoxon test); (H) Differences in immunophenoscore between m3C score groups (P < 0.0001, Wilcoxon test). m3C: 3-methylcytidine; HCC: hepatocellular carcinoma; TMB: tumor mutation burden.


