


fig8
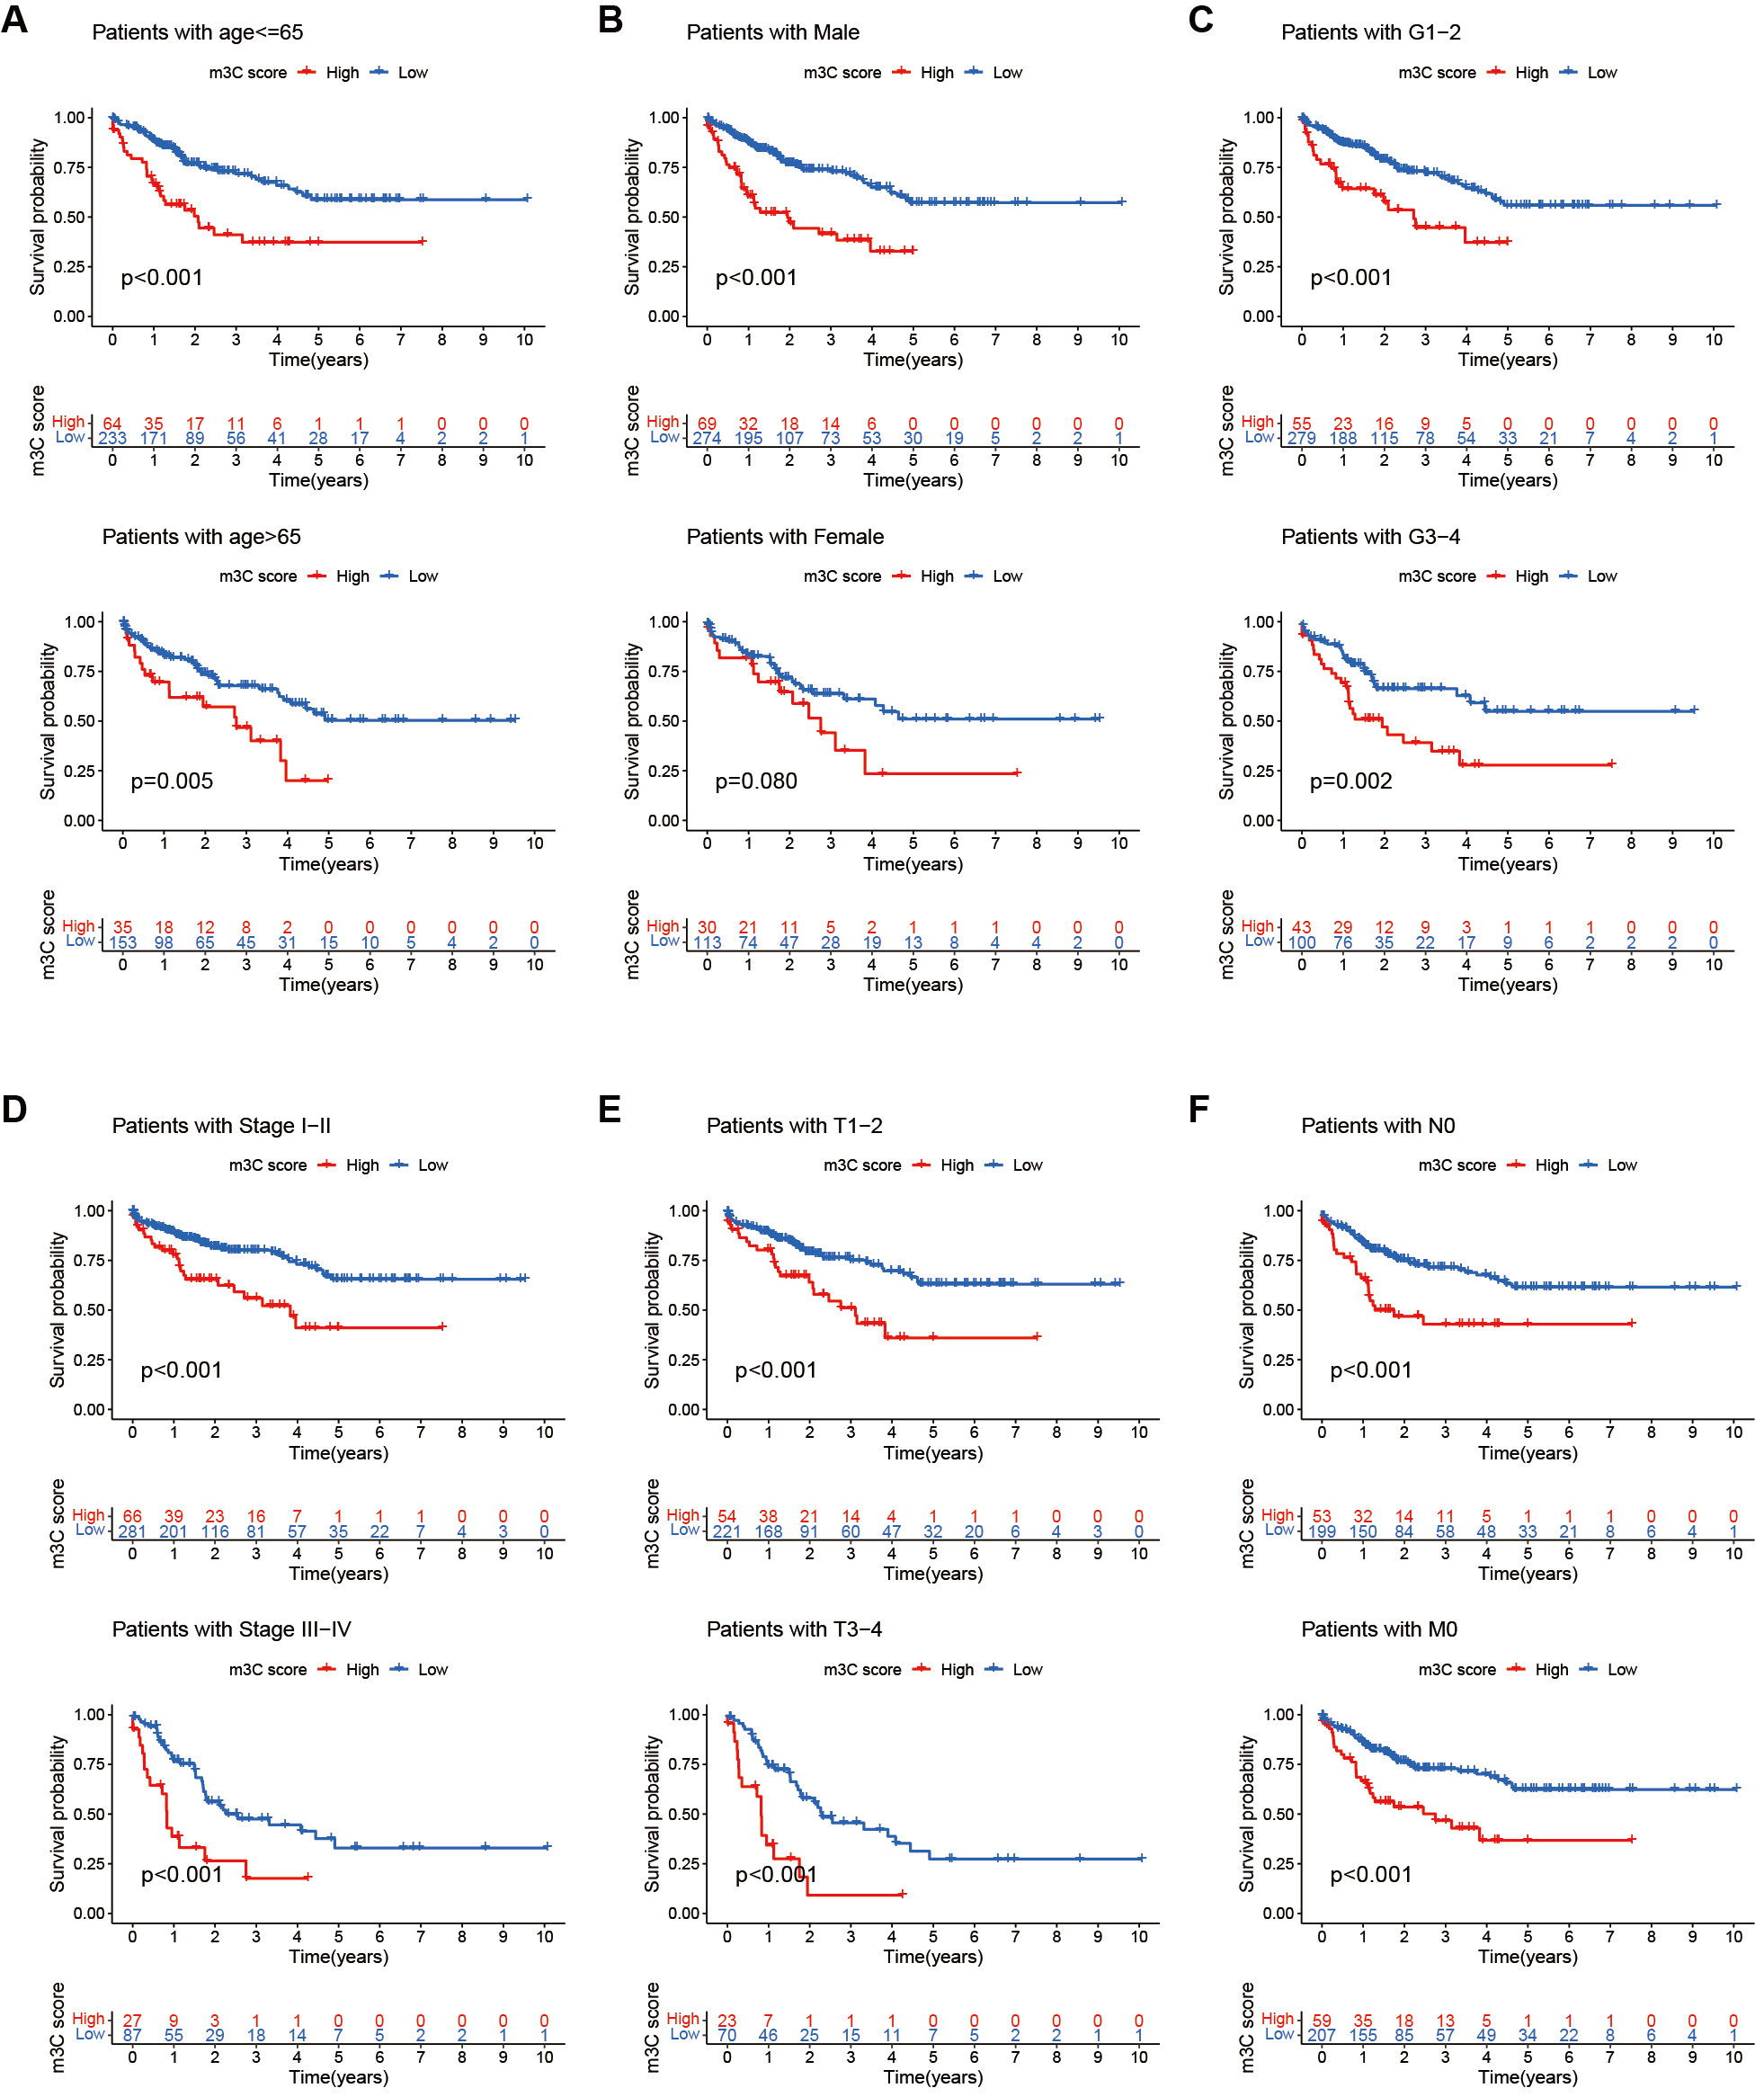
Figure 8. Clinical evaluation of the m3C score. (A-F) Comparison of 5-year survival rates between high and low m3C score groups across different age groups, genders, and tumor T, N, and M stages. Survival analysis revealed that patients with low m3C scores consistently exhibited higher 5-year survival rates than those with high scores in multiple clinical subgroups (P < 0.05). m3C:


