


fig5
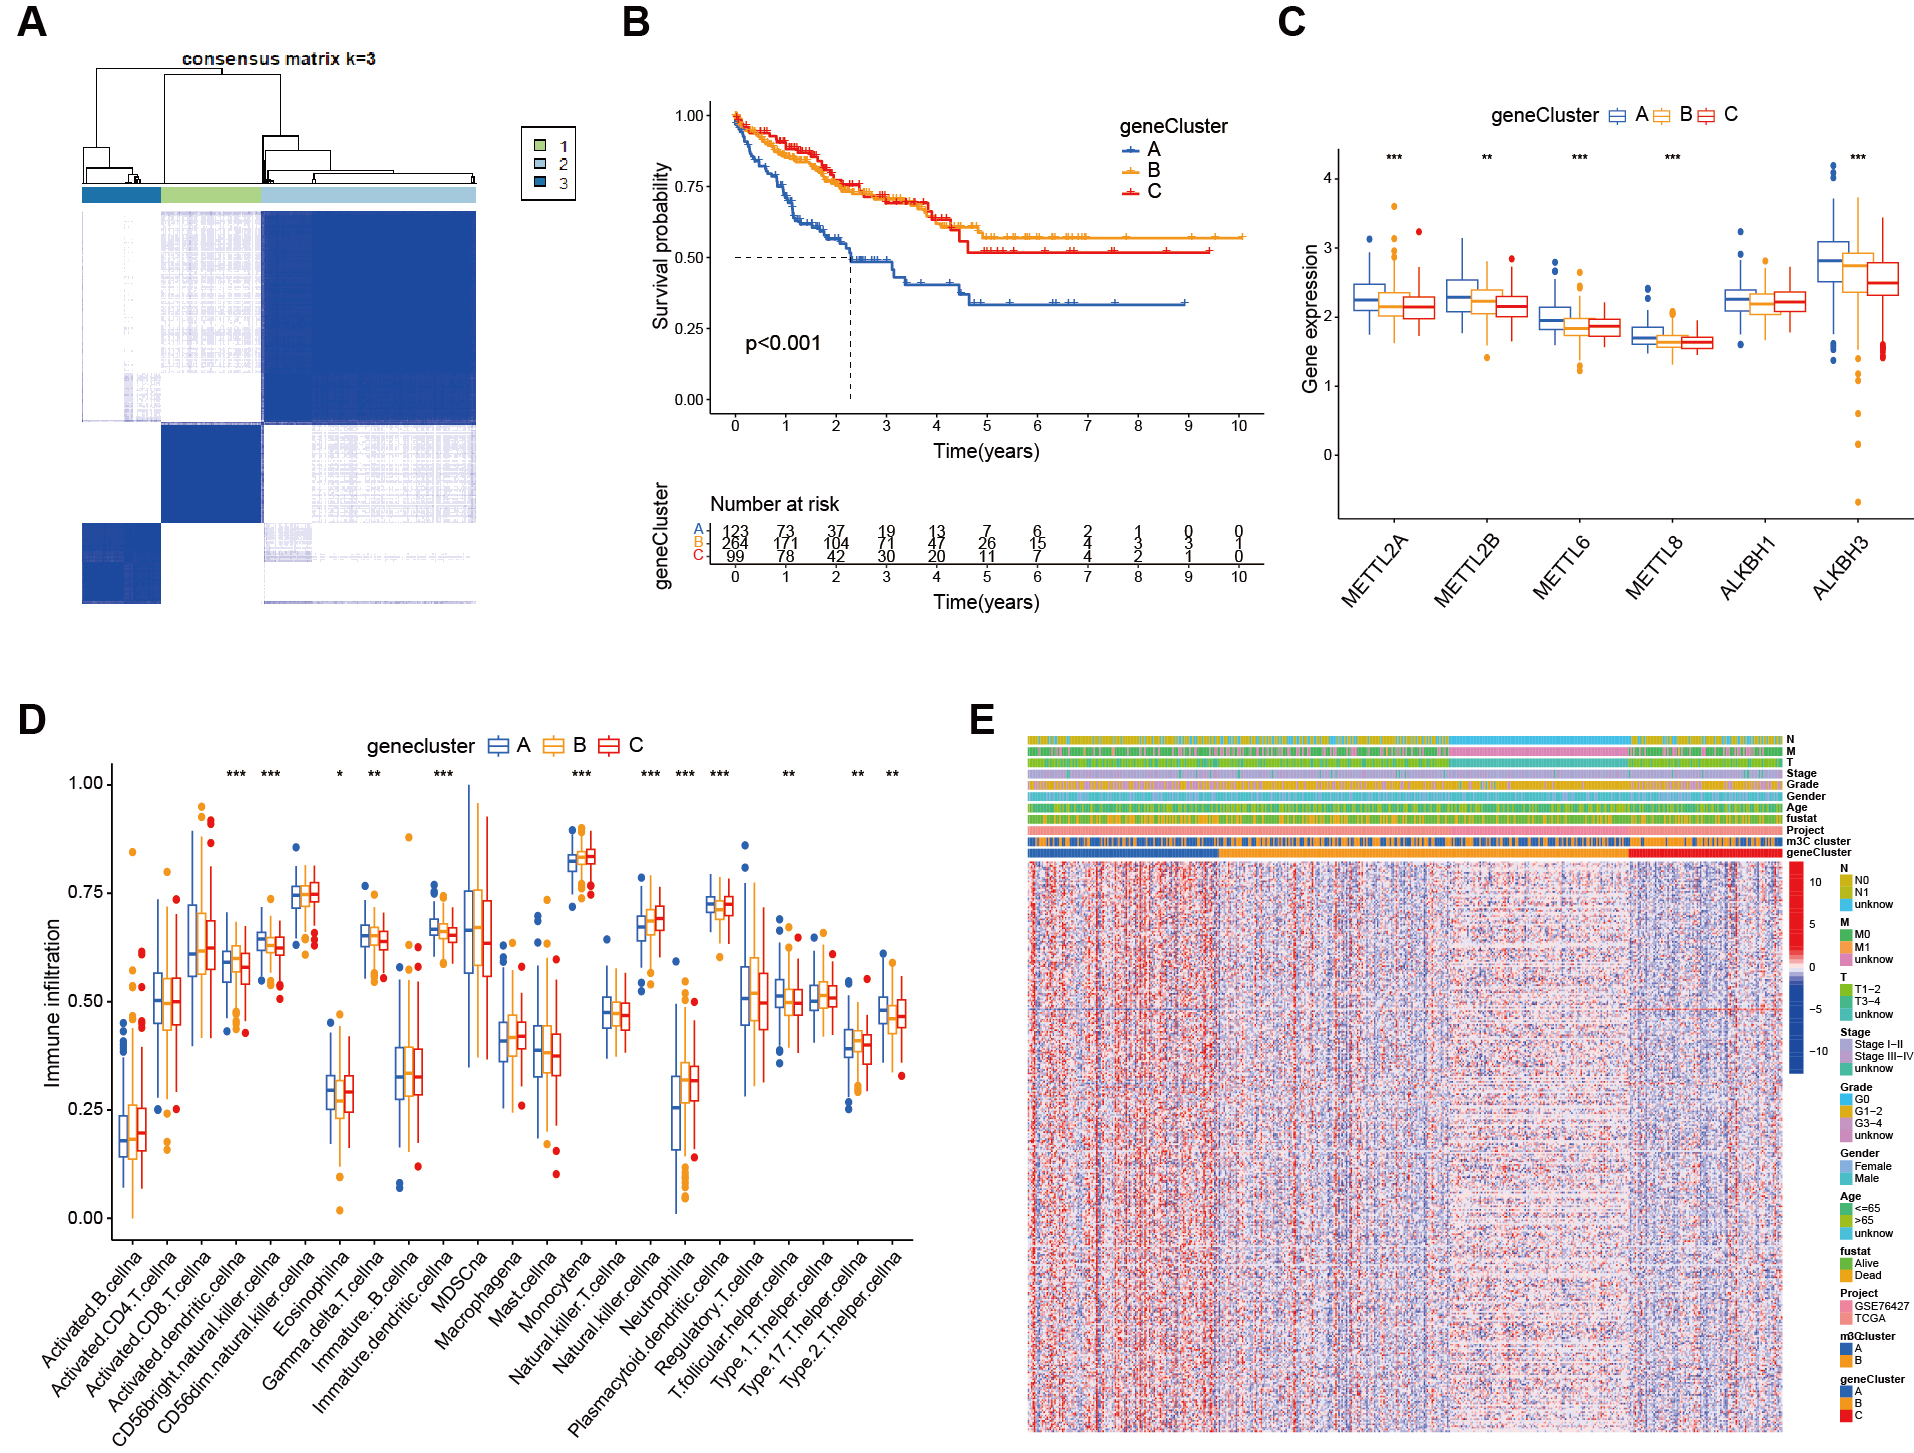
Figure 5. Functional annotation of m3C-related genes. (A) From the DEGs, 330 genes related to HCC prognosis were screened and patients were clustered accordingly, with the most stable results observed when dividing into three groups; (B) Kaplan-Meier survival analysis showed a significant difference between the three genotyping groups; patients in genotype A had a significantly poorest prognosis (P < 0.01); (C) Box plots showed differential expression of m3C molecules across the genotypes; (D) Heatmaps based on genotyping revealed distinct clinical characteristics between the groups; (E) ssGSEA analysis demonstrated the abundance of TME infiltrating cells across the two m3C modification subtypes (*** P <0.001, ** P <0.01, * P < 0.05, ns > 0.05). m3C: 3-methylcytidine; DEGs: differentially expressd genes; HCC: hepatocellular carcinoma; ssGSEA: single-sample gene set enrichment analysis; TME: tumor microenvironment; ns: not significant.


