

Growth redox conditions and interface effects govern polarization switching speed, retention and reliability in epitaxial Hf0.5Zr0.5O2 thin films
 0
0 Graphical Abstract
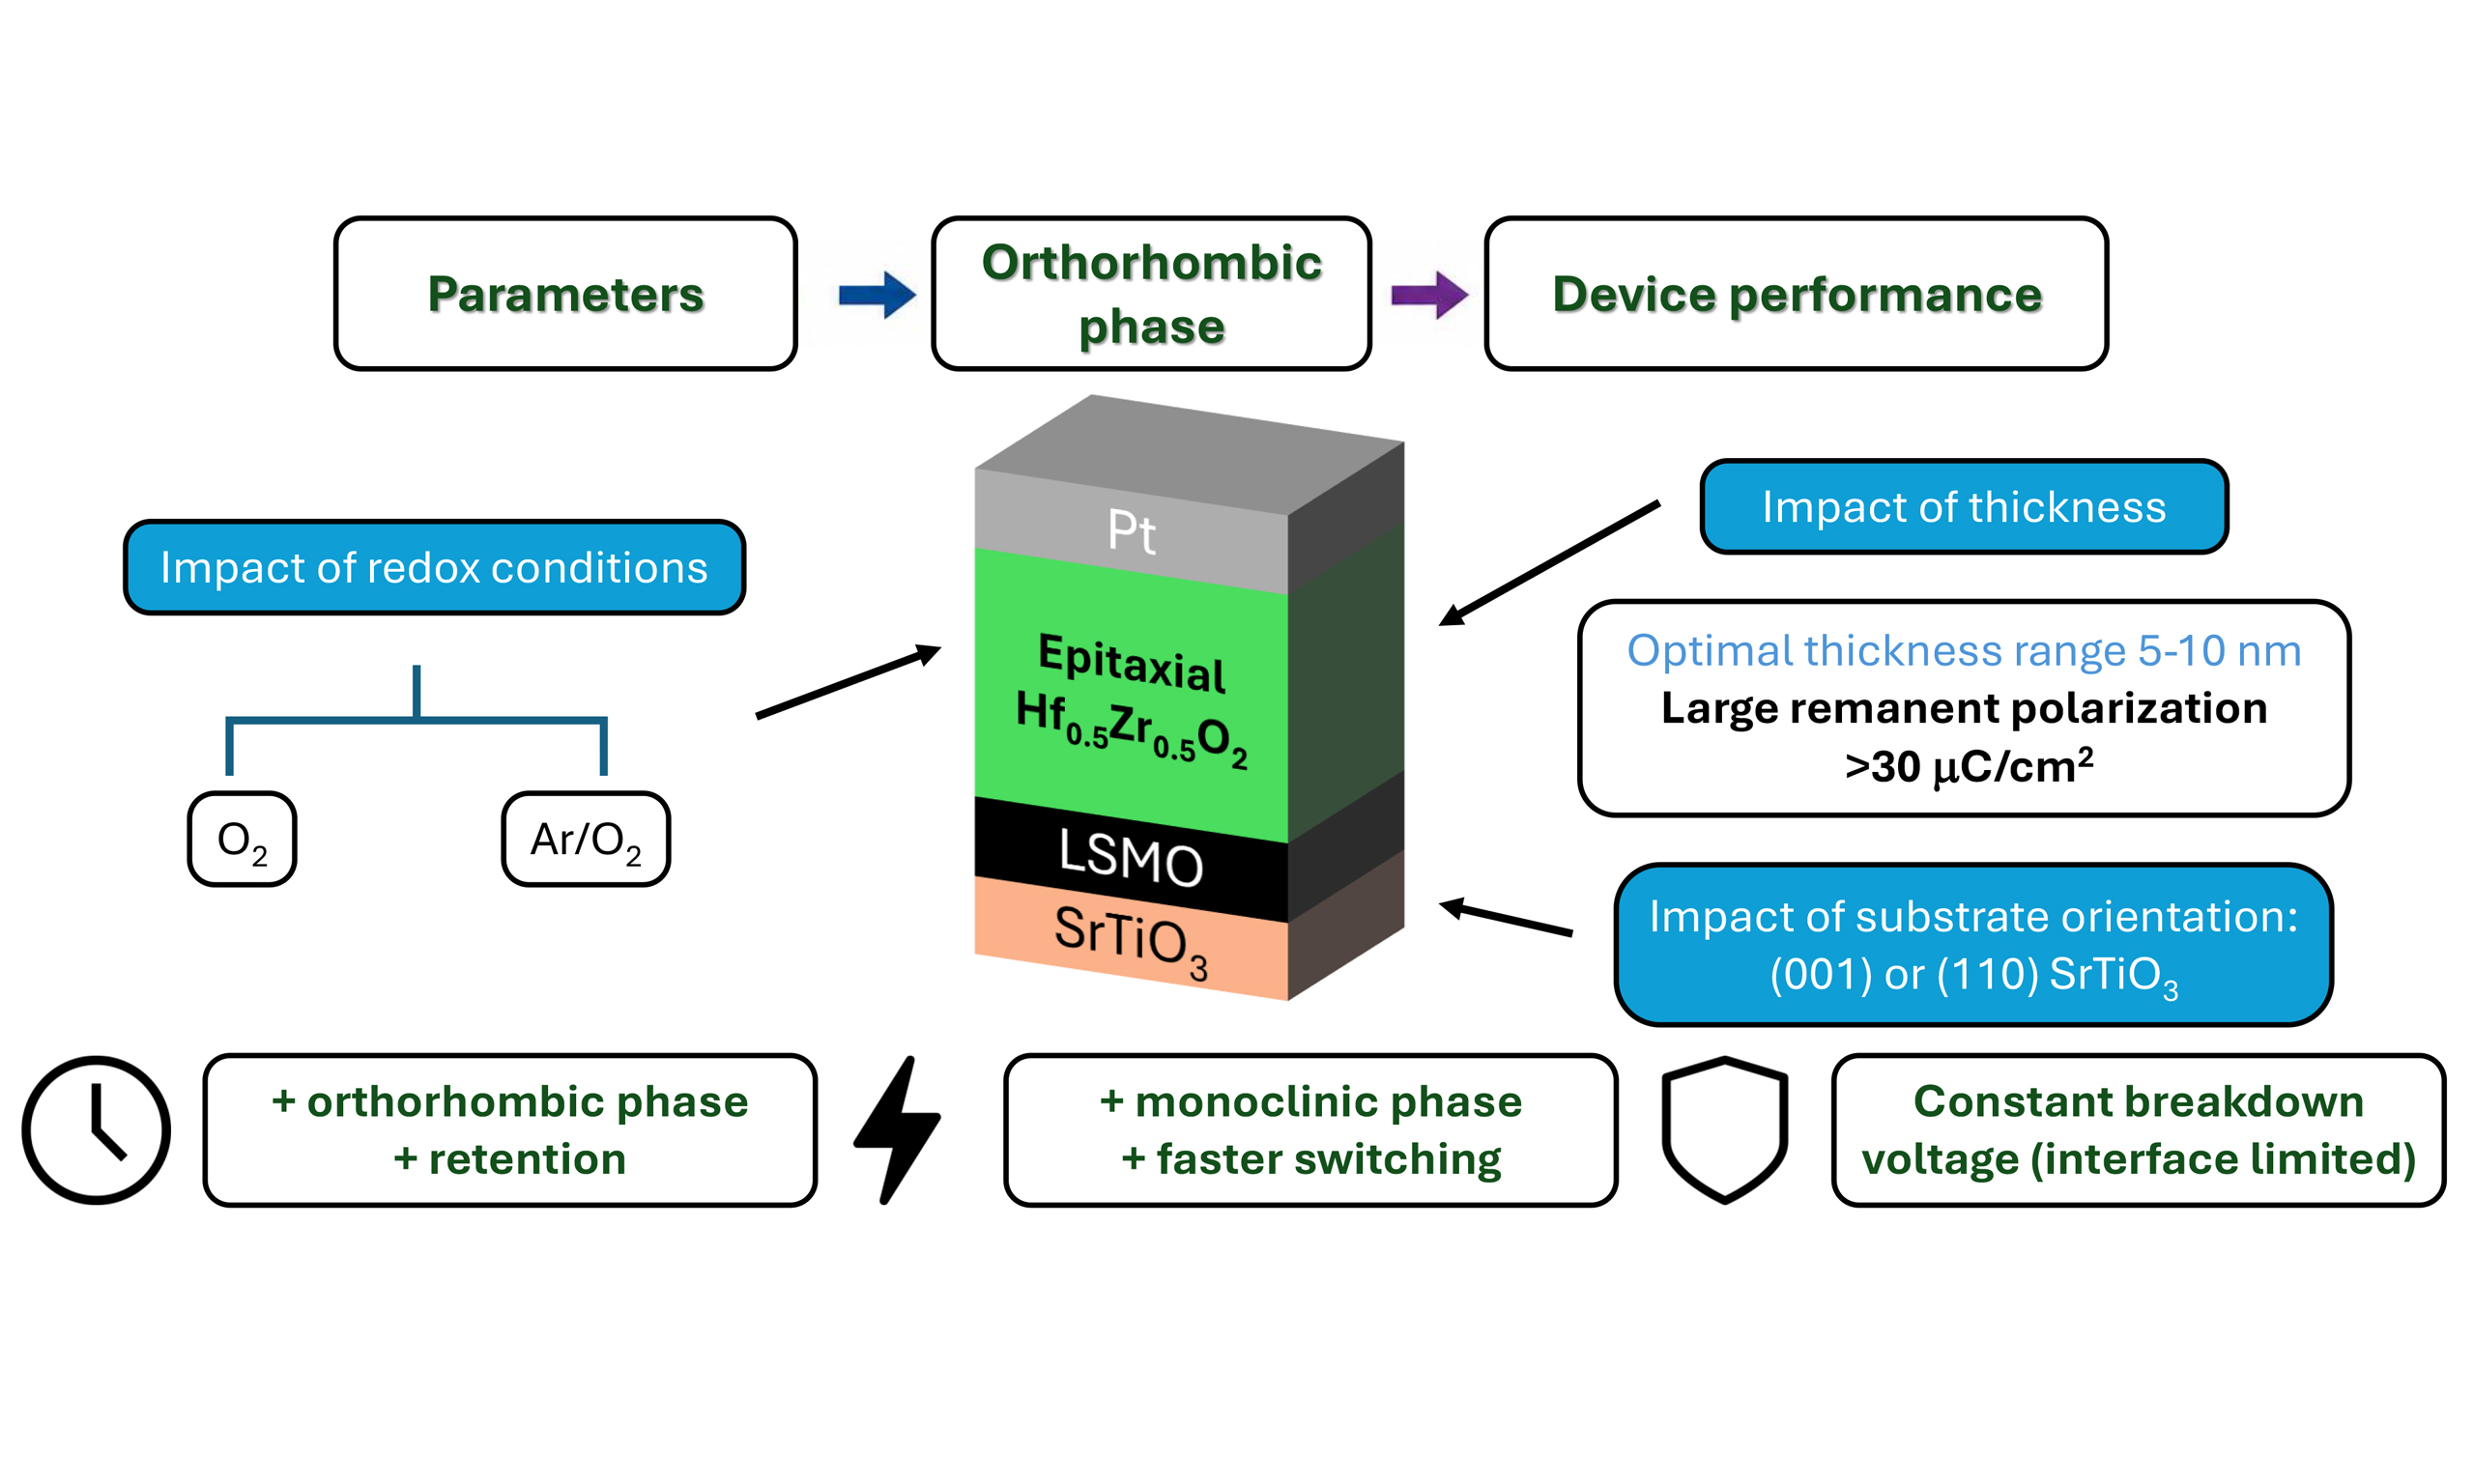
Abstract
Ferroelectric HfO2-based thin films are promising for next-generation non-volatile memories. Achieving further understanding of how the interfaces and defects influence switching dynamics and reliability is essential for device optimization. Here, we investigate the polarization switching kinetics, breakdown strength, and retention of a series of epitaxial Hf0.5Zr0.5O2 (HZO) of increasing thickness and grown using different oxidation conditions on substrates with different orientations. Time-dependent ferroelectric characterization shows that films in the intermediate thickness range (≈5-10 nm), which exhibit the largest remanent polarization (above 30 μC/cm2), show slower switching. In addition, polarity-dependent switching kinetics is observed in ultrathin films, which is attributed to built-in electric fields associated with asymmetry between interfaces. Reliability analysis shows that the breakdown electric field decreases with increasing thickness, reaching up to
Keywords


 Download PDF
INTRODUCTION
Since the first report of ferroelectric response in HfO2[1], this material has emerged as a key material for next-generation non-volatile memories[2,3], in particular in compositions such as Hf0.5Zr0.5O2 (HZO)[4]. Several critical factors have been identified as influencing functional properties, and these include dopants, film thickness, interfaces, stress, and defects, particularly oxygen vacancies[5-12].
It has been demonstrated that epitaxial growth on perovskite substrates enables stabilization of the orthorhombic phase with high ferroelectric polarization[13,14]. The lattice mismatch is very large; however, the orthorhombic phase is epitaxially stabilized through the domain-matching epitaxy (DME) mechanism[15]. Contrary to conventional epitaxy, DME involves the formation of structurally relaxed grains during film nucleation. Epitaxial growth is enabled by the periodic insertion or absence of an extra crystal plane, which reduces the residual elastic strain. Consequently, DME strongly depends on the substrate or bottom electrode layer, as well as on the interface. Thus, interfaces play a decisive role in epitaxial HfO2 films, and bottom electrode and/or substrate crystallographic orientation and symmetry mismatch have been shown to strongly impact ferroelectric orthorhombic phase formation[16-18]. In the widely investigated case of SrTiO3 (STO) as a substrate and La0.67Sr0.33MnO3 (LSMO) as the bottom electrode, the orthorhombic phase of HfO2 crystallizes with (111) orientation (3-fold symmetry) on both STO(001) (4-fold symmetry) and STO(110) (2-fold symmetry) substrates[19,20]. Films on STO(110) have a higher orthorhombic phase content and lower monoclinic phase content than equivalent films on STO(001), indicating that residual stress in the film due to the interface mismatch is lower when using this substrate[20]. Consequently, higher ferroelectric polarization has been reported in doped HfO2 films grown on (110)-oriented substrates[19-22]. However, the influence of substrate orientation on switching dynamics, retention, and breakdown electric field (EBD) has not yet been systematically investigated.
Redox conditions during growth are also critical. Oxygen vacancies are known to influence the relative stability of competing polymorphs and can promote the formation of the ferroelectric orthorhombic phase when present in optimal concentrations[9,20,23-25]. While excessive oxygen deficiency may lead to leakage and reliability degradation, moderate reducing conditions have been shown to enhance polarization without compromising endurance in epitaxial HfO2 films. On the other hand, cooling conditions after deposition of epitaxial films have little effect on functional properties[26]. In ferroelectric hafnia, fast polarization switching dynamics and long-term retention properties are also required, and in previous studies these have been linked to domain nucleation, domain wall motion, and defect-domain interactions, all of which are in turn also influenced by grain boundaries and oxygen vacancy concentrations[27-30]. Additionally, the coexistence of ionic dynamics with the ferroelectric phase can enhance the resistive ON/OFF ratio, increasing the functionality of the material and demonstrating its potential for integration into in-memory computing platforms[31].
Despite the extensive literature on phase stabilization and polarization enhancement in hafnia films, the impact of interface symmetry and redox growth conditions on switching kinetics and retention remains insufficiently explored in epitaxial systems. In this work, we address these questions by investigating the polarization switching behavior and retention properties of epitaxial HZO films on STO(110) and STO(001) substrates grown under different oxidation conditions. We show that switching kinetics and reliability are strongly governed by the interplay between film thickness, interface symmetry, and growth atmosphere.
EXPERIMENTAL
Two series of HZO films with thicknesses ranging from 4.5 to 18.1 nm were grown on STO(001) and STO(110) substrates buffered with a ~25 nm LSMO bottom electrode under an O2 atmosphere with an oxygen pressure of 0.1 mbar (denoted as STO(001) O2 and STO(110) O2 series, respectively). Another series of films with thicknesses ranging from 3.6 to 14.4 nm on STO(110) was deposited under an O2/Ar atmosphere with an argon partial pressure of 0.05 mbar and an oxygen partial pressure of 0.05 mbar (denoted as STO(110) O2/Ar series). Both the LSMO electrode and HZO layers were deposited sequentially in a single PLD process using a KrF excimer laser. The LSMO electrodes were deposited at a substrate temperature of 700 °C under an oxygen pressure of 0.1 mbar. The HZO films were deposited at 800 °C . After deposition, the samples were cooled immediately under 0.2 mbar of oxygen. Circular Pt top electrodes
RESULTS AND DISCUSSION
Figure 1A shows the XRD χ-2θ maps collected around the orthorhombic o-(111) reflection for all samples in the three series. The thickness of each HZO film is indicated above the corresponding diffraction map. In all cases, a sharp and well-defined diffraction spot corresponding to the o-(111) reflection is observed at 2θ ≈ 30°, indicating the stabilization of the orthorhombic phase. The nearly circular shape of the reflection confirms the high crystalline quality of the films and the absence of significant mosaic spread, consistent with epitaxial growth. For samples grown on STO(110), an additional, more intense reflection at 2θ ≈ 32.4°, originating from the substrate and the LSMO electrode, is also observed. As the film thickness increases beyond ~10 nm, an additional spot corresponding to the monoclinic m-(-111) reflection becomes visible for all the films. Compared to the orthorhombic reflection, this peak appears more elongated along the χ angle, indicating a larger mosaicity of the monoclinic crystallites.
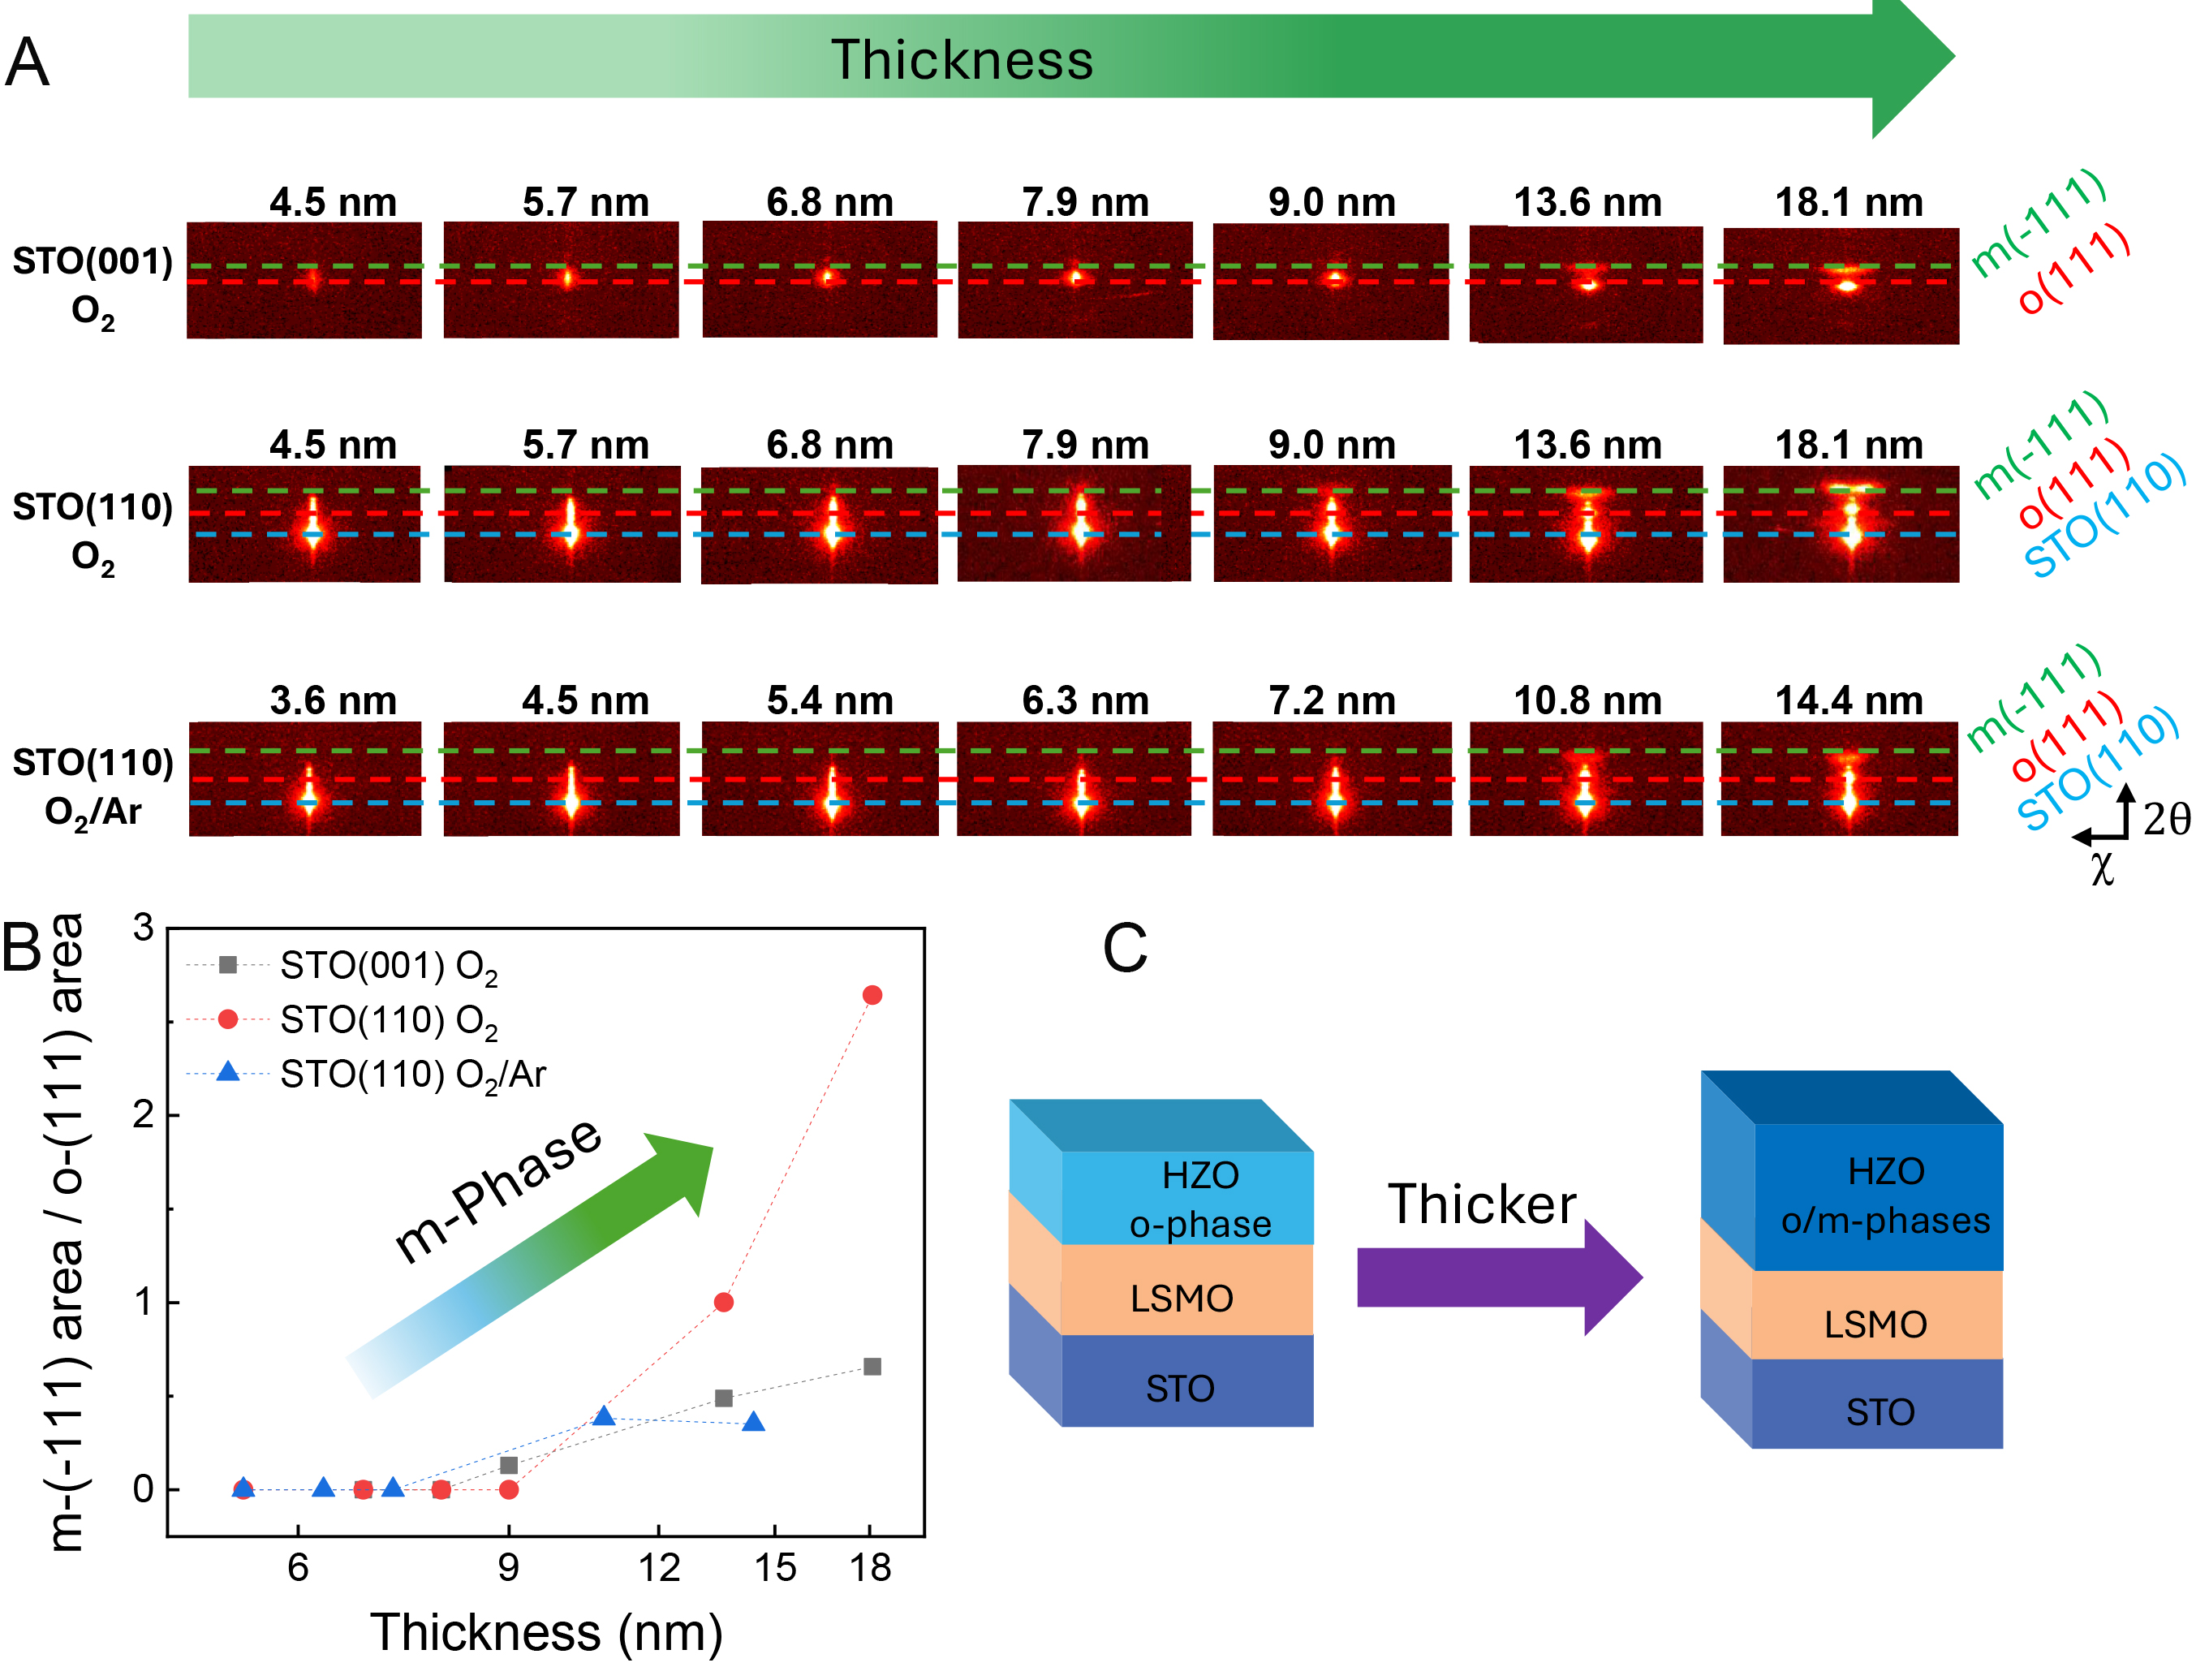
Figure 1. (A) χ-2θ diffraction images around the o-(111) reflection for HZO films of the indicated thickness for the three series:
To quantify the phase evolution, 2θ diffractograms were obtained by integrating the χ-2θ maps along χ within a range of ±10°, as shown in Supplementary Figure 1. From these integrated profiles, the area ratio between the monoclinic m-(-111) and orthorhombic o-(111) peaks was extracted and plotted as a function of film thickness in Figure 1B. The results reveal that for thinner films, only the orthorhombic phase is detected. As the film thickness increases, the monoclinic phase fraction also increases across all sample series. Similar epitaxial doped HfO2 films exhibit a columnar grain microstructure, irrespective of whether the grains are orthorhombic or monoclinic, as consistently demonstrated by transmission electron microscopy in previous works[15,21]. The found thickness dependence trend is particularly pronounced for films in the STO(110) O2 series. The structural evolution with thickness described above is schematically represented in the sketch of Figure 1C.
Figure 2A-C presents the positive-up-negative-down (PUND) polarization-electric field (P-E) hysteresis loops measured in the pristine state for the three series of samples. The corresponding current-electric field characteristics are provided in Supplementary Figure 2. All samples exhibit well-defined ferroelectric hysteresis loops, confirming the presence of switchable ferroelectric polarization. The thickness dependence of the remanent polarization (Pr) is shown in Figure 2D. The data reveal a non-monotonic behavior, with reduced Pr observed in both very thin and thick films. The Pr increases from ~8.6 μC/cm2 for the 4.5 nm film to a maximum of 23.4 μC/cm2 for the 9 nm film of the STO(001) O2 series, whereas in the
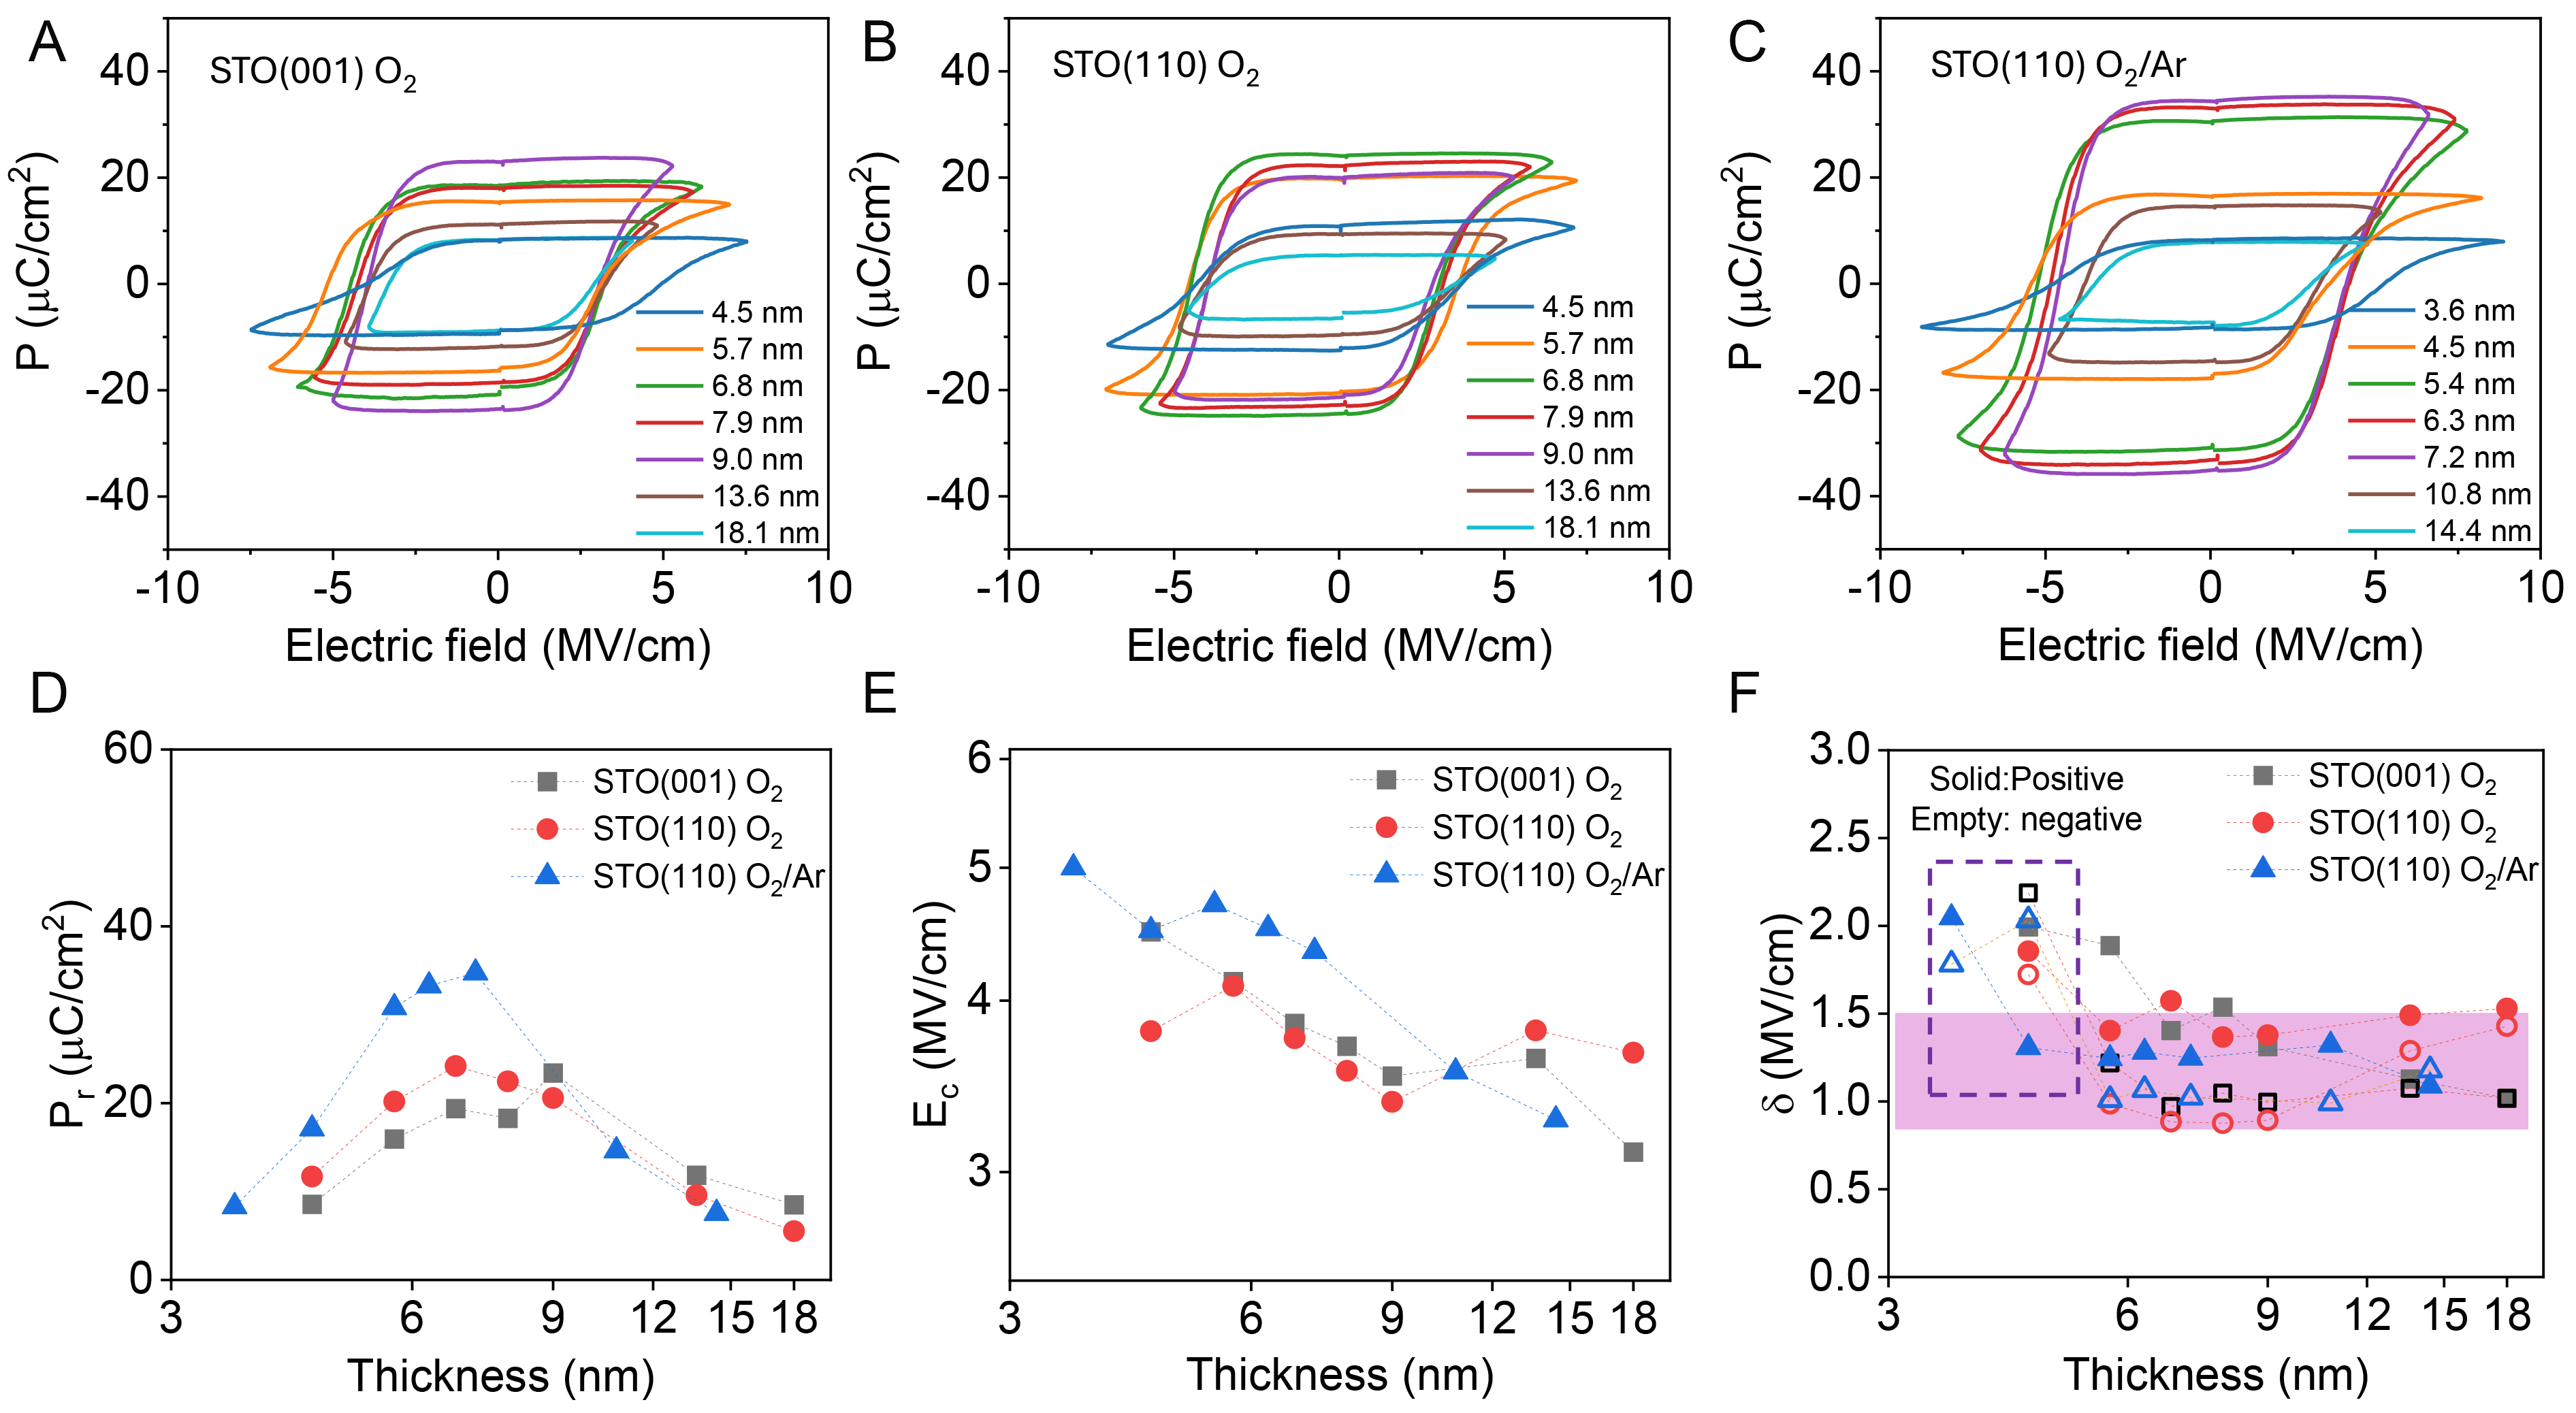
Figure 2. (A-C) Polarization-electric field (P-E) hysteresis loops measured using the PUND method for the three series of samples: (A) STO(001) O2, (B) STO(110) O2, and (C) STO(110) O2/Ar. (D) Thickness dependence of the remanent polarization (Pr) for the three series of samples. (E) Thickness dependence of the coercive field (Ec). (F) Thickness dependence of the coercive field distribution parameter δ extracted from the fitting of the hysteresis loops.
To gain further insight into the switching characteristics, the P-E loops were fitted using a model describing the ferroelectric polarization response[36]:
where P0 is the saturation polarization, Ec is the coercive field, E is the applied electric field, and δ represents the width of the coercive field distribution. This semi-empirical method provides a convenient measure of switching inhomogeneity represented by δ. The corresponding fits are shown in
Figure 3A-C shows the polarization time-dependent switching spectra measured using the PUND method (see Section “EXPERIMENTAL” for details) for the three series, under both positive and negative writing voltages (Vw). The leakage correction procedure is detailed in Supplementary Figure 4. The corresponding polarization-electric field loops obtained for different writing pulse widths are presented in
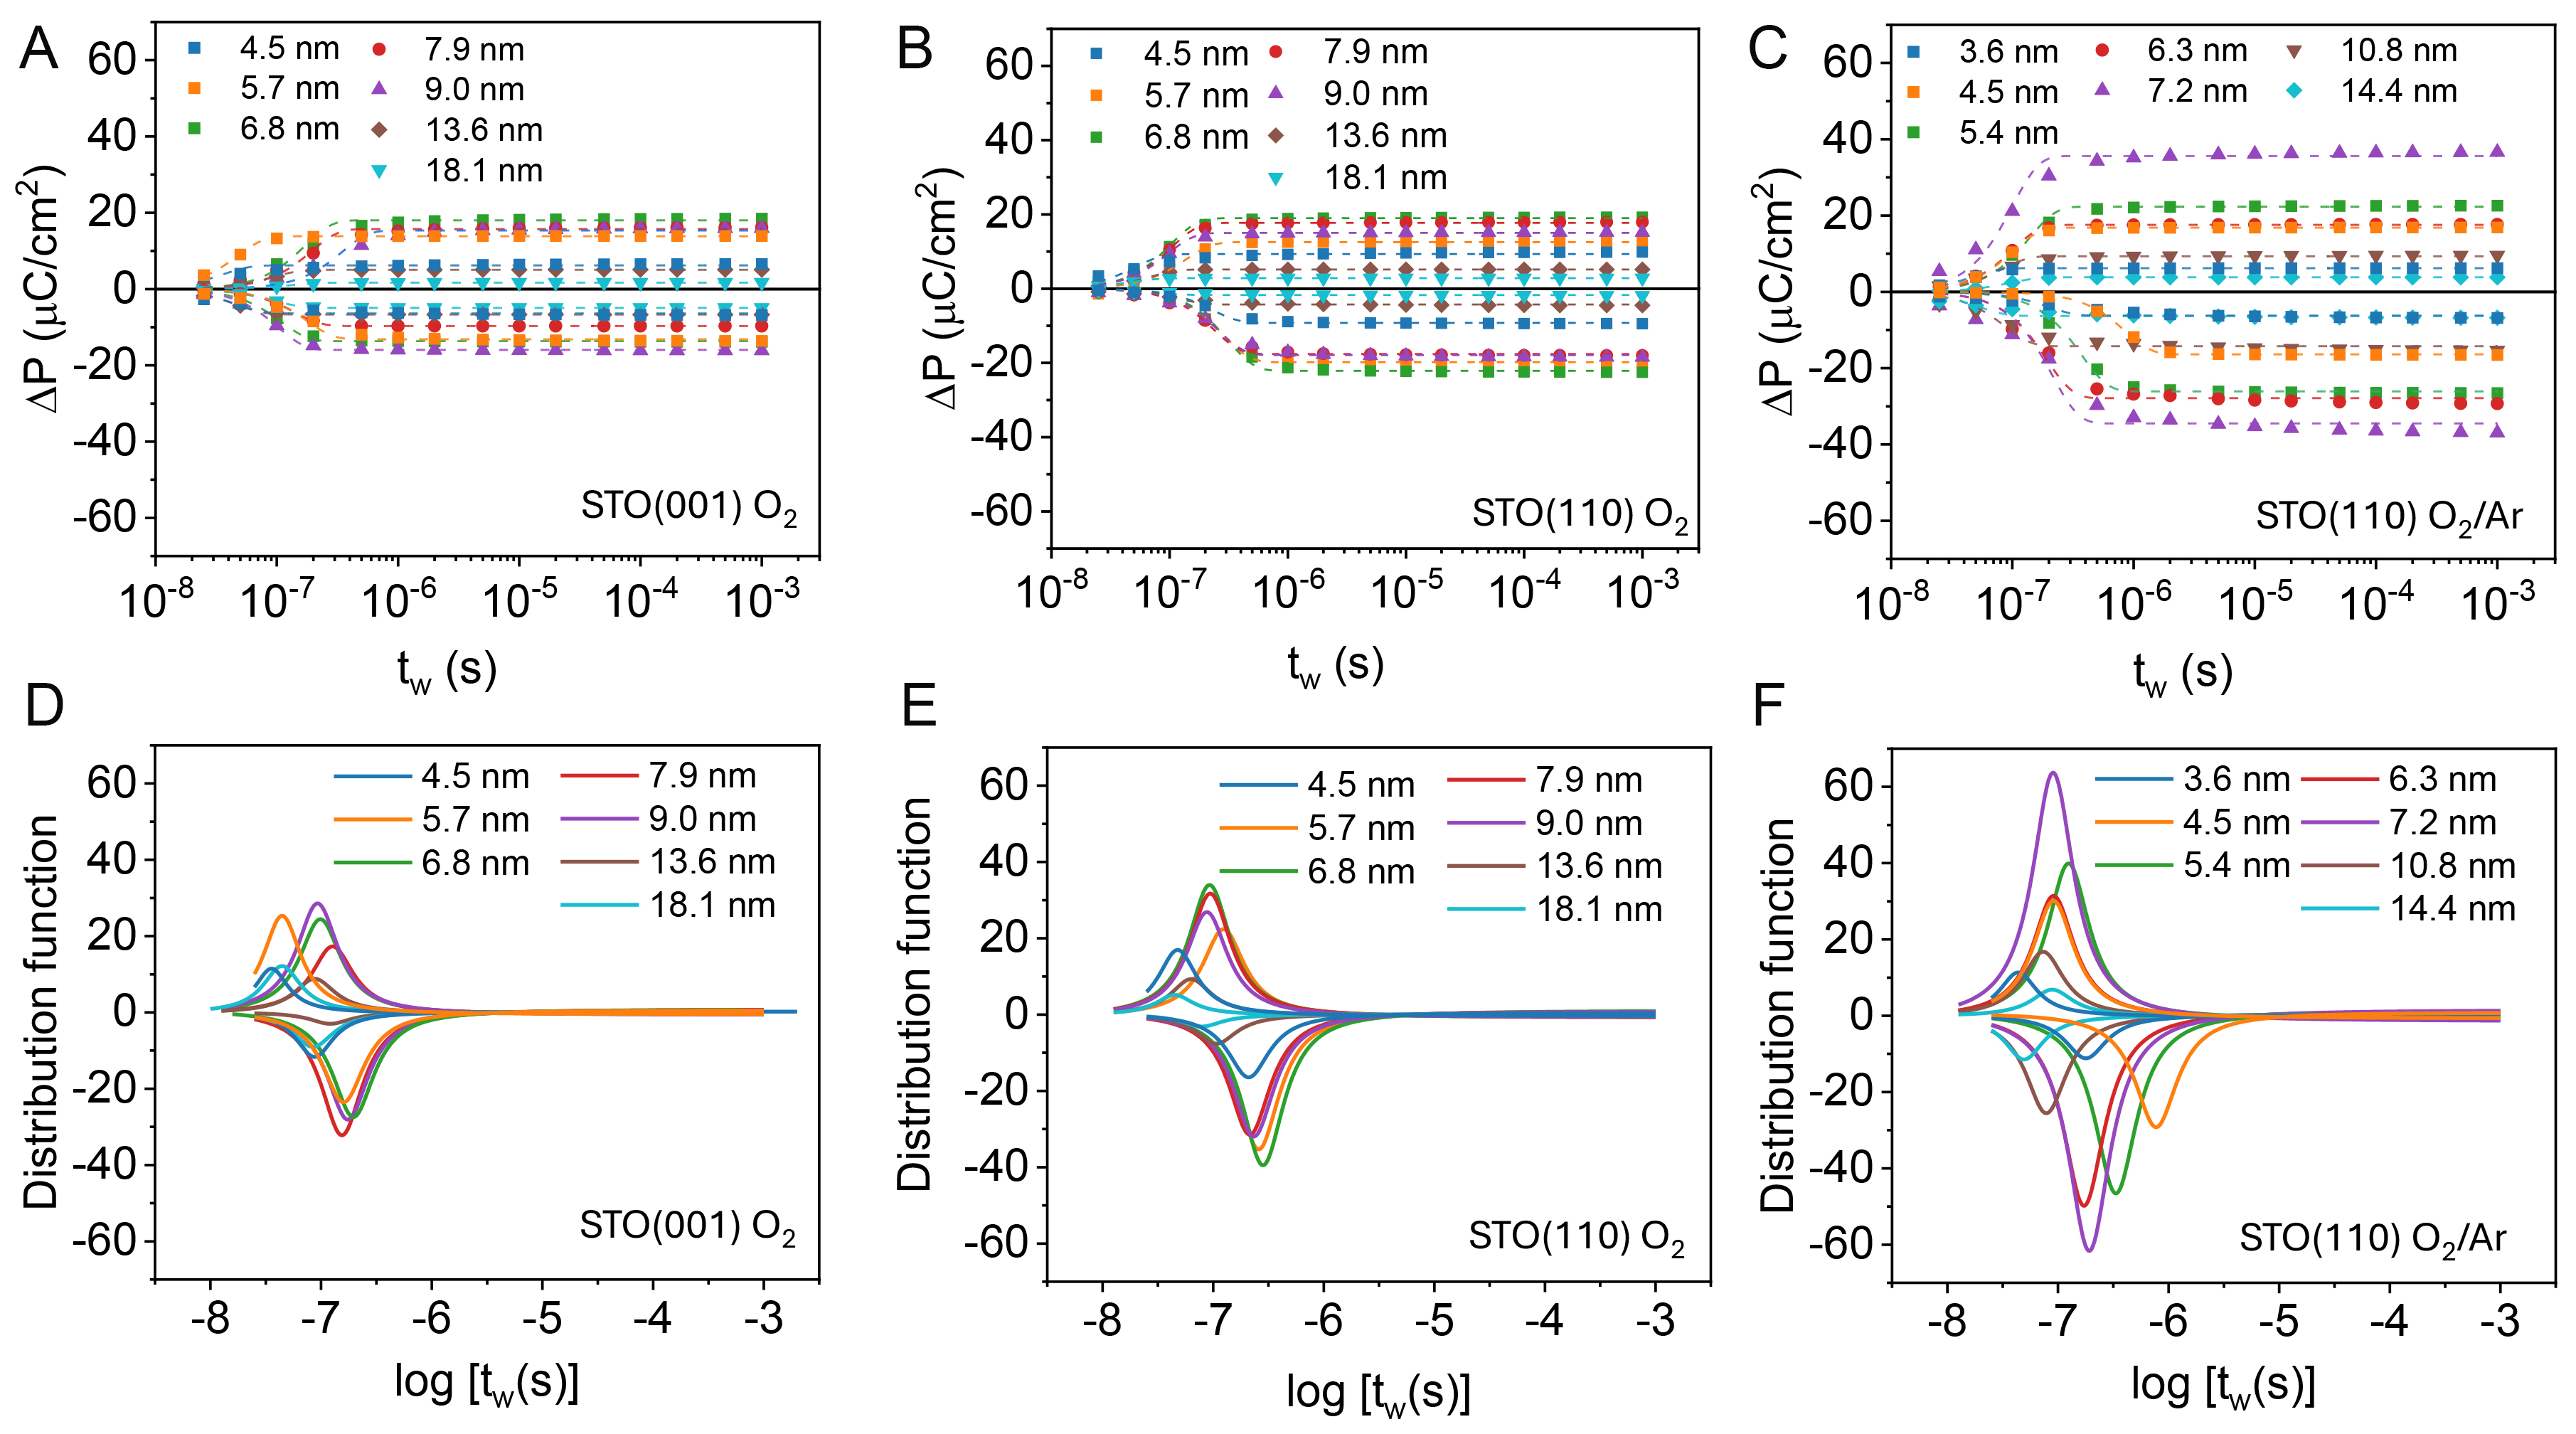
Figure 3. (A-C) ∆P as a function of writing pulse width (tw) measured by PUND for the three sample series: (A) STO(001) O2, (B) STO(110) O2, and (C) STO(110) O2/Ar. Dashed lines correspond to fits using the nucleation-limited switching (NLS) model. (D-F) Corresponding Lorentzian distributions of local switching times extracted from the NLS fitting for the three series of samples.
For the thinnest films (below ~5 nm), small variations in the shape of the I-V and P-V loops during the first cycles are observed [Supplementary Figure 6], although these variations remain relatively minor. In the case of the 4.5 nm STO(110) O2/Ar series, where this variation is most noticeable, and a significant reduction in the switching time is observed after electrical cycling [Supplementary Figure 7]. This switching time reduction indicates that the redistribution of defects at the interface can influence the switching dynamics. To further analyze the switching kinetics, the experimental ∆P-tw data were fitted over the entire experimental range using the nucleation-limited switching (NLS) model[37], which accounts for a distribution of local switching times:
where n is the effective dimensionality of domain growth (fixed at n = 2), τ is the characteristic switching time, and F(logτ) is the Lorentzian distribution for the logarithm of switching time. The Lorentzian distribution can be expressed as:
where A is a normalization constant, w accounts for the width of the distribution, and logt1 represents the central value of the distribution.
The extracted distribution functions are shown in Figure 3D-F, while the corresponding fitting parameters are summarized in Supplementary Tables 1-3. For STO(001) O2 series, the switching time distribution is relatively narrow and symmetric for the two polarities, indicating similar switching dynamics under positive and negative fields. In contrast, STO(110) O2 series exhibits broader distributions and a more pronounced and systematic difference between positive and negative switching times. This asymmetry becomes even more important for the STO(110) O2/Ar series, where the switching distributions indicate faster switching for one polarity.
Figure 4A shows the thickness dependence of the characteristic switching time extracted from the NLS fitting of the switching spectroscopy data presented in Figure 3. The values are plotted for both positive and negative voltage polarities for the three sets of samples. For ultrathin films (thickness below ~6 nm), the characteristic switching time exhibits a pronounced dependence on the polarity of the applied electric field. In STO(110) O2 series, the extracted values change from log(t1) = -7.32 for positive polarity and -6.68 for negative polarity for the 4.5 nm film. A similar asymmetry is also observed for the STO(110) O2/Ar series, where the 3.6 nm film shows -7.36 for positive polarity and log(t1) ≈ -6.75 for negative polarity.
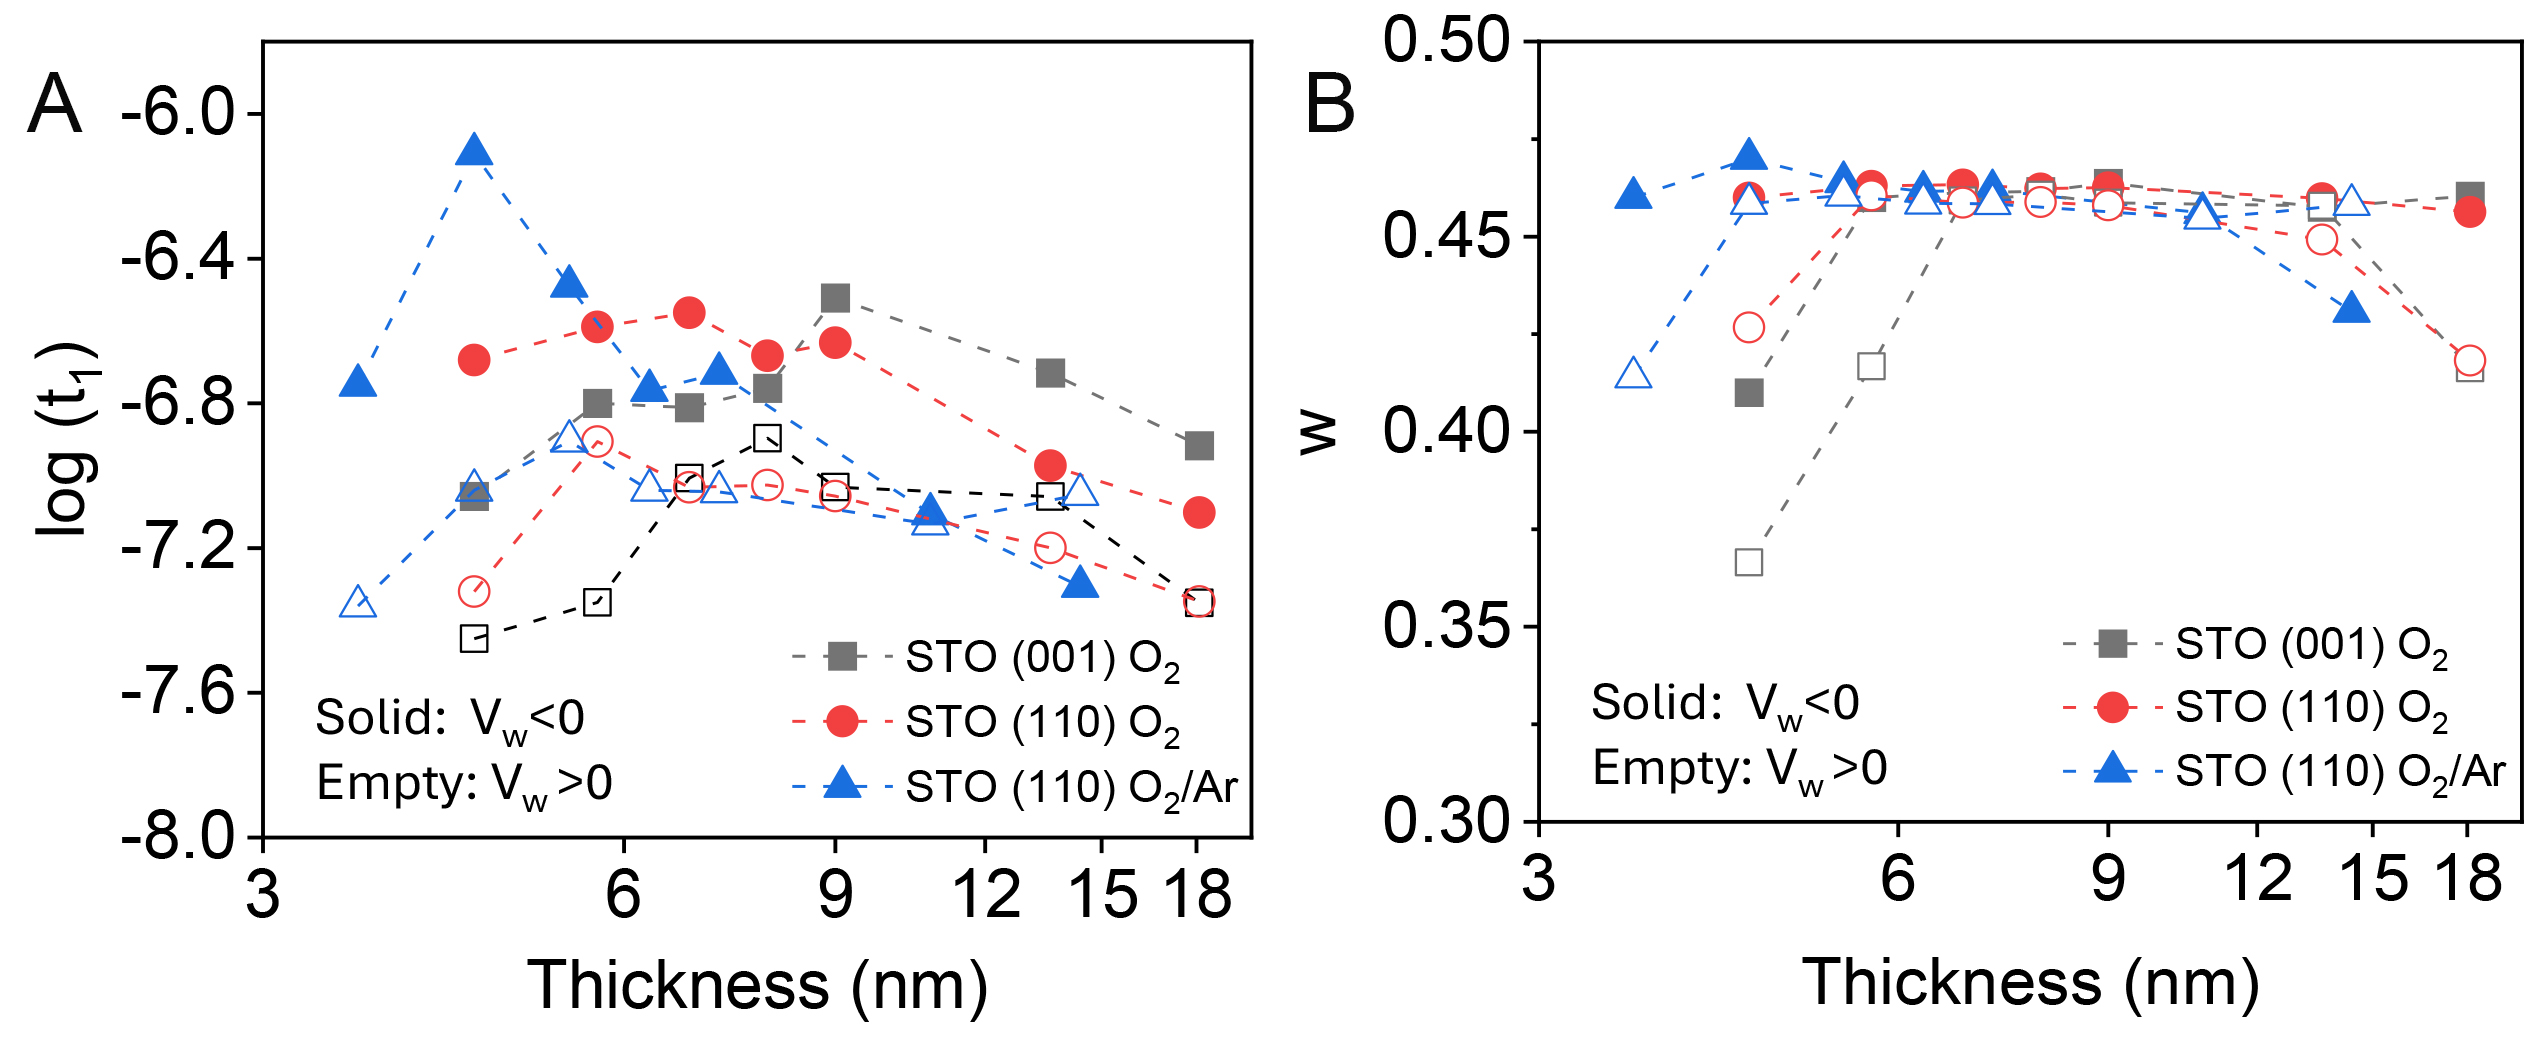
Figure 4. Thickness dependence of the switching parameters extracted from the NLS model fitting. (A) Characteristic switching time (log(t1)) as a function of film thickness and (B) width of distribution (w) of the switching time for the three series.
As the film thickness increases, above ~9 nm, the characteristic switching time gradually shifts toward smaller values, and the difference between the two polarities becomes significantly reduced. In the STO(110) O2 series, the switching time changes from log(t1) ≈ -6.6 in the 5-9 nm range to approximately -7.2 for films with thicknesses of 13.6-18.1 nm for the negative polarity (Vw < 0). The difference between positive and negative switching times decreases from log(t1) ≈ 0.60 at 4.5 nm to less than ~0.15 for films thicker than
Figures 5A-C show the Weibull statistical distribution of the EBD for the three sets of samples. Representative current-electric field curves used to determine the breakdown field for the different film thicknesses are shown in Supplementary Figure 9, except for the 3.6 nm film, which showed larger conductivity. The EBD was defined as the electric field at which a sudden increase in leakage current indicates dielectric failure. This, in the present case, occurs for negative polarity. The Weibull relationship is expressed as[38,39]:
where F(i) represents the cumulative breakdown probability, E is the applied electric field, E0 is the characteristic breakdown electric field, and β is the Weibull slope describing the dispersion of breakdown events. As shown in Figures 5A-C, the plots of ln[-ln(1 - F(i))] vs. ln(E) exhibit linear behavior for all samples. The characteristic breakdown fields extracted from the Weibull analysis are summarized in
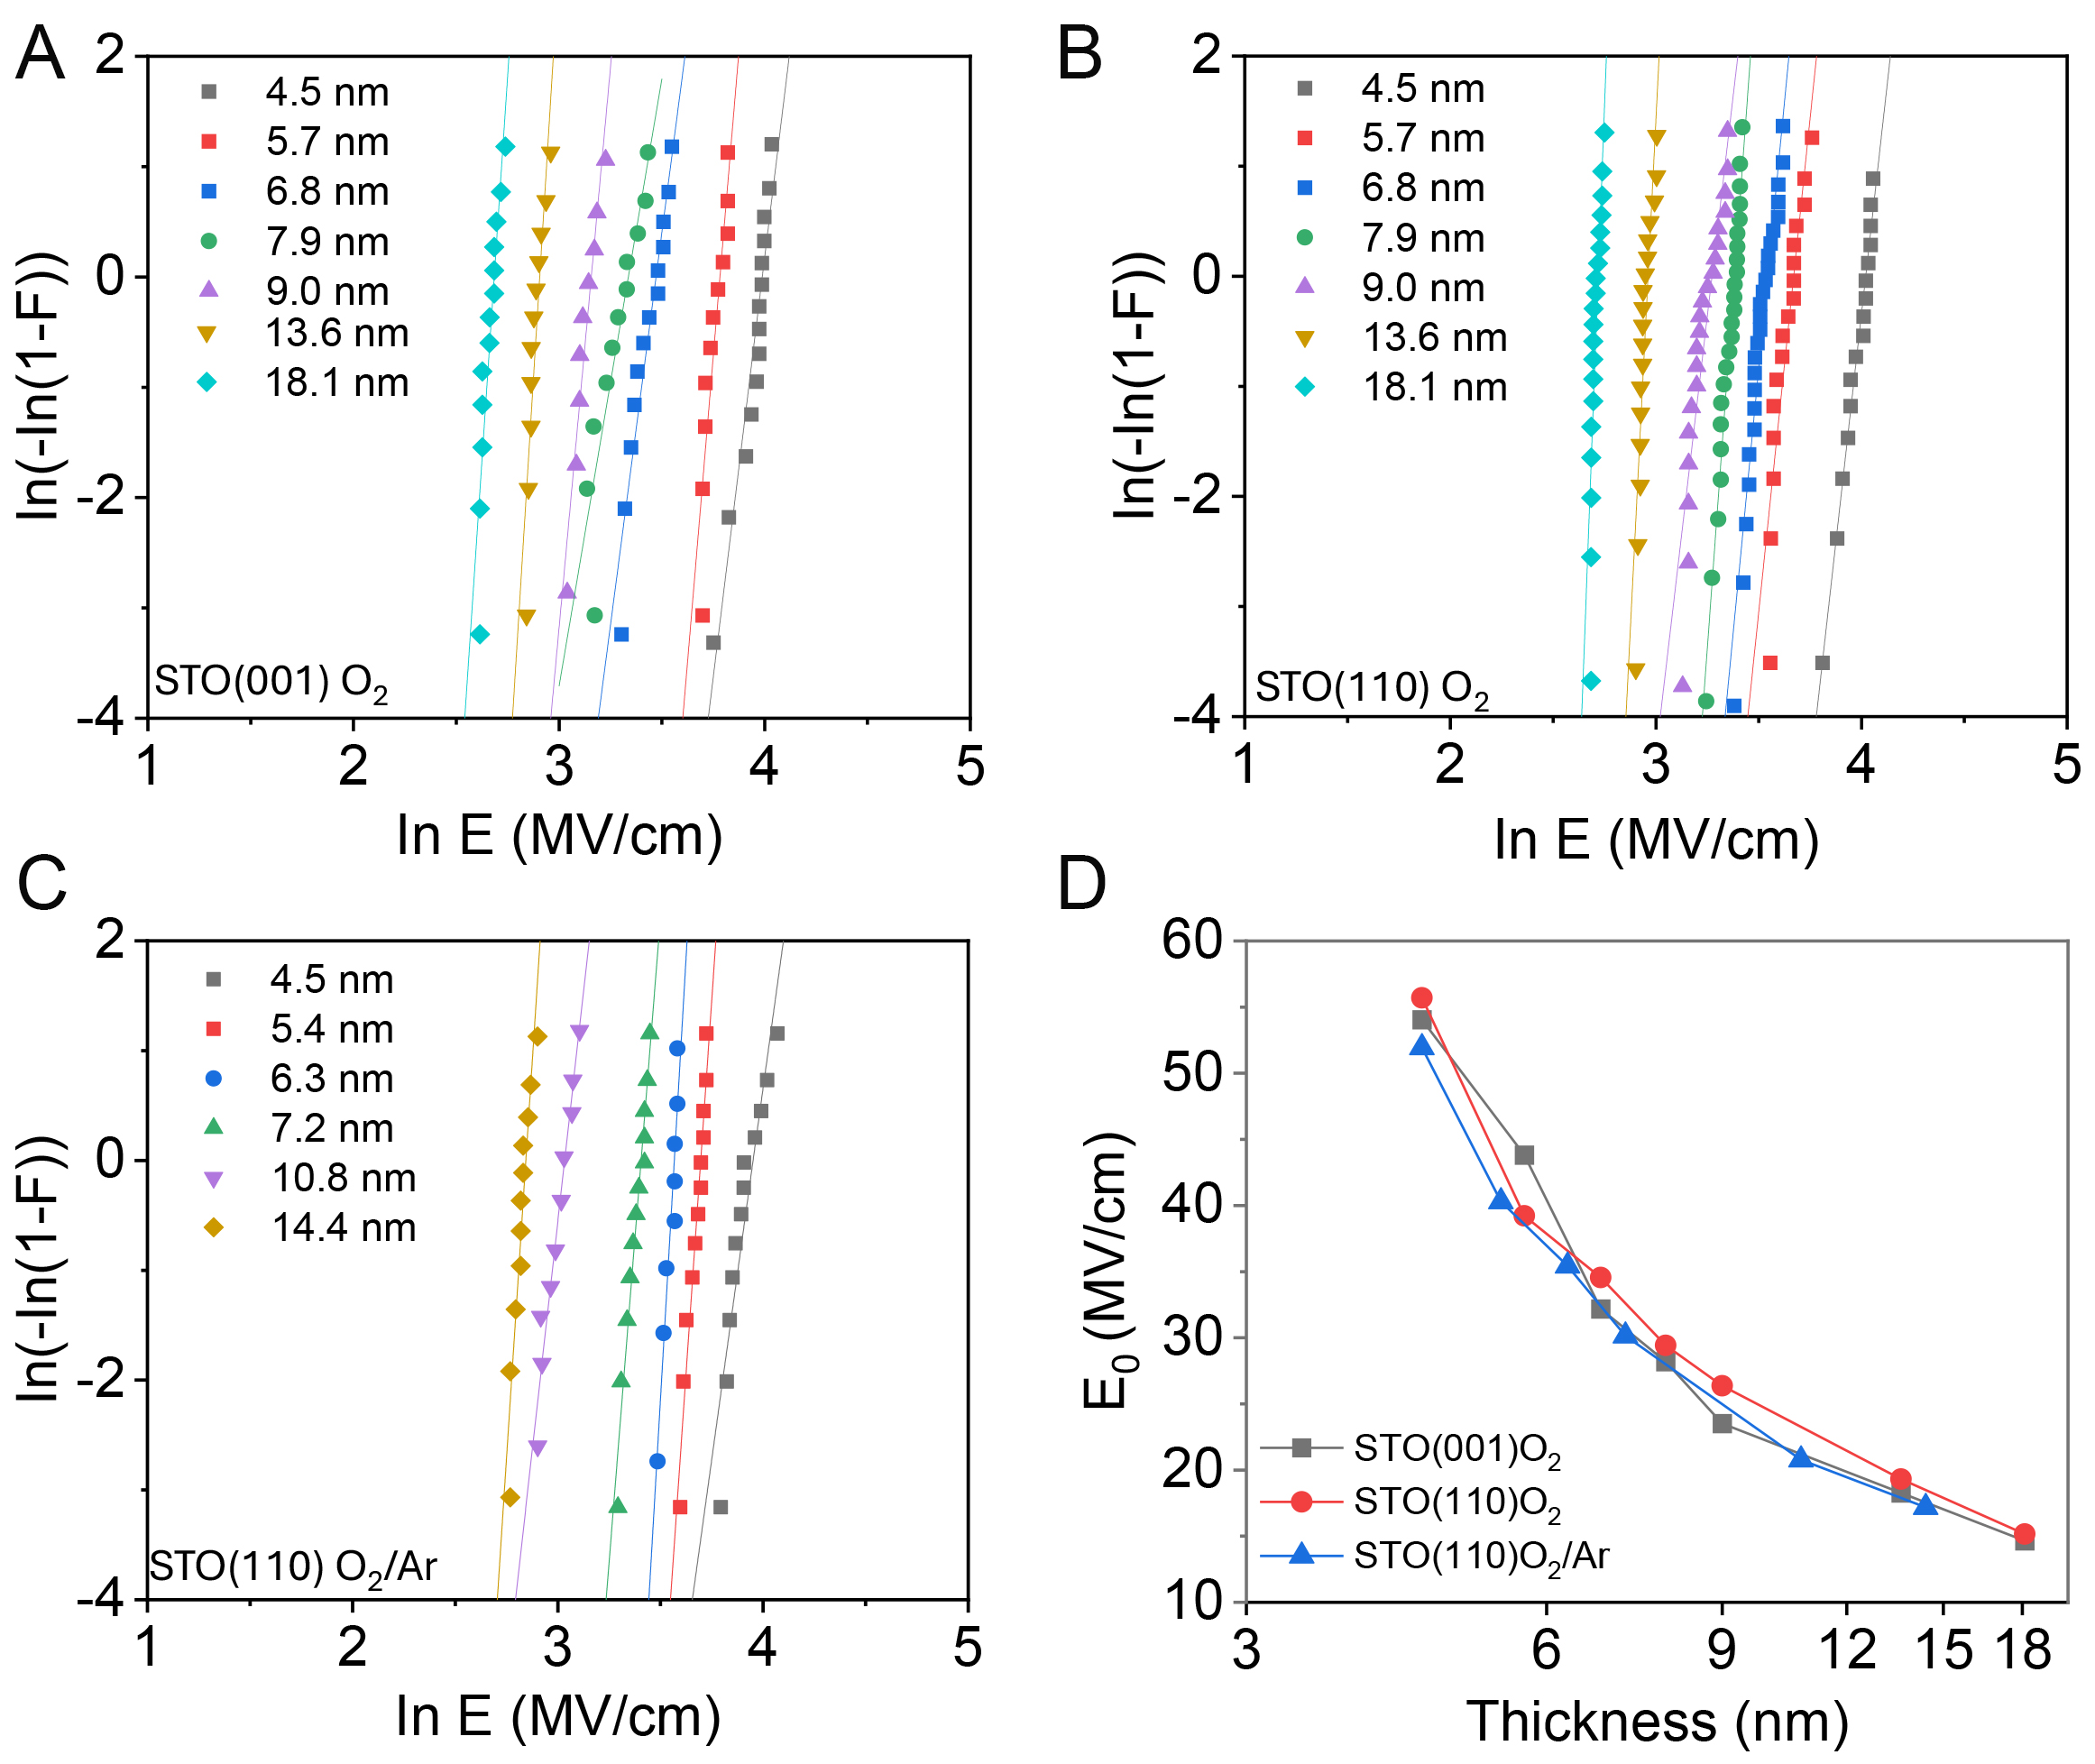
Figure 5. Weibull statistical distributions of the EBD for the three series: (A) STO(001) O2, (B) STO(110) O2, and (C) STO(110) O2/Ar. (D) Thickness dependence of the E0 extracted from the Weibull fitting for the three series of samples.
Figure 6 summarizes the retention performance of the three series, evaluated from the remanent polarization extrapolated to 10 years and normalized to the initial polarization value, as a function of film thickness. The corresponding PUND loops and raw retention measurements used for the extrapolation are provided in Supplementary Figure 11. For films with thickness in the 5-10 nm range, both STO(001) O2 and STO(110) O2 series exhibit relatively stable retention, with more than 50% of the initial polarization preserved. In contrast, STO(110) O2/Ar series shows a more pronounced asymmetry between the positive and negative polarization states. In particular, the retained polarization decreases to approximately 50%-60% for the negative polarization state, while the positive state remains comparable to the other series (≈70%-77%).
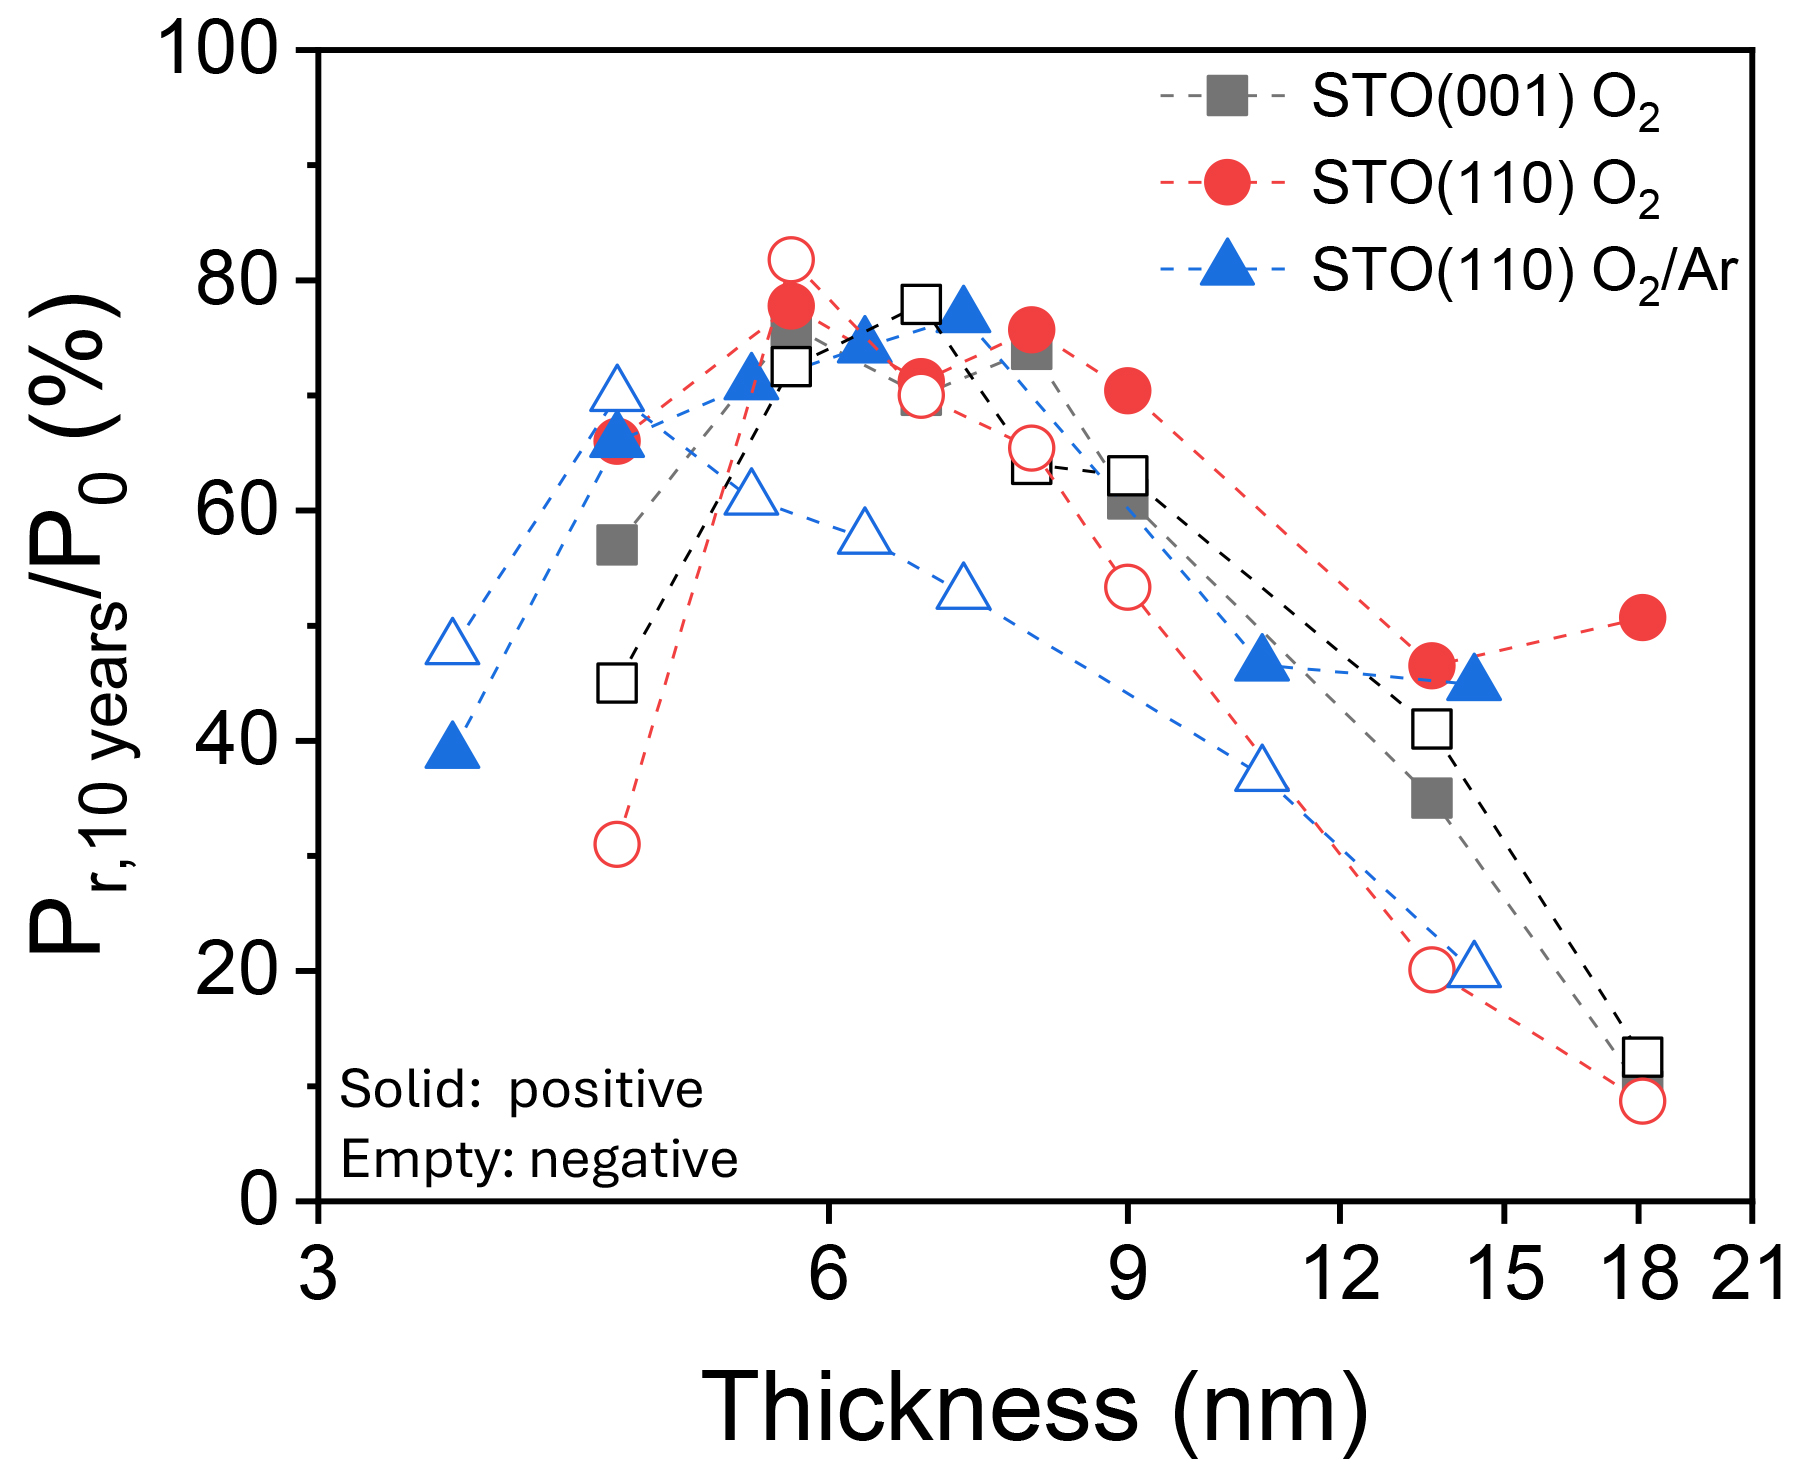
Figure 6. Retention performance of the three series, expressed as the remanent polarization extrapolated to 10 years and normalized to the initial value as a function of film thickness. Filled and open symbols correspond to the positive and negative polarization states, respectively.
Figure 7 summarizes the relationship between the remanent polarization and switching time, dielectric breakdown strength, and retention. The numbers next to the data points indicate the corresponding film thickness in nm, allowing the role of thickness to be directly visualized in the correlations. Figure 7A shows the dependence of the characteristic switching time on the remanent polarization for positive polarity. A general correlation between polarization magnitude and switching time is observed. Films with low polarization tend to exhibit relatively faster switching dynamics. Note that the obtained low switching times are very close to the time constant of the experimental setup, measured in detail in ref.[40], thus influenced by that.
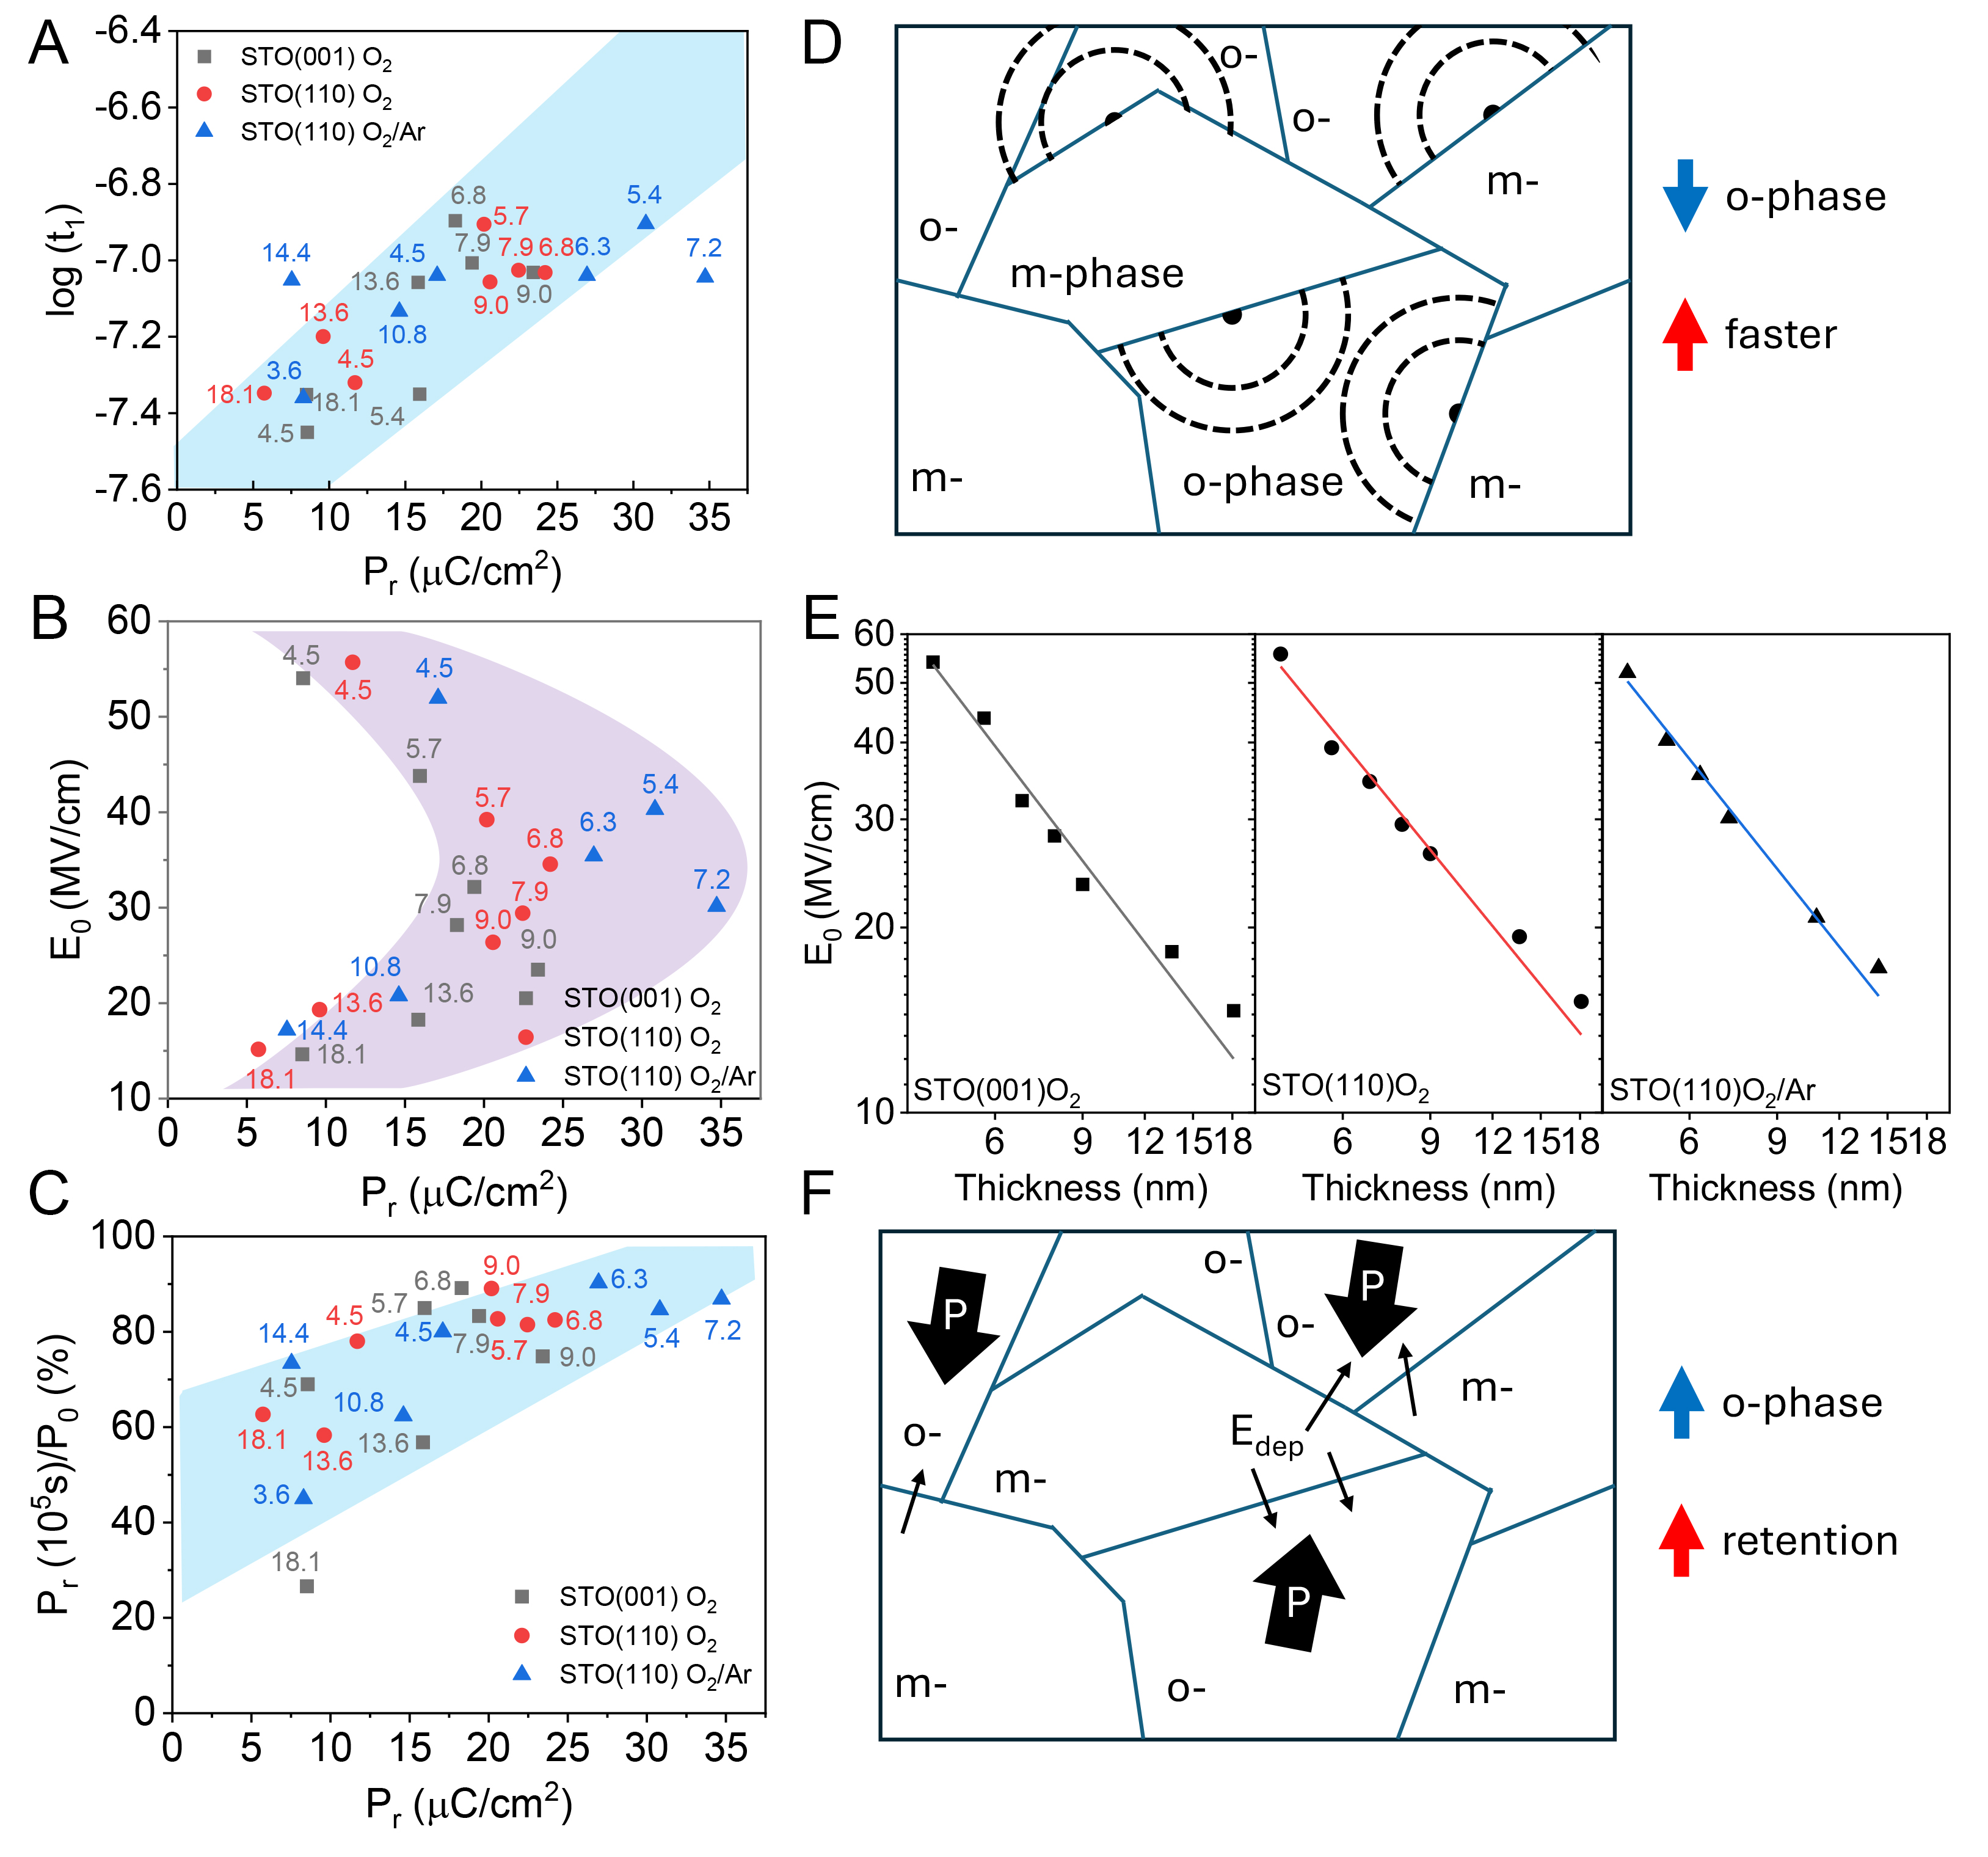
Figure 7. Correlation between switching dynamics and reliability metrics as a function of remanent polarization. (A) Positive switching time as a function of Pr. (B) Characteristic E0 as a function of Pr. (C) Retention expressed as Pr (105 s)/P0 as a function of Pr. (D) Schematic illustration of the larger number of nucleation sites promoting faster switching in films containing monoclinic/orthorhombic grain boundaries. (E) log-log dependence of E0 on thickness; the slope is close to 1 in all cases. (F) Sketch of the enhanced in-plane depolarization field Edep in films with a larger presence of monoclinic/orthorhombic phase fraction. Black arrows labeled P denote the polarization direction.
Figure 7B shows the absence of direct correlation between remanent polarization and the dielectric breakdown field. EBD increases with polarization for low EBD values, while it decreases for high EBD values. This non-monotonic behavior reflects the thickness dependence of polarization, which first increases and then decreases with increasing film thickness. Therefore, it can be concluded that EBD is mainly determined by film thickness. The correlation between polarization and retention stability is shown in Figure 7C. The normalized retention Pr(105 s)/P0 smoothly increases as the polarization increases. Note that here retention is evaluated by Pr at 105 s, rather than the value extrapolated to 10 years, as done in Figure 6. This approach avoids introducing additional uncertainty associated with long-term extrapolation and provides a direct comparison of the experimentally measured retention across samples. This behavior indicates that larger polarization stabilizes the ferroelectric state and suppresses depolarization-driven back-switching, leading to improved retention. The results obtained in samples grown under O2/Ar atmosphere do not show systematically decreased retention. This behavior suggests that higher oxygen vacancy concentrations under reducing conditions tailor the stabilization of the orthorhombic phase, increasing polarization
To summarize, it is observed that as the film thickness increases, the fraction of the monoclinic phase gradually increases, while the remanent polarization initially increases and then decreases as the orthorhombic ferroelectric phase becomes less stable in thicker films. The switching becomes faster in films containing a larger content of the monoclinic phase, indicating that grain boundaries between monoclinic and orthorhombic grains may act as nucleation centers, thus increasing the switching speed [Figure 7D][40]. The dielectric breakdown field decreases monotonically with thickness. Figure 7E shows the dependence of EBD on thickness in a log-log plot, including data fitting following the relation EBD ∝ t-n for the three series[41]. In all cases, the extracted exponent value is close to n ≈ 1. An exponent near 1 suggests dielectric failure governed by interface-limited carrier injection and/or interfacial redox processes, rather than by bulk effects or the density of orthorhombic/monoclinic grain boundaries[41]. The retention stability improves with polarization and reaches optimal values in the intermediate thickness regime. The improved retention is consistent with a reduction in the depolarization electric fields (Edep)[42-44]. Thus, when the fraction of the orthorhombic phase decreases at the expense of the monoclinic one, in-plane depolarization fields (Edep) are promoted [Figure 7F]. These fields ultimately favor back-switching of the out-of-plane polarization, leading to poorer retention, as suggested in previous studies of La-doped HfO2 films[45]. These competing trends highlight the existence of an optimal window where large polarization, stable retention, and acceptable breakdown strength can be simultaneously achieved. In the present films, this optimal region occurs at intermediate thicknesses of approximately 5-10 nm.
CONCLUSIONS
In this work, we investigated the influence of substrate orientation, growth atmosphere, and thickness on the switching behavior and reliability of epitaxial HZO films. Structural analysis shows that the ferroelectric orthorhombic phase is preferentially stabilized for thinner films, while increasing thickness promotes the formation of the monoclinic phase. The largest remanent polarization (above 30 µC/cm2) is obtained for films in the intermediate thickness range (5-10 nm). Switching spectroscopy reveals polarity-dependent switching kinetics in thinner films, attributed to built-in electric fields. Reliability measurements further show that the breakdown field decreases with thickness, while retention remains stable in the intermediate thickness range. Thus, detrimental properties are found in the thinnest films, due to a larger contribution of interface-related defects, and in the thicker films, where the orthorhombic phase ratio decreases. Switching speed is found to be favored by the presence of the monoclinic phase. The presented results provide guidelines for the design of ferroelectric tunnel junctions and other resistive switching devices, where the coexistence of oxygen vacancies and ferroelectricity can lead to enhanced device performance[31]. Overall, these results demonstrate that phase stabilization and interface asymmetry govern the switching dynamics and reliability of epitaxial HZO films, providing guidelines for optimizing ferroelectric hafnia-based devices.
DECLARATIONS
Acknowledgments
We acknowledge the assistance of the ICMAB-CSIC Scientific & Technical Services: Thin Films Laboratory (Raul Solanas) and X-ray Diffraction Laboratory (Anna Crespi, Joan Esquius, and Francisco Javier Campos). Lyu, X. 's work was done as part of his Ph.D. program in Materials Science at Universitat Autònoma de Barcelona.
Authors’ contributions
Contributed to the acquisition of data, interpretation of the results, formal analysis of the data, and participated in the critical revision of the manuscript: Lyu, X.
Contributed to the acquisition of data, interpretation of the results, formal analysis of the data, and drafted the original manuscript: Ali, F.
Contributed to the conceptualization, data analysis, and interpretation; critically revised the manuscript for important intellectual content; and provided administrative, technical, and material support for the project: Sánchez, F.; Fina, I.
Availability of data and materials
The original contributions presented in this study are included in the article and Supplementary Materials. Further inquiries can be directed to the corresponding author.
AI and AI-assisted tools statement
During preparation of the initial manuscript draft in March-April 2026, the authors used GPT-5.4 mini (OpenAI; released 2026-03-17) and Gemini 3.1 Pro (Google; released 2026-02-19) to assist with text drafting and language editing. The authors reviewed and revised the generated text and verified all scientific statements. The tools were not used to design the study, collect or analyze data, or determine the interpretation and conclusions. All authors take full responsibility for the accuracy, integrity, and final content of the manuscript.
Financial support and sponsorship
Financial support from the Spanish Ministry of Science, Innovation and Universities (MCIN/AEI/ 10.13039/501100011033), through the Severo Ochoa MATRANS42 (CEX2023-001263-S) and CEX2023-001286-S, and PID2023-147211OB-C21 projects, is acknowledged. This project has received funding from the European Union’s Horizon 2020 research and innovation programme under the Marie Skłodowska-Curie grant agreement No. 101152199. Lyu, X. was supported by the China Scholarship Council (CSC) under grant No. 202206180011.
Conflicts of interest
All authors declared that there are no conflicts of interest.
Ethical approval and consent to participate
Not applicable.
Consent for publication
Not applicable.
Copyright
© The Author(s) 2026.
Supplementary Materials
REFERENCES
1. Böscke, T. S.; Müller, J.; Bräuhaus, D.; Schröder, U.; Böttger, U. Ferroelectricity in hafnium oxide thin films. Appl. Phys. Lett. 2011, 99, 102903.
2. Shao, M.; Zhao, R.; Liu, H.; et al. Challenges and recent advances in HfO2-based ferroelectric films for non-volatile memory applications. Chip 2024, 3, 100101.
3. Yang, W.; Yu, C.; Li, H.; et al. Ferroelectricity of hafnium oxide-based materials: Current status and future prospects from physical mechanisms to device applications. J. Semicond. 2023, 44, 053101.
4. Schroeder, U.; Park, M. H.; Mikolajick, T.; Hwang, C. S. The fundamentals and applications of ferroelectric HfO2. Nat. Rev. Mater. 2022, 7, 653-69.
5. Materano, M.; Lomenzo, P. D.; Kersch, A.; Park, M. H.; Mikolajick, T.; Schroeder, U. Interplay between oxygen defects and dopants: effect on structure and performance of HfO2-based ferroelectrics. Inorg. Chem. Front. 2021, 8, 2650-72.
6. Park, M. H.; Lee, D. H.; Yang, K.; et al. Review of defect chemistry in fluorite-structure ferroelectrics for future electronic devices. J. Mater. Chem. C. 2020, 8, 10526-50.
7. Lee, J.; Yang, K.; Kwon, J. Y.; et al. Role of oxygen vacancies in ferroelectric or resistive switching hafnium oxide. Nano. Converg. 2023, 10, 55.
8. Lee, Y.; Jeong, H. W.; Kim, S. H.; Yang, K.; Park, M. H. Effect of stress on fluorite-structured ferroelectric thin films for semiconductor devices. Mater. Sci. Semicond. Process. 2023, 160, 107411.
9. Materano, M.; Mittmann, T.; Lomenzo, P. D.; et al. Influence of oxygen content on the structure and reliability of ferroelectric HfxZr1-xO2 layers. ACS. Appl. Electron. Mater. 2020, 2, 3618-26.
10. Kumar, G.; Paul, A.; Das, A.; Larrieu, G.; De, S. Insights into oxygen vacancy effects on ferroelectric behavior of hafnium oxide: a review. Physica. Status. Solidi. 2025, 222, 2500376.
11. Schroeder, U.; Yurchuk, E.; Müller, J.; et al. Impact of different dopants on the switching properties of ferroelectric hafniumoxide. Jpn. J. Appl. Phys. 2014, 53, 08LE02.
12. Schroeder, U.; Materano, M.; Mittmann, T.; Lomenzo, P. D.; Mikolajick, T.; Toriumi, A. Recent progress for obtaining the ferroelectric phase in hafnium oxide based films: impact of oxygen and zirconium. Jpn. J. Appl. Phys. 2019, 58, SL0801.
13. Wei, Y.; Nukala, P.; Salverda, M.; et al. A rhombohedral ferroelectric phase in epitaxially strained Hf0.5Zr0.5O2 thin films. Nat. Mater. 2018, 17, 1095-100.
14. Lyu, J.; Fina, I.; Solanas, R.; Fontcuberta, J.; Sánchez, F. Robust ferroelectricity in epitaxial Hf1/2Zr1/2O2 thin films. Appl. Phys. Lett. 2018, 113, 082902.
15. Estandía, S.; Dix, N.; Chisholm, M. F.; Fina, I.; Sánchez, F. Domain-matching epitaxy of ferroelectric Hf0.5Zr0.5O2(111) on La2/3Sr1/3MnO3(001). Cryst. Growth. Des. 2020, 20, 3801-6.
16. Schimpf, J.; Zhang, W.; Manna, M.; et al. Interface effects in the phase determination of Hf0.5Zr0.5O2 epitaxial thin films. APL. Mater. 2025, 13, 011104.
17. Huang, C.; Zhang, Y.; Zheng, S.; Yang, Q.; Liao, M. Interface effects induced by aZrO2 seed layer on the phase stability and orientation of HfO2 ferroelectric thin films: a first-principles study. Phys. Rev. Appl. 2021, 16, 044048.
18. Shi, S.; Xi, H.; Cao, T.; et al. Interface-engineered ferroelectricity of epitaxial Hf0.5Zr0.5O2 thin films. Nat. Commun. 2023, 14, 1780.
19. Jiao, P.; Li, J.; Xi, Z.; et al. Ferroelectric Hf0.5Zr0.5O2 thin films deposited epitaxially on (110)-oriented SrTiO3. Appl. Phys. Lett. 2021, 119, 252901.
20. Lyu, X.; Ali, F.; Song, T.; Fina, I.; Sánchez, F. Cooperative effects of interface symmetry, redox conditions and low-thickness to improve polarization in ferroelectric Hf0.5Zr0.5O2 films. ACS. Appl. Mater. Interfaces. 2025, 17, 32596-603.
21. Song, T.; Tan, H.; Estandía, S.; et al. Improved polarization and endurance in ferroelectric Hf0.5Zr0.5O2 films on SrTiO3(110). Nanoscale 2022, 14, 2337-43.
22. Yun, Y.; Buragohain, P.; Li, M.; et al. Intrinsic ferroelectricity in Y-doped HfO2 thin films. Nat. Mater. 2022, 21, 903-9.
23. Song, T.; Solanas, R.; Qian, M.; Fina, I.; Sánchez, F. Large enhancement of ferroelectric polarization in Hf0.5Zr0.5O2 films by low plasma energy pulsed laser deposition. J. Mater. Chem. C. 2022, 10, 1084-9.
24. Mittmann, T.; Materano, M.; Lomenzo, P. D.; et al. Origin of ferroelectric phase in undoped HfO2 films deposited by sputtering. Adv. Mater. Inter. 2019, 6, 1900042.
25. Mittmann, T.; Michailow, M.; Lomenzo, P. D.; et al. Stabilizing the ferroelectric phase in HfO2-based films sputtered from ceramic targets under ambient oxygen. Nanoscale 2021, 13, 912-21.
26. Lyu, X.; Song, T.; Quintana, A.; Fina, I.; Sánchez, F. Highly stable epitaxially crystallized ferroelectric Hf0.5Zr0.5O2 films. ACS. Appl. Electron. Mater. 2023, 5, 6142-8.
27. Buragohain, P.; Erickson, A.; Mimura, T.; Shimizu, T.; Funakubo, H.; Gruverman, A. Effect of film microstructure on domain nucleation and intrinsic switching in ferroelectric Y:HfO2 thin film capacitors. Adv. Funct. Mater. 2021, 32, 2108876.
28. Li, Y.; Xu, Z.; Li, X.; et al. Unveiling the role of domain wall propagation in enhancing switching properties of ferroelectric Ga-doped HfO2 thin films. Mater. Today. Chem. 2025, 49, 103091.
29. Ali, F.; Song, T.; Sánchez, F.; Fina, I. Fast switching and high polarization in ferroelectric Hf0.5Zr0.5O2 films. Small. Sci. 2026, 6, e202500465.
30. Lee, D. H.; Lee, Y.; Yang, K.; et al. Domains and domain dynamics in fluorite-structured ferroelectrics. Appl. Phys. Rev. 2021, 8, 021312.
31. Kim, J.; Shin, W.; Koo, R.; et al. Hybrid ferroelectric-ionic memristive hardware for high scalability in-memory computing. Nat. Commun. 2026, 17, 6687.
32. Fina, I.; Fàbrega, L.; Langenberg, E.; et al. Nonferroelectric contributions to the hysteresis cycles in manganite thin films: A comparative study of measurement techniques. J. Appl. Phys. 2011, 109, 074105.
33. Song, T.; Koutsogiannis, P.; Magén, C.; Pardo, J. A.; Sánchez, F.; Fina, I. Improved polarization-retention-endurance in Hf0.5Zr0.5O2 films by ZrO2 capping via electrostatic effects. Adv. Elect. Mater. 2023, 10, 2300509.
34. Zhang, Q.; Li, X.; Zhu, J. Direct observation of interface-dependent multidomain state in the BaTiO3 tunnel barrier of a multiferroic tunnel junction memristor. ACS. Appl. Mater. Interfaces. 2021, 13, 43641-7.
35. Estandía, S.; Cao, T.; Mishra, R.; Fina, I.; Sánchez, F.; Gazquez, J. Insights into the atomic structure of the interface of ferroelectric Hf0.5Zr0.5O2 grown epitaxially on La2/3Sr1/3MnO3. Phys. Rev. Mater. 2021, 5, 074410.
36. Chatterjee, S.; Kumar, S.; Gaidhane, A.; Dabhi, C. K.; Chauhan, Y. S.; Amrouch, H. Ferroelectric FDSOI FET modeling for memory and logic applications. Solid. State. Electron. 2023, 200, 108554.
37. Tagantsev, A. K.; Stolichnov, I.; Setter, N.; Cross, J. S.; Tsukada, M. Non-Kolmogorov-Avrami switching kinetics in ferroelectric thin films. Phys. Rev. B. 2002, 66, 214109.
38. Weibull, W. A statistical distribution function of wide applicability. J. Appl. Mech. 1951, 18, 293-7.
39. Huang, T.; Li, Y.; Chen, C.; et al. Demonstration of robust breakdown reliability and enhanced endurance in gallium doped HfO2 ferroelectric thin films. IEEE. Electron. Device. Lett. 2023, 44, 1476-9.
40. Song, T.; Sánchez, F.; Fina, I. Impact of non-ferroelectric phases on switching dynamics in epitaxial ferroelectric Hf0.5Zr0.5O2 films. APL. Mater. 2022, 10, 031108.
42. Wurfel, P.; Batra, I. P. Depolarization-field-induced instability in thin ferroelectric films-experiment and theory. Phys. Rev. B. 1973, 8, 5126-33.
43. Mehta, R. R.; Silverman, B. D.; Jacobs, J. T. Depolarization fields in thin ferroelectric films. J. Appl. Phys. 1973, 44, 3379-85.
44. Kim, D. J.; Jo, J. Y.; Kim, Y. S.; et al. Polarization relaxation induced by a depolarization field in ultrathin ferroelectric BaTiO3 capacitors. Phys. Rev. Lett. 2005, 95, 237602.
Cite This Article
 Open Access
How to Cite
Lyu, X.; Ali, F.; Sánchez, F.; Fina, I. Growth redox conditions and interface effects govern polarization switching speed, retention and reliability in epitaxial Hf0.5Zr0.5O2 thin films. Microstructures 2026, 6, 20260126. https://dx.doi.org/10.20517/microstructures.2026.97
Download Citation
If you have the appropriate software installed, you can download article citation data to the citation manager of your choice. Simply select your manager software from the list below and click on download.
Export Citation File
Type of Import
Tips on Downloading Citation
Citation Manager File Format
Type of Import
Direct Import: When the Direct Import option is selected (the default state), a dialogue box will give you the option to Save or Open the downloaded citation data. Choosing Open will either launch your citation manager or give you a choice of applications with which to use the metadata. The Save option saves the file locally for later use.
Indirect Import: When the Indirect Import option is selected, the metadata is displayed and may be copied and pasted as needed.
About This Article
Special Topic
Copyright

Data & Comments
Data
0











Comments
Comments must be written in English. Spam, offensive content, impersonation, and private information will not be permitted. If any comment is reported and identified as inappropriate content by OAE staff, the comment will be removed without notice. If you have any queries or need any help, please contact us at [email protected].