

fig3
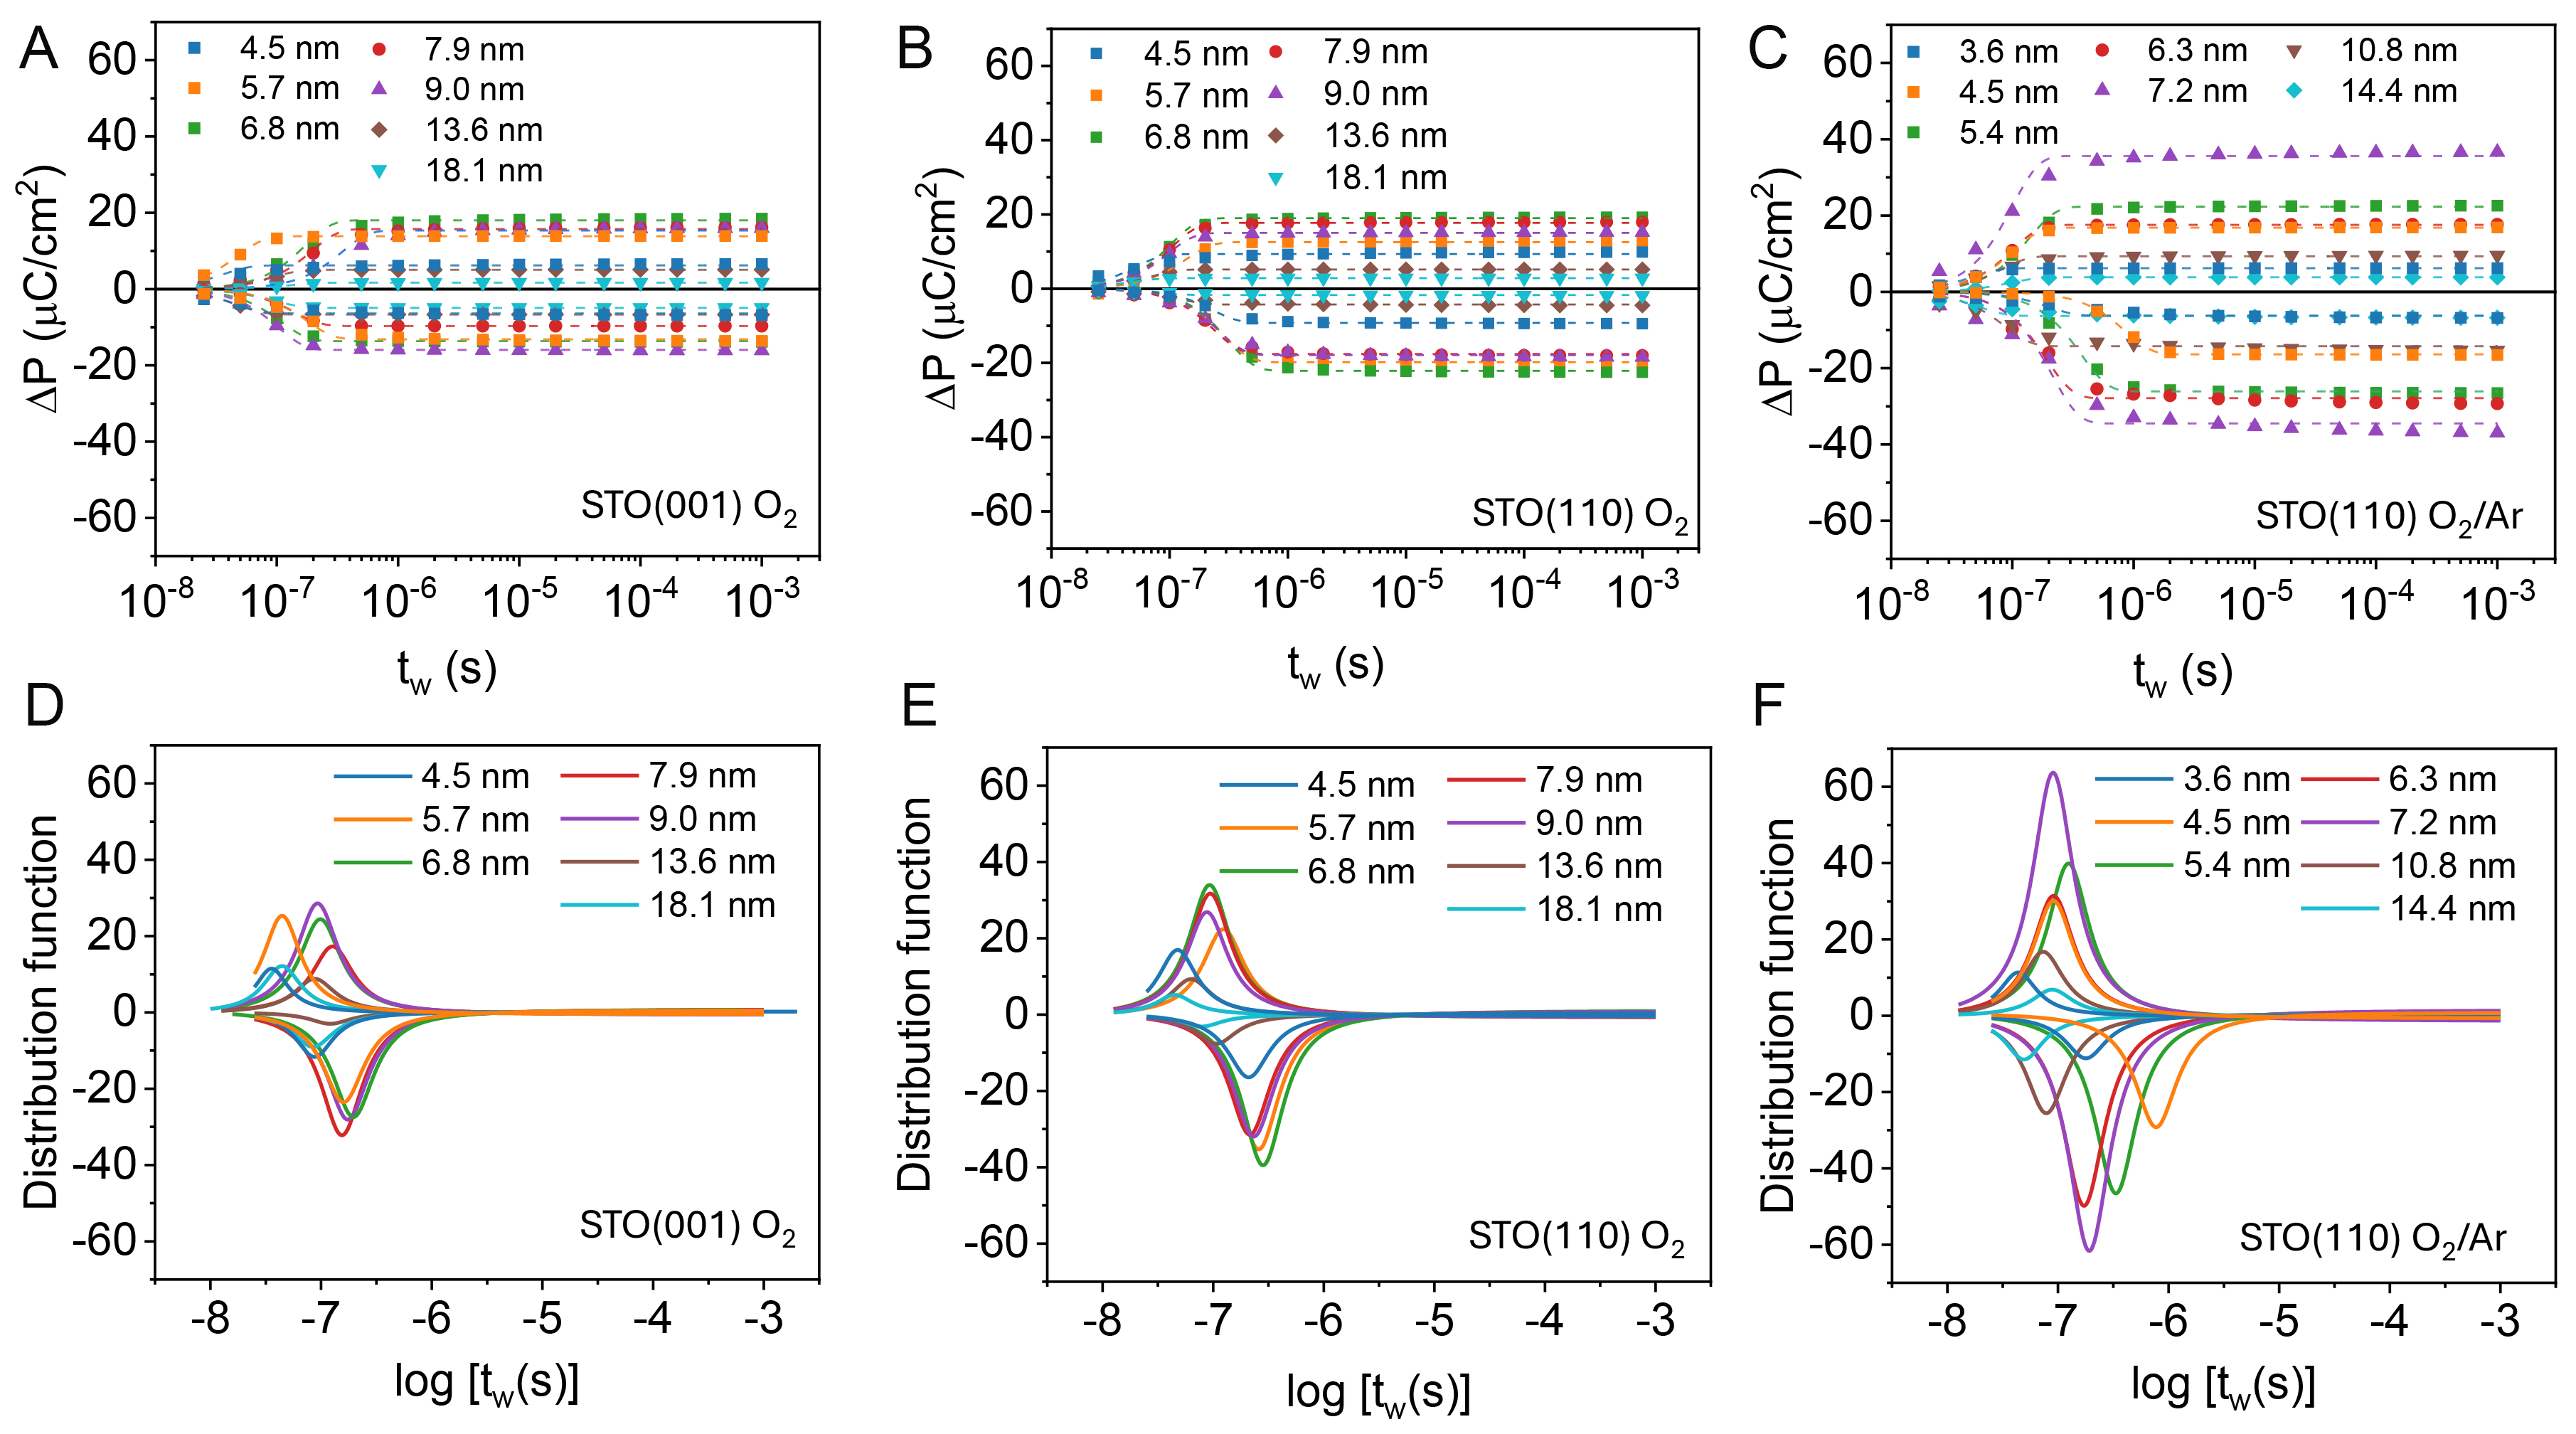
Figure 3. (A-C) ∆P as a function of writing pulse width (tw) measured by PUND for the three sample series: (A) STO(001) O2, (B) STO(110) O2, and (C) STO(110) O2/Ar. Dashed lines correspond to fits using the nucleation-limited switching (NLS) model. (D-F) Corresponding Lorentzian distributions of local switching times extracted from the NLS fitting for the three series of samples.





