


Pitting corrosion growth of an Inconel alloy revealed by three-dimensional reconstruction
 0
0 
Abstract
Establishing a high-quality service database is crucial for the service evaluation and life prediction of materials and equipment, particularly in the nuclear power industry, where data that accurately capture the internal evolution of service-related defects can improve the reliability of predictive models. This study investigates the pitting corrosion growth of Inconel 690 alloy by systematically tracking different growth stages of pits using optical microscopy, scanning electron microscopy, and three-dimensional (3D) reconstruction techniques, thereby obtaining comprehensive pitting evolution data. Three-dimensional models were constructed under corrosion conditions of 70 and 90 °C, and the temporal evolution of key geometric parameters was analyzed using a power-law relationship to characterize the growth behavior and time dependence of pitting corrosion. In addition, the shielding effect of the lacy cover on pit interiors was analyzed, highlighting the necessity of acquiring comprehensive pitting evolution data. This work provides a representative example for the collection and analysis of full-information data to support service performance evaluation and digital twin applications in nuclear power materials.
Keywords
INTRODUCTION
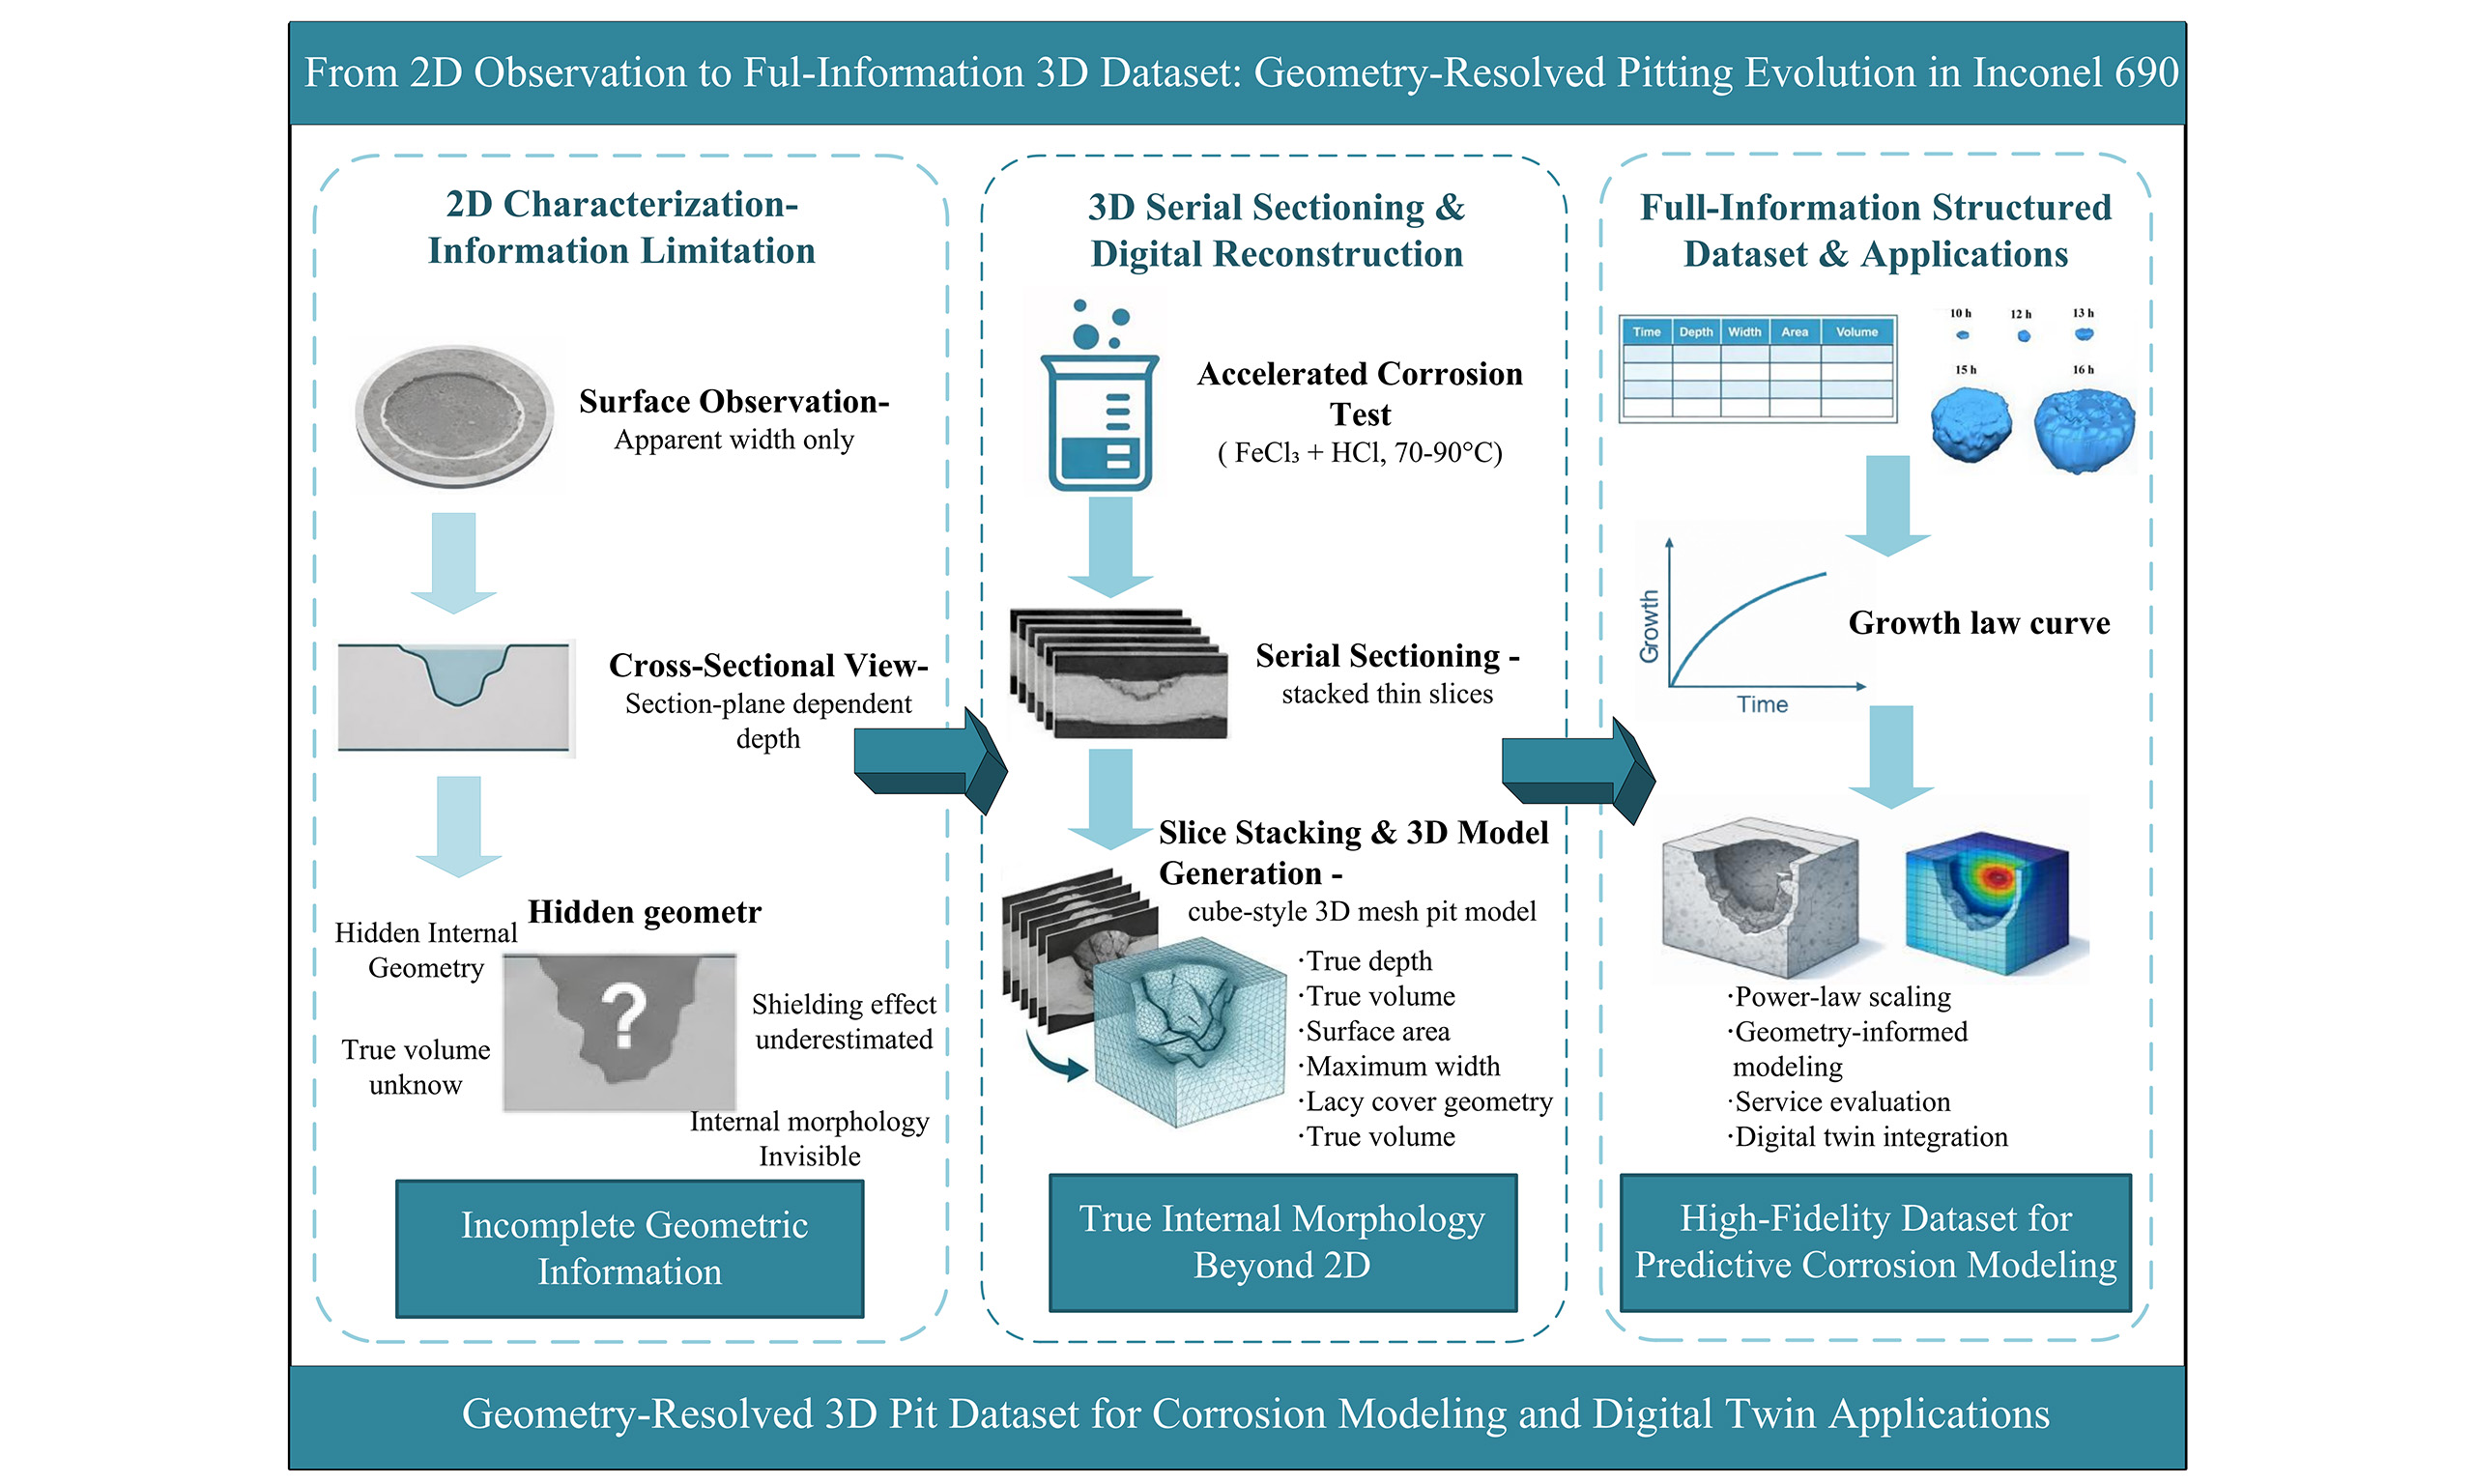
Currently, the majority of operating nuclear power plants worldwide have exceeded half of their originally planned service life, and the average age of reactors has surpassed 30 years. This aging trend poses serious challenges to operational safety and reliability[1]. During long-term operation, critical components such as steam generators are susceptible to material degradation, and corrosion failures constitute a primary safety hazard. With the rapid development of emerging digital technologies such as digital twins and artificial intelligence, data-driven approaches aim to facilitate efficient state assessment and accurate life prediction by constructing models of defect evolution during service[2-5]. The success of this paradigm relies on high-quality service databases-comprehensive datasets that accurately capture the true 3D morphology and evolution of defects. The temporal evolution of key geometric parameters was analyzed using a power-law relationship to characterize the growth behavior and time dependence of pitting corrosion. In addition, the shielding effect of the lacy cover on pit interiors was analyzed, highlighting the necessity of acquiring comprehensive pitting evolution data. This work provides a representative example for the collection and analysis of full-information data to support service performance evaluation and digital twin applications in nuclear power materials. However, localized corrosion features such as pitting corrosion and stress corrosion cracking exhibit intrinsically complex three-dimensional spatial structures, whose true morphology and evolution cannot be adequately resolved by conventional two-dimensional characterization methods. Recent studies have demonstrated that quantitative three-dimensional characterization is essential for accurately resolving the internal geometry and evolution of localized corrosion damage[6]. Traditional characterization approaches based on surface observation or cross-sectional analysis are therefore insufficient to fully represent the internal geometry of corrosion pits, and the service data derived from such two-dimensional methods inherently suffer from information incompleteness, particularly with respect to depth, volume, and subsurface morphology[7]. For example, two-dimensional surface observations are prone to underestimating the true pit volume and geometric extent due to the shielding effect of corrosion products or lacy covers formed above the pit mouth, while cross-sectional analysis is highly sensitive to the selected section plane and may introduce substantial statistical bias when representing inherently three-dimensional pit morphologies[8]. Such information loss introduced during the digitization of corrosion-related data can accumulate systematically across multiple observations, leading to inherent and irreducible information gaps in service databases. As a consequence, data-driven service evaluation and life prediction models constructed on incomplete geometric descriptors may suffer from reduced accuracy and reliability, particularly when defect evolution is strongly governed by three-dimensional morphology and transport confinement effects.
To accurately capture the 3D morphology and evolution of defects, advanced characterization techniques are required. 3D reconstruction offers a promising approach to digitally reconstruct objects with intricate internal structures, enabling direct observation and analysis that are otherwise difficult or impossible through traditional methods[9]. By integrating imaging and characterization techniques—such as metallography, electron microscopy, and computed tomography—3D reconstruction provides detailed insights into material microstructures, facilitating more accurate modeling of corrosion processes, damage evolution, and service life predictions. This technique has been widely adopted in materials science. For example, several studies have applied 3D reconstruction techniques to characterize microstructural features in metallic materials, Karimi et al.[10] visualized the top 50 largest defects in 718 alloy using X-ray computed tomography (XCT) and identified mechanisms such as solidification cracks and shrinkage defects. Schaffer et al.[11] employed focused ion beam scanning electron microscopy (FIB-SEM) and energy-dispersive X-ray spectroscopy (EDS) to obtain quantitative 3D chemical distributions in (Ca)MgTiOx samples. Singh et al.[12] characterized grain boundaries, pores, and inclusions in 7075 aluminum alloy via FIB-SEM tomography to explore their influence on mechanical and corrosion behaviors. Du Plessis et al.[13] used micro-CT for non-destructive analysis of pores in cast titanium alloys to study the impact of porosity on mechanical properties and performed finite element analysis on the micro-CT data, completing the 3D view of pores, stress distribution, and potential failure site modeling. Li et al.[14] reconstructed the number, 3D morphology, and development of pitting corrosion at different stages under elastic tensile stress in 304L stainless steel using XCT.
Continuous sectioning represents a key method for 3D reconstruction, offering high-resolution imaging at low cost, with the advantage of capturing true internal features and geometric profiles. Although initially prevalent in biological sciences, this technique has been successfully adapted for materials science. Researchers have reconstructed 3D microstructures of various alloys, such as Ti alloys, Mg alloys, revealing grain structures, porosity and phase morphologies in unprecedented detail[15-18]. These studies highlight continuous sectioning as an effective tool to build 3D microstructural datasets for microstructural characterization, quantitative analysis and physical simulation, which is essential for resolving the growth kinetics of individual corrosion pits beyond averaged corrosion metrics[19].
Pitting corrosion, a localized form of deterioration, remains one of the most destructive failure mechanisms in metals and alloys, as it is governed by highly localized microstructural and electrochemical heterogeneities that can strongly amplify damage evolution and compromise alloy integrity[20]. Inconel 690, a high-chromium-nickel alloy, is renowned for its excellent corrosion resistance, metallurgical stability, and ease of manufacturing, making it widely used in nuclear power environments[21]. Its superior resistance to primary water stress corrosion cracking has established Alloy 690 as the material of choice for steam generator components in pressurized water reactors worldwide since 1989[22]. In addition, its robust performance in challenging environments—including acidic, alkaline, sulfur-containing, and lead-contaminated conditions—has been widely reported in the literature[23]. Nevertheless, even Inconel 690 can develop pitting corrosion in high-pressure water environments, threatening nuclear safety[24]. Factors such as residual dissolved oxygen, chlorides, and transient operational conditions—such as air leaks, seawater backflows, or heat exchanger failures—can induce localized corrosion, including pitting-like attack[25]. As a self-catalytic process, pit growth continues until metal perforation, with progressive material dissolution leading to potential failure[26].
Researchers, while focusing on the pitting growth mechanisms, also pay close attention to the development process of pitting, tracking and recording each growth stage in different dimensions (1D, 2D, 3D)[27-29].The growth of pitting can be summarized into three stages: passive film breakdown (pit initiation), metastable pitting, and steady-state growth[30,31]. Researchers focus on different aspects at each stage. For example, in the initiation stage, researchers are particularly interested in the passive film breakdown process, corrosion current, and concentration of dissolution products[32,33]. In the metastable stage, the focus is on the conditions for transitioning to steady-state pitting[34,35]. In the steady-state growth stage, attention is given to the generation mechanism and growth morphology of the pit's lacy cover[36,37].
In this work, the pitting corrosion behavior of Inconel 690 alloy was systematically investigated using combined two-dimensional characterization and three-dimensional reconstruction techniques. Surface observations were conducted using optical microscopy (OM) and SEM to track pit initiation and early growth behavior, while serial sectioning and 3D reconstruction were employed to reveal the internal morphology and geometric evolution of corrosion pits. The temporal evolution of key geometric parameters, including pit depth, width, surface area, and volume, was quantitatively analyzed and described using power-law relationships. The results provide new insights into the three-dimensional growth behavior of corrosion pits and demonstrate the importance of full-information datasets for understanding localized corrosion processes and supporting future predictive modeling.
MATERIALS AND METHODS
Figure 1 presents the overall experimental workflow, including specimen preparation, pitting corrosion testing, two-dimensional characterization, serial sectioning, and three-dimensional reconstruction.
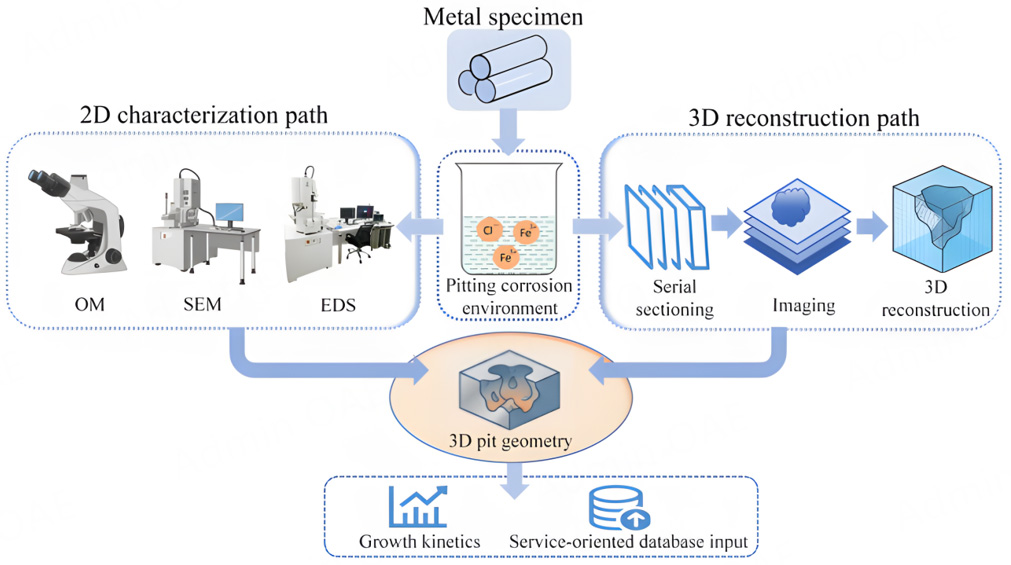
Figure 1. Schematic illustration of the experimental workflow for pitting corrosion characterization and three-dimensional reconstruction. Metal specimens were exposed to a controlled pitting corrosion environment, followed by two parallel characterization paths: conventional two-dimensional surface and cross-sectional analysis using OM, SEM, and EDS, and serial-sectioning-based imaging for three-dimensional reconstruction. The reconstructed three-dimensional pit geometry enables quantitative characterization of pit morphology and growth behavior.
Sample preparation
Commercial Inconel 690 alloy was used as the research material. The alloy was supplied by Taizhou Boyan Metal Products Co., Ltd. (China), with heat number 195-180. The detailed chemical composition is listed in Table 1. Samples were prepared by sectioning the Inconel 690 alloy into square specimens with a size of
Chemical composition of inconel 690 alloy
| Element | Ni | Cr | Fe | Mn | Cu | Si | S | C | Others |
| Content (wt.%) | 59.2 | 29.5 | 10.2 | 0.03 | 0.005 | 0.003 | 0.002 | 0.001 | 1.059 |
Pitting corrosion experiment
The specimens were immersed in an aqueous solution of 6% FeCl3 + 0.16% HCl and placed in a thermostatic water bath at temperatures of 70 and 90 °C. The immersion duration ranged from 4-18 h depending on the experimental condition. Ferric chloride (FeCl3), hydrochloric acid (HCl), and anhydrous ethanol used in this study were purchased from Sinopharm Chemical Reagent Co., Ltd. (China). The FeCl3 + HCl solution was selected as a well-established accelerated pitting corrosion medium for nickel-based alloys, where FeCl3 provides a strongly oxidizing environment that promotes localized anodic dissolution, while the addition of HCl maintains acidic conditions within pits and suppresses repassivation. This aggressive medium enables the rapid formation of stable pits with well-developed internal morphologies, which is essential for three-dimensional reconstruction and quantitative geometric characterization within experimentally accessible timescales; it is not intended to reproduce actual service environments, but to generate representative pit geometries under controlled conditions. Specimens were extracted at predetermined intervals for observation of pitting corrosion progression. Surface morphology was examined using OM (Axio Lab 5, Carl Zeiss AG, Germany). SEM observations and elemental analysis were performed using a field-emission SEM (SU8100, Hitachi High-Tech Corporation, Japan) equipped with an EDS detector.
For select specimens, during the corrosion process, the specimens were carefully removed from the corrosion solution. The corrosion solution within the pits was rapidly frozen using liquid nitrogen to preserve the localized corrosion features. After drying the corrosion solution in the pits, the specimens were polished until the cross-section of the pits was exposed. EDS analysis was then performed to characterize the composition of corrosion products within the pits.
Following removal from the solution, the other specimens were cleaned with anhydrous ethanol and dried thoroughly. They were then encapsulated in a transparent PVC tube with a size of Φ25 mm × 30 mm using UV-curable adhesive. After curing under a UV lamp for 15 min, the specimens were prepared for 3D reconstruction. The pitting morphology was reconstructed by automated serial sectioning using a three-dimensional serial sectioning and imaging system (S3D-MWF-CS, Nakayamadenki Co., Ltd., Japan).This equipment integrates a continuous grinding and polishing subsystem with an automated optical imaging module. Operating parameters were according to the specimen, which was then progressively thinned via grinding and polishing. After each layer was polished, the surface was subjected to a cleaning-etching-cleaning-drying cycle before imaging. The equipment automatically acquires layer-by-layer images along the specimens’ thickness, enabling high-resolution 3D reconstruction. To ensure comprehensive capture of the pit morphology, multiple overlapping images (with 20%-30% overlap) were taken for larger pits, facilitating accurate stitching of the dataset during post-processing. This methodology preserves the integrity of the internal microstructure and provides detailed 3D morphological data critical for subsequent analysis.
3D reconstruction procedure
Prior to 3D reconstruction, an in-house Python script was employed for preprocessing the 2D sliced images. This process included image stitching to assemble multiple partial images into a panoramic slice, and denoising to remove surface noise such as scratches, stains and artifacts.
The 3D reconstruction was carried out using Dragonfly software. The processed slices were stacked along the thickness direction—coordinates for each slice were recorded by a laser rangefinder during the grinding process—to generate an initial 3D structure of the pits. To minimize potential damage to pit morphology during the continuous grinding and polishing process, low applied loads and fine polishing steps were used to ensure that the thickness of each removed layer was small relative to pit dimensions. Polishing parameters were carefully controlled, and each exposed surface was cleaned prior to imaging to remove loose debris. In addition, the continuity of pit morphology across successive slices was examined, and the absence of abrupt geometric discontinuities served as an internal validation that no obvious mechanical damage or distortion was introduced during the serial sectioning process.The number of slices used varied from as few as 8 for the smallest pit to up to above 300 for the largest one.
Subsequently, the initial 3D models were refined using Laplacian Smoothing to improve surface quality and reduce noise, resulting in final, high-fidelity 3D representations of the pits. The entire reconstruction workflow is illustrated in Figure 2.
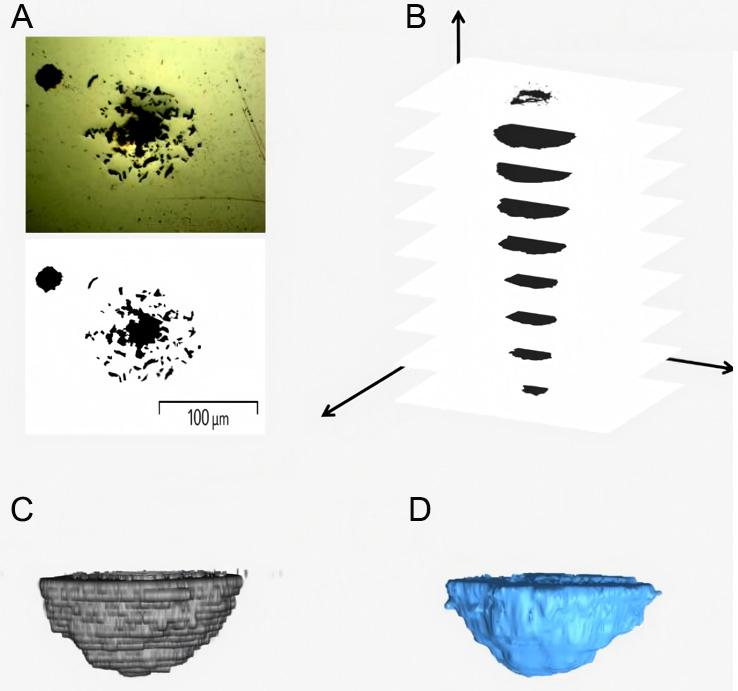
Figure 2. 3D reconstruction process of a pit. (A) Preprocessing of 2D sliced image; (B) Stacking of continuous slices to form the initial 3D structure; (C) Initial 3D pit model; (D) Final refined pit model after smoothing.
Although Laplacian Smoothing effectively refines the surface of the mesh, excessive iterations can introduce undesirable artifacts such as volume shrinkage, loss of key geometric features, and reduced computational efficiency[38,39]. To address this, the number of smoothing iterations was carefully optimized for the model scales in this work. This optimization aimed to mitigate the "staircase effect" on the surface of the 3D model, ensuring that the surface area closely reflected that of the actual pit while maintaining volume and depth variation within 2%.
Once the 3D reconstruction models were established, key geometric parameters, including surface area, volume, maximum width, and depth, were extracted for further analysis. Changes in these parameters over time were then fitted to appropriate functional models to elucidate growth patterns. For surface area measurements, an interpolation method was employed, which inserted additional points between existing mesh nodes to generate a continuous, smooth surface. This facilitated more accurate calculation of the total pit surface area. The pit volume was derived by quantifying the number of voxels within the reconstructed 3D region, from which the overall volume was computed.
RESULTS AND DISCUSSION
2D analysis of pitting growth
In this section, the early-stage pit initiation and inclusion-related characteristics are described, while the subsequent metastable and steady-state growth behaviors are discussed in Section “Dynamic evolution of pitting corrosion based on 3D reconstruction”.
Pit initiation process
Figure 3 shows the morphology and composition of inclusions in Inconel 690 alloy. The inclusions generally exhibit well-defined geometries, including triangular and square shapes, with sizes ranging from a few micrometers. Figure 3A and B show TiN-coated MgO and Al2O3 inclusions, approximately 2-5 μm in size. EDS analysis confirms that the core regions are predominantly MgO and Al2O3, partially encapsulated by TiN. Additionally, Figure 3C depicts TiN inclusions, often near-square or irregular in shape. Ti, an essential element in Inconel 690 alloy, enhances its oxidation resistance and stress corrosion cracking resistance. Despite trace concentrations of Ti and N, the low formation energy of TiN favors its formation during solidification. MgO and Al2O3, as impurities introduced from refractory materials during smelting, are high-melting-point compounds. During solidification, TiN inclusions nucleate on MgO and Al2O3, with additional homogeneous nucleation of TiN also occurring[40].
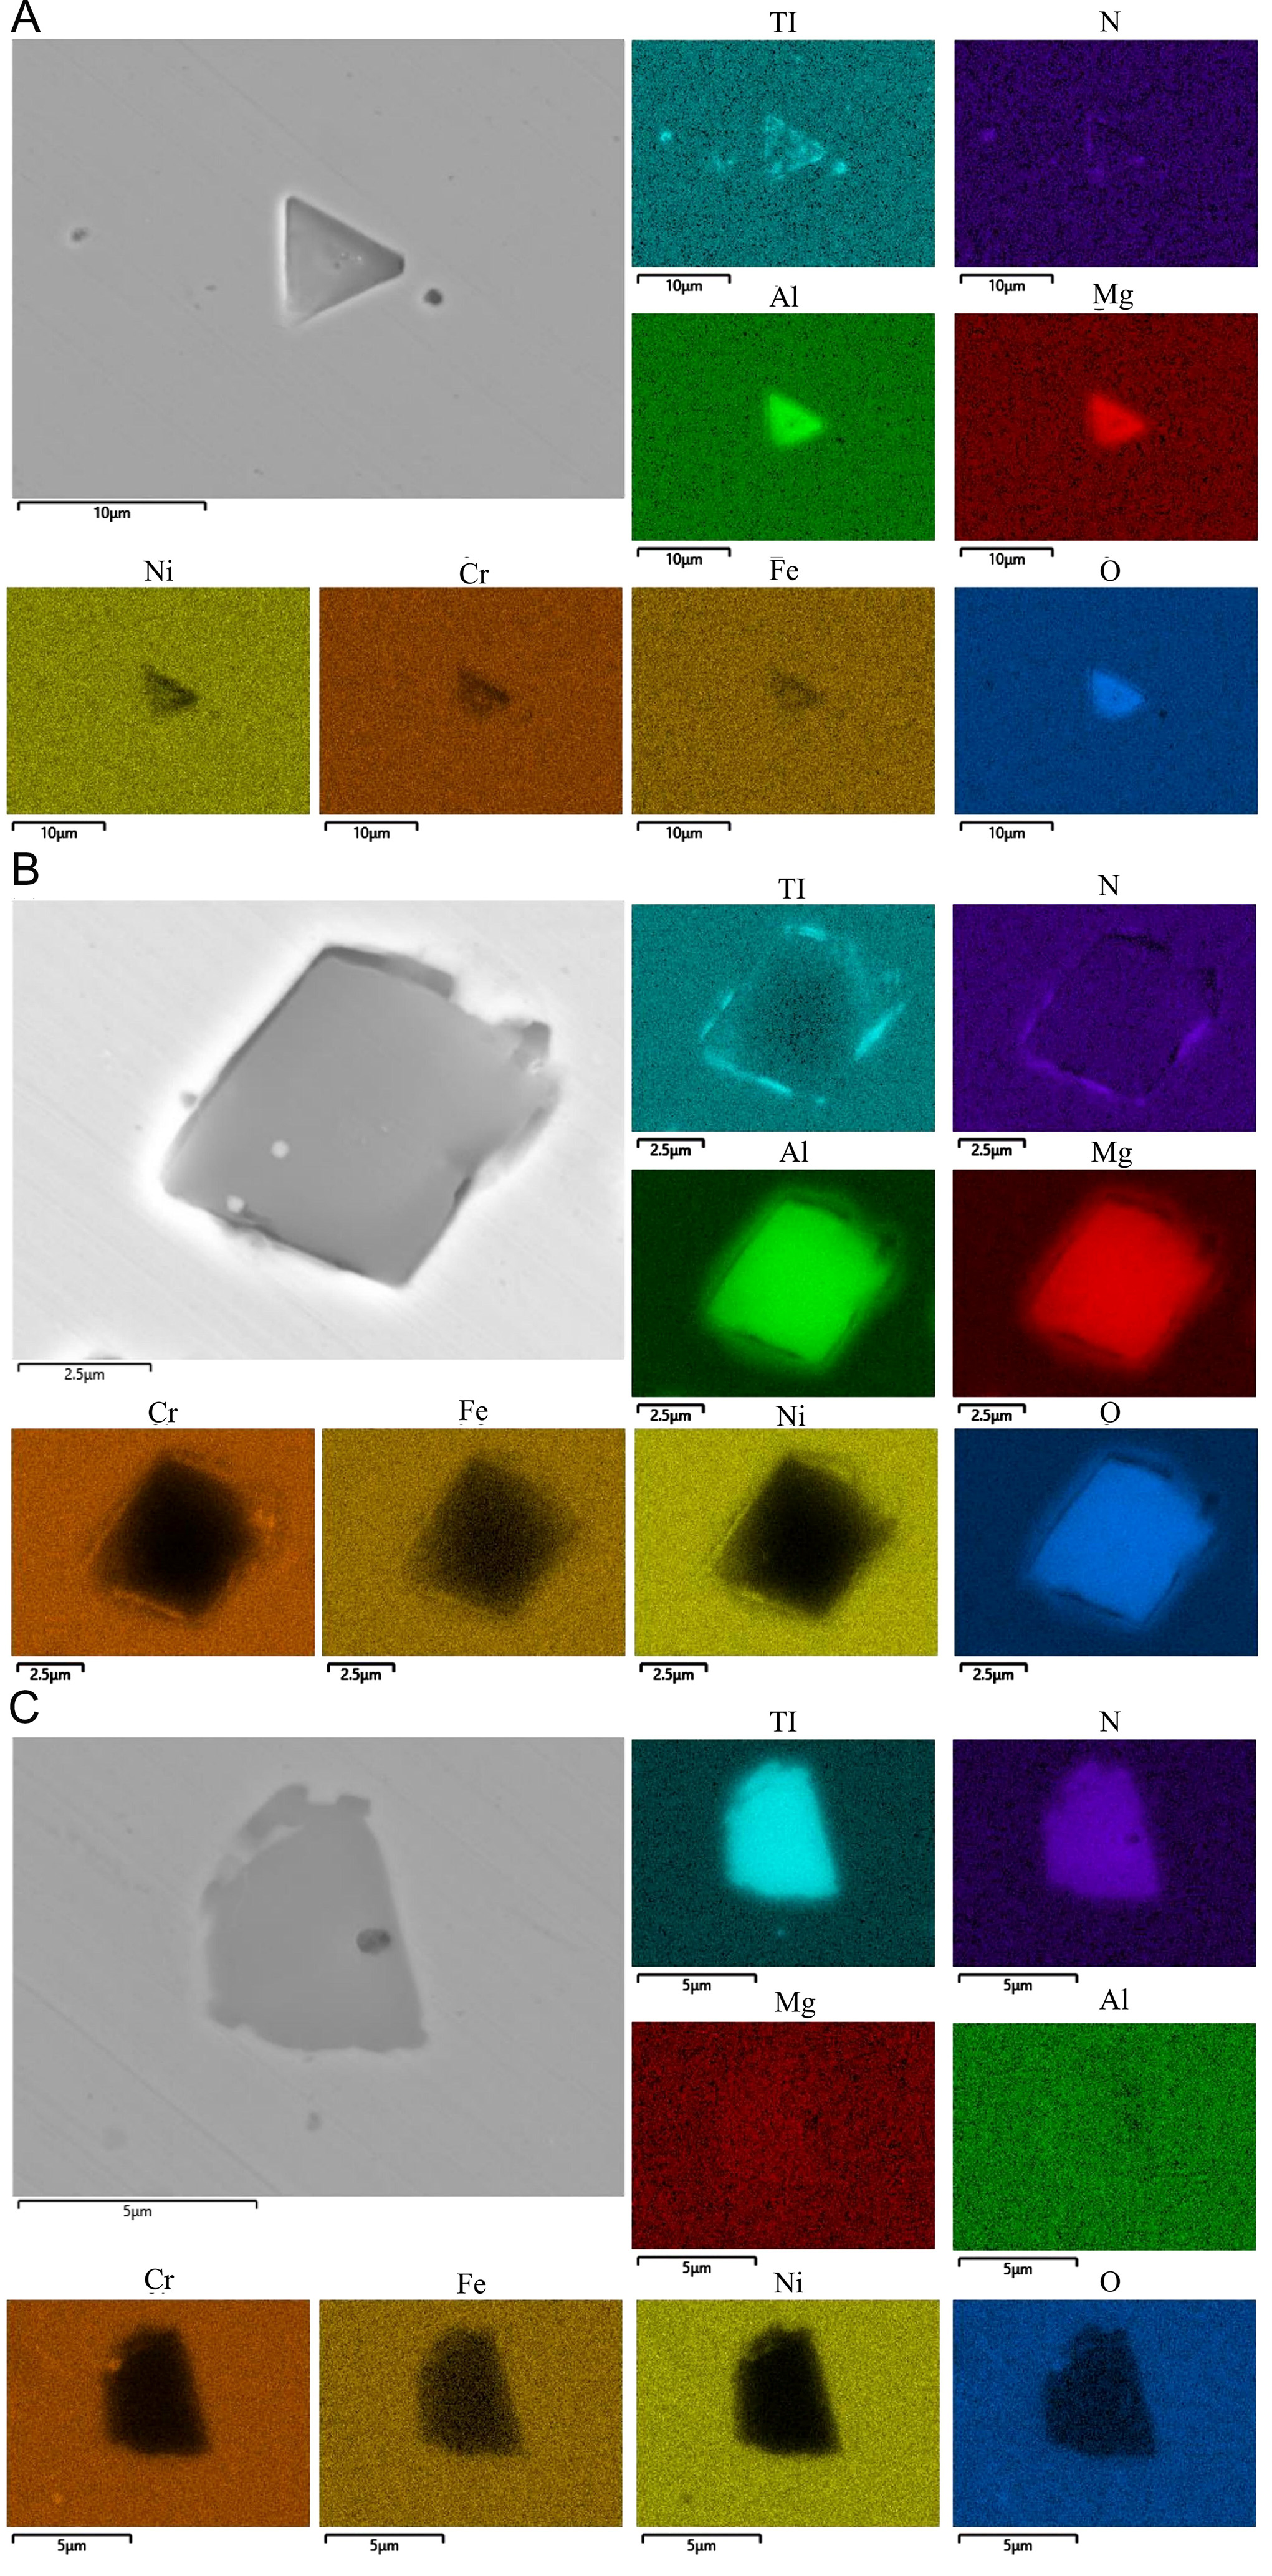
Figure 3. SEM image and associated EDS mapping of inclusions in Inconel 690 alloy: (A) Triangular MgO and Al2O3 inclusions encapsulated by TiN; (B) Square MgO and Al2O3 inclusions encapsulated by TiN; (C) TiN inclusion.
Figure 4 illustrates the evolution of inclusions as initiation sites for pitting. In Figure 4B, microcracks are observed between the inclusions and the matrix, representing initial pit sites. As corrosion progresses,
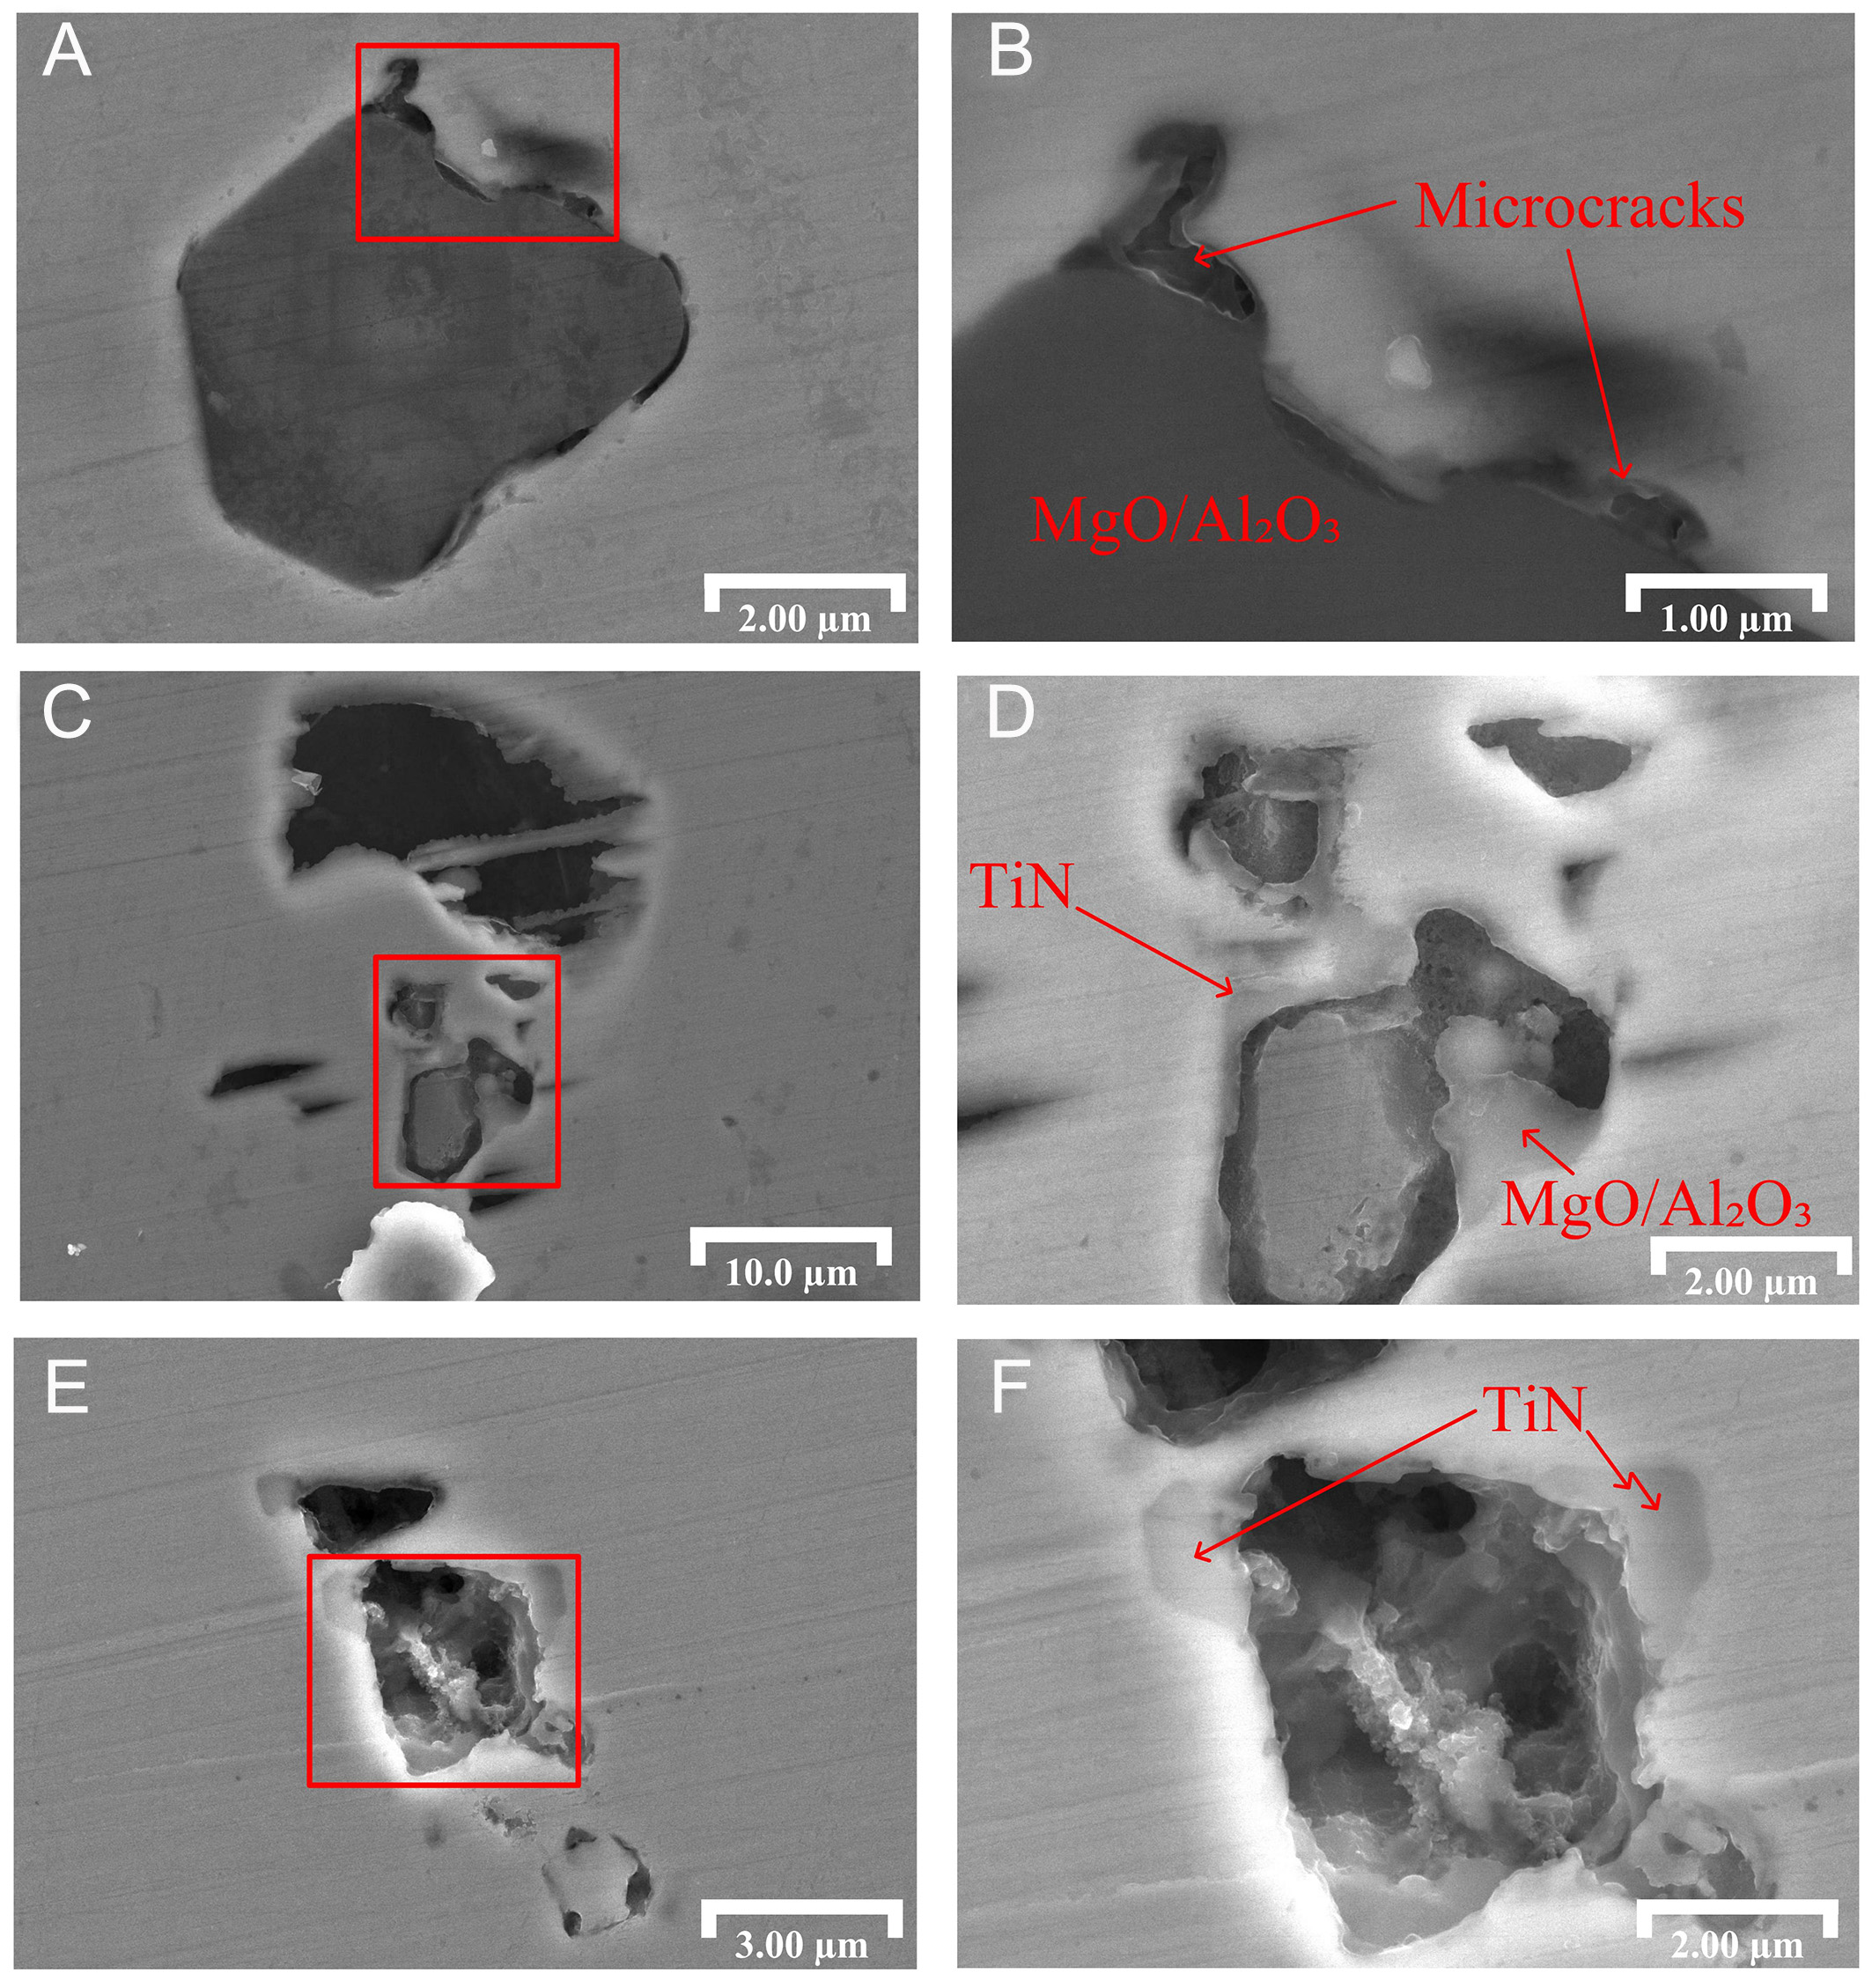
Figure 4. Progressive dissolution of inclusions leading to pit formation: (A and B) Microcracks at the interface between non-metallic inclusions and the matrix; (C and D) Preferential dissolution along the inclusion-matrix interface; (E and F) Progressive dissolution of non-metallic inclusions until disappearance.
Previous studies have shown that corrosion preferentially initiates in the vicinity of oxide inclusions or inclusion-matrix interfaces, indicating that MgO-containing inclusions can markedly increase the susceptibility to localized corrosion and pitting behavior[46]. Firstly, a potential difference exists between the inclusions and the matrix. TiN, a hard and electrochemically stable compound, exhibits a higher potential than the surrounding Ni and Cr matrix elements, making it cathodic relative to the matrix in corrosive environments. This galvanic coupling accelerates localized dissolution of the matrix around the inclusions, leading to pit initiation. Secondly, the Cr2O3-based passive film commonly reported to protect the alloy surface can be locally compromised or inhomogeneous at inclusion sites, allowing corrosive media to penetrate and initiate pitting. Thirdly, the mismatch in thermal expansion coefficients between MgO inclusions and the metallic matrix may lead to local stress concentration at the inclusion-matrix interface under thermal cycling or service conditions. Such stress concentration can potentially promote interfacial damage or microstructural defects, which may provide preferential pathways for the ingress of corrosive agents, thereby further accelerating pitting development.
Figure 5 shows that pits formed on the surface of Inconel 690 alloy, which are commonly associated with passive film breakdown, typically appear as shallow depressions, several micrometers in diameter, with disc-like morphologies and no inclusions present within them. This observation indicates that passive film breakdown not only originate at the inclusion-matrix interface. Instead, discontinuities in the passive film may also develop at non-inclusion sites, where localized damage facilitates the adsorption of Cl-, and initiates pitting. Such breakdown is often associated with minor surface defects, including grain boundaries or compositionally heterogeneous regions. At these sites, Cl- preferentially adsorb at defects in the passive film, replacing hydroxyl groups and forming soluble chlorides. This substitution reaction further degrades the protective film, exposing the underlying matrix and driving localized anodic dissolution that gives rise to pits. Direct characterization of the passive film (e.g., XPS or TEM analysis) is beyond the scope of the present study and will be considered in future investigations. Moreover, the presence of Cl- lowers the corrosion potential and increases current density, thereby accelerating pit initiation and propagation.
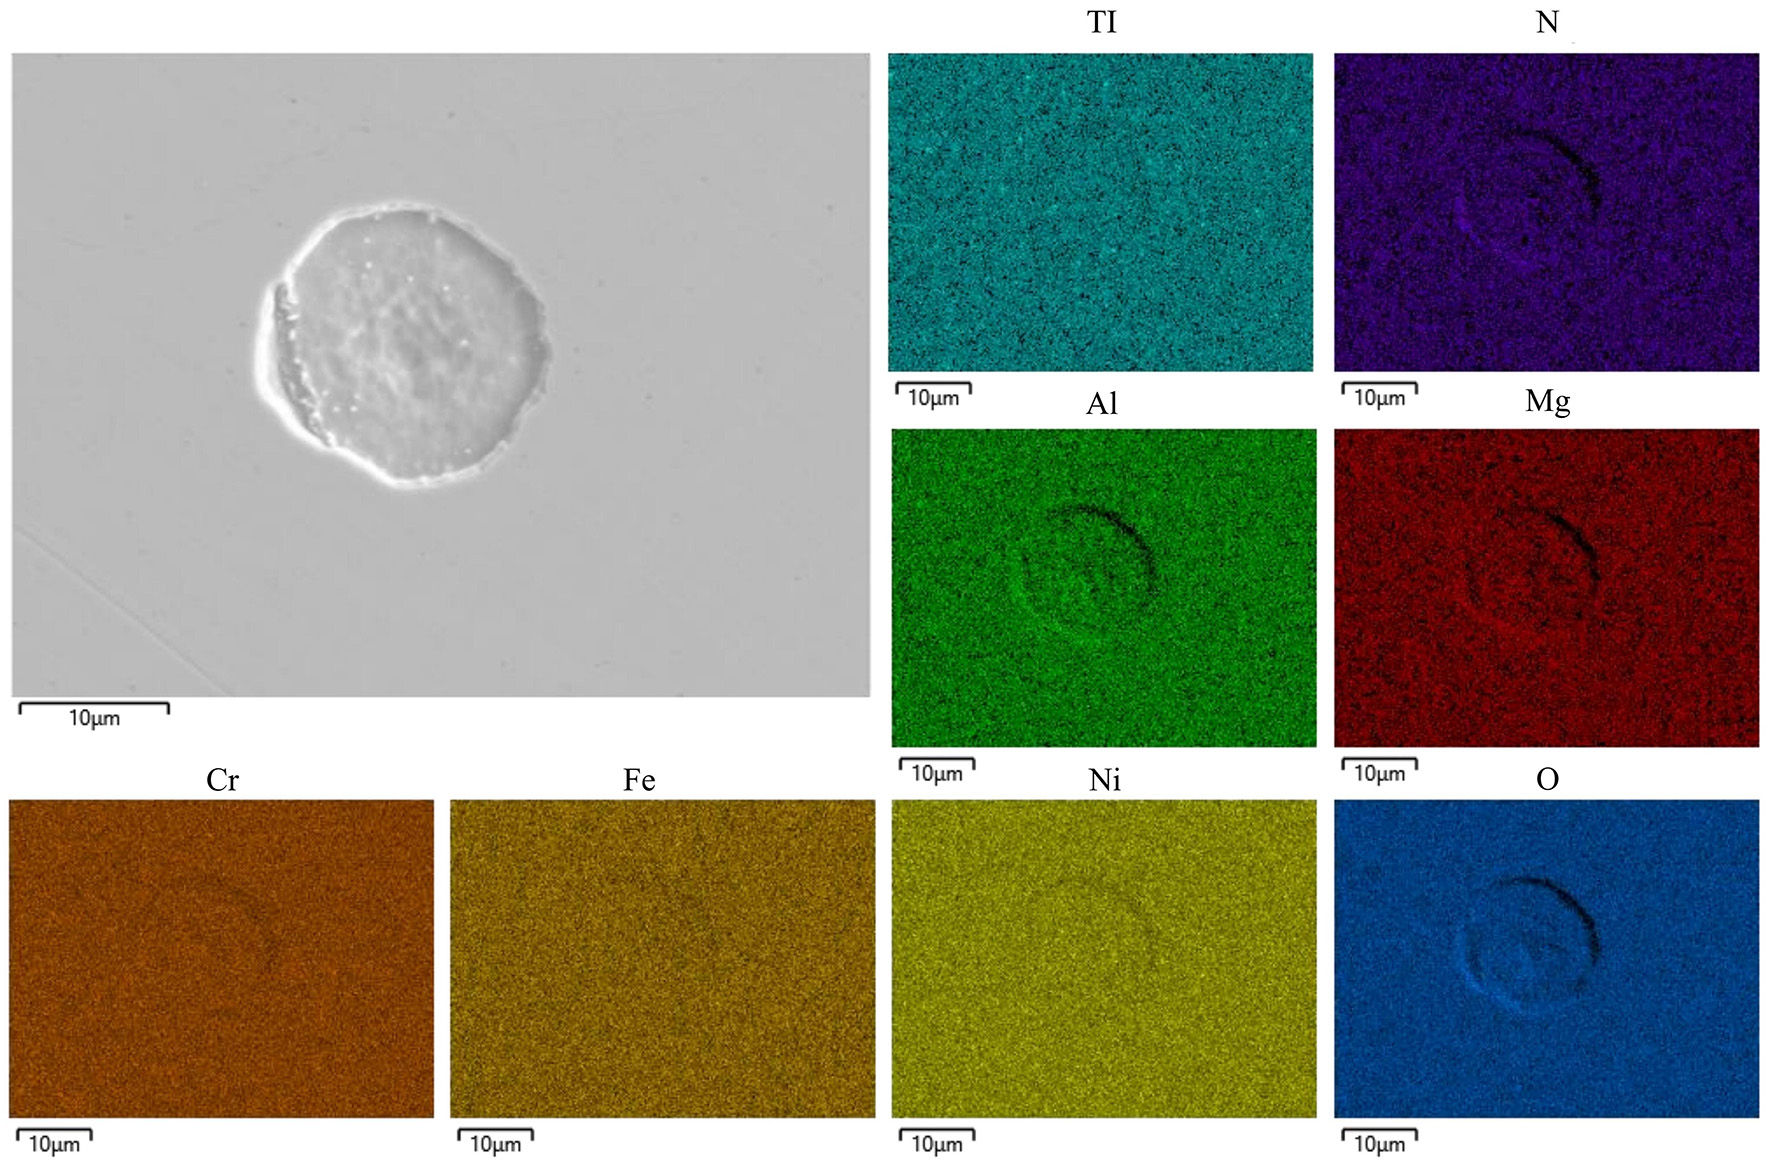
Figure 5. SEM image of a disc-shaped pit and the corresponding EDS spectrum.
Metastable growth process
During the experiments, it was observed that most of the disc-shaped pits formed by passive film breakdown on the surface of Inconel 690 alloy exhibited limited growth at 70 °C. To further investigate this phenomenon, the experimental conditions were adjusted to enhance the likelihood of pit development. Specifically, the corrosion temperature was increased to 90 °C, as elevated temperatures promote passive film breakdown, thereby facilitating the investigation of pit evolution at non-inclusion sites.
In situ observations were performed using OM at 1,000 × magnification. As shown in Figure 6A, two inclusions were identified as reference markers in the selected region of interest, enabling continuous tracking of the corrosion evolution. After 1 h of immersion at 90 °C, numerous pits that are typically associated with passive film breakdown appeared in the monitored region, as shown in Figure 6B. However, upon further exposure for 2 h, the majority of these pits did not propagate further, with only a single pit continuing to grow into a larger cavity.
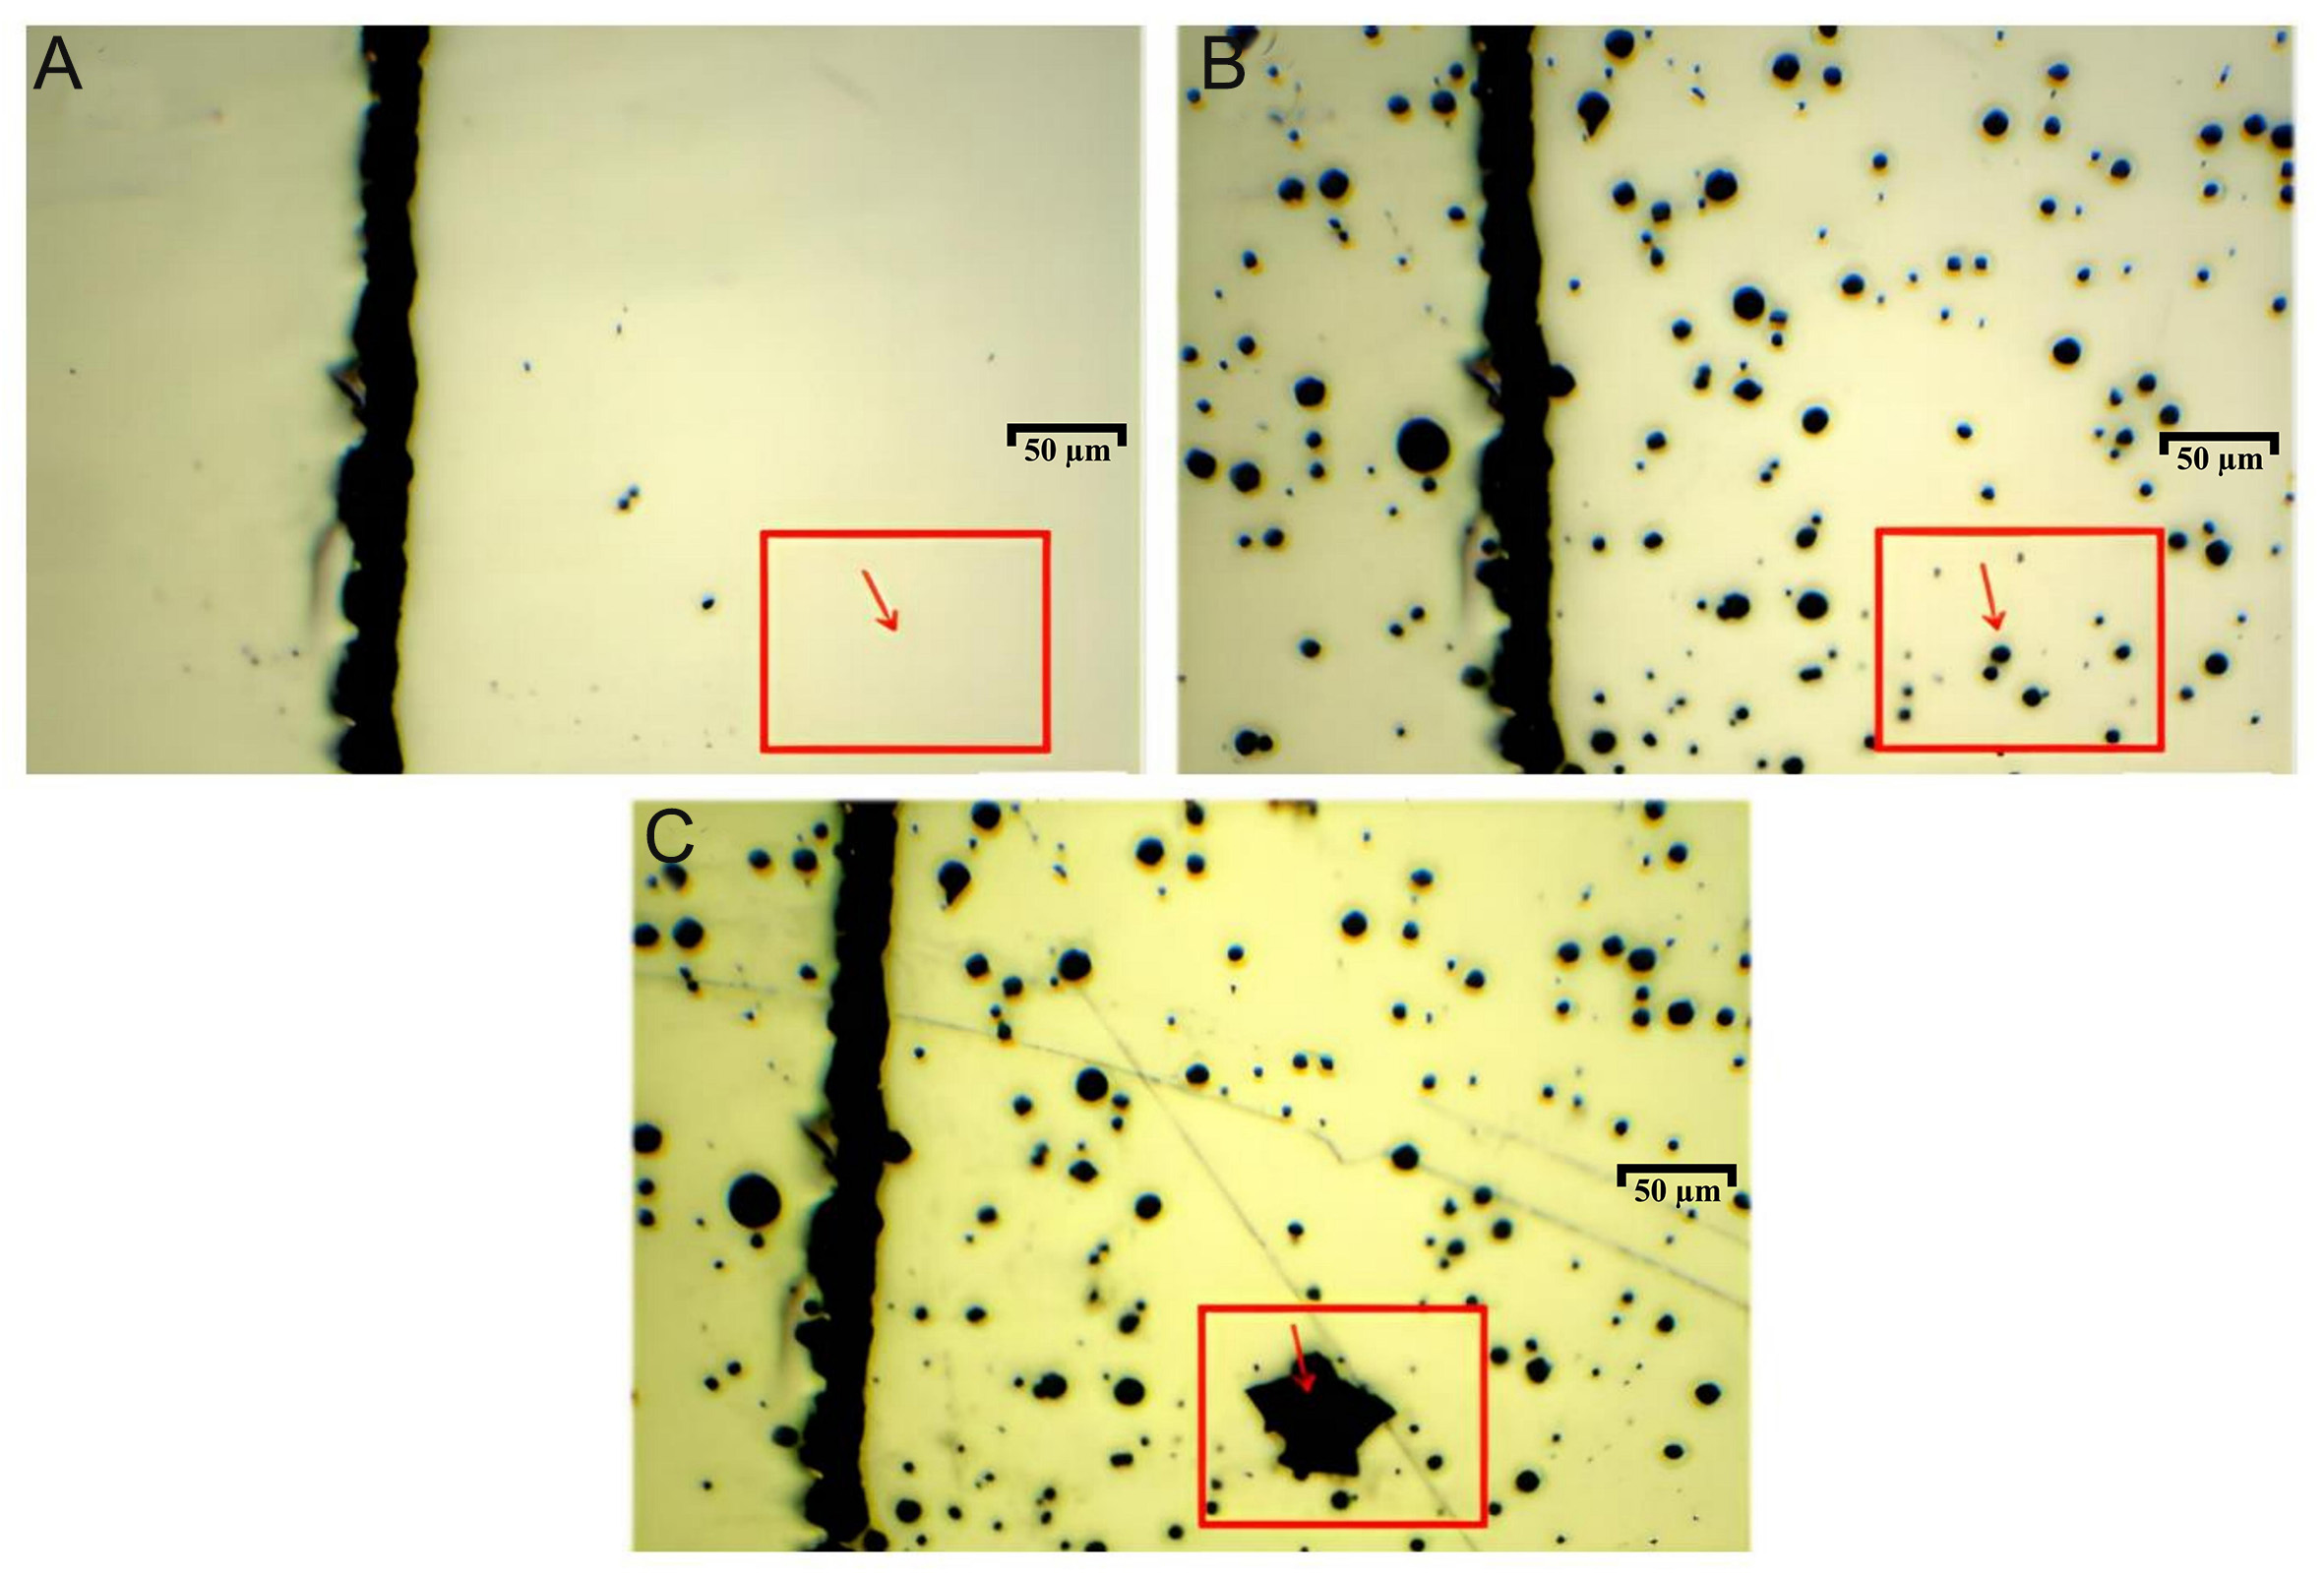
Figure 6. Optical micrographs of pits formed by passive film breakdown at non-inclusion sites: (A) Surface of the uncorroded sample; (B) After 1 h of corrosion at 90 °C; (C) After 2 h of corrosion at 90 °C.
This behavior reflects the metastable nature of pitting growth, wherein pits may evolve along two distinct pathways. In the first case, shallow pits fail to sustain the local accumulation of Cl-, limiting vertical growth. These pits undergo repassivation and cease to propagate, as seen in the majority of cases in Figure 6. In the second case, a small subset of metastable pits avoids repassivation and transition into steady-state growth. Localized deepening promotes Cl- accumulation, which in turn accelerates corrosion through a positive feedback mechanism. These pits progressively enlarge and evolve into stable, sustained corrosion sites, as shown in Figure 7.
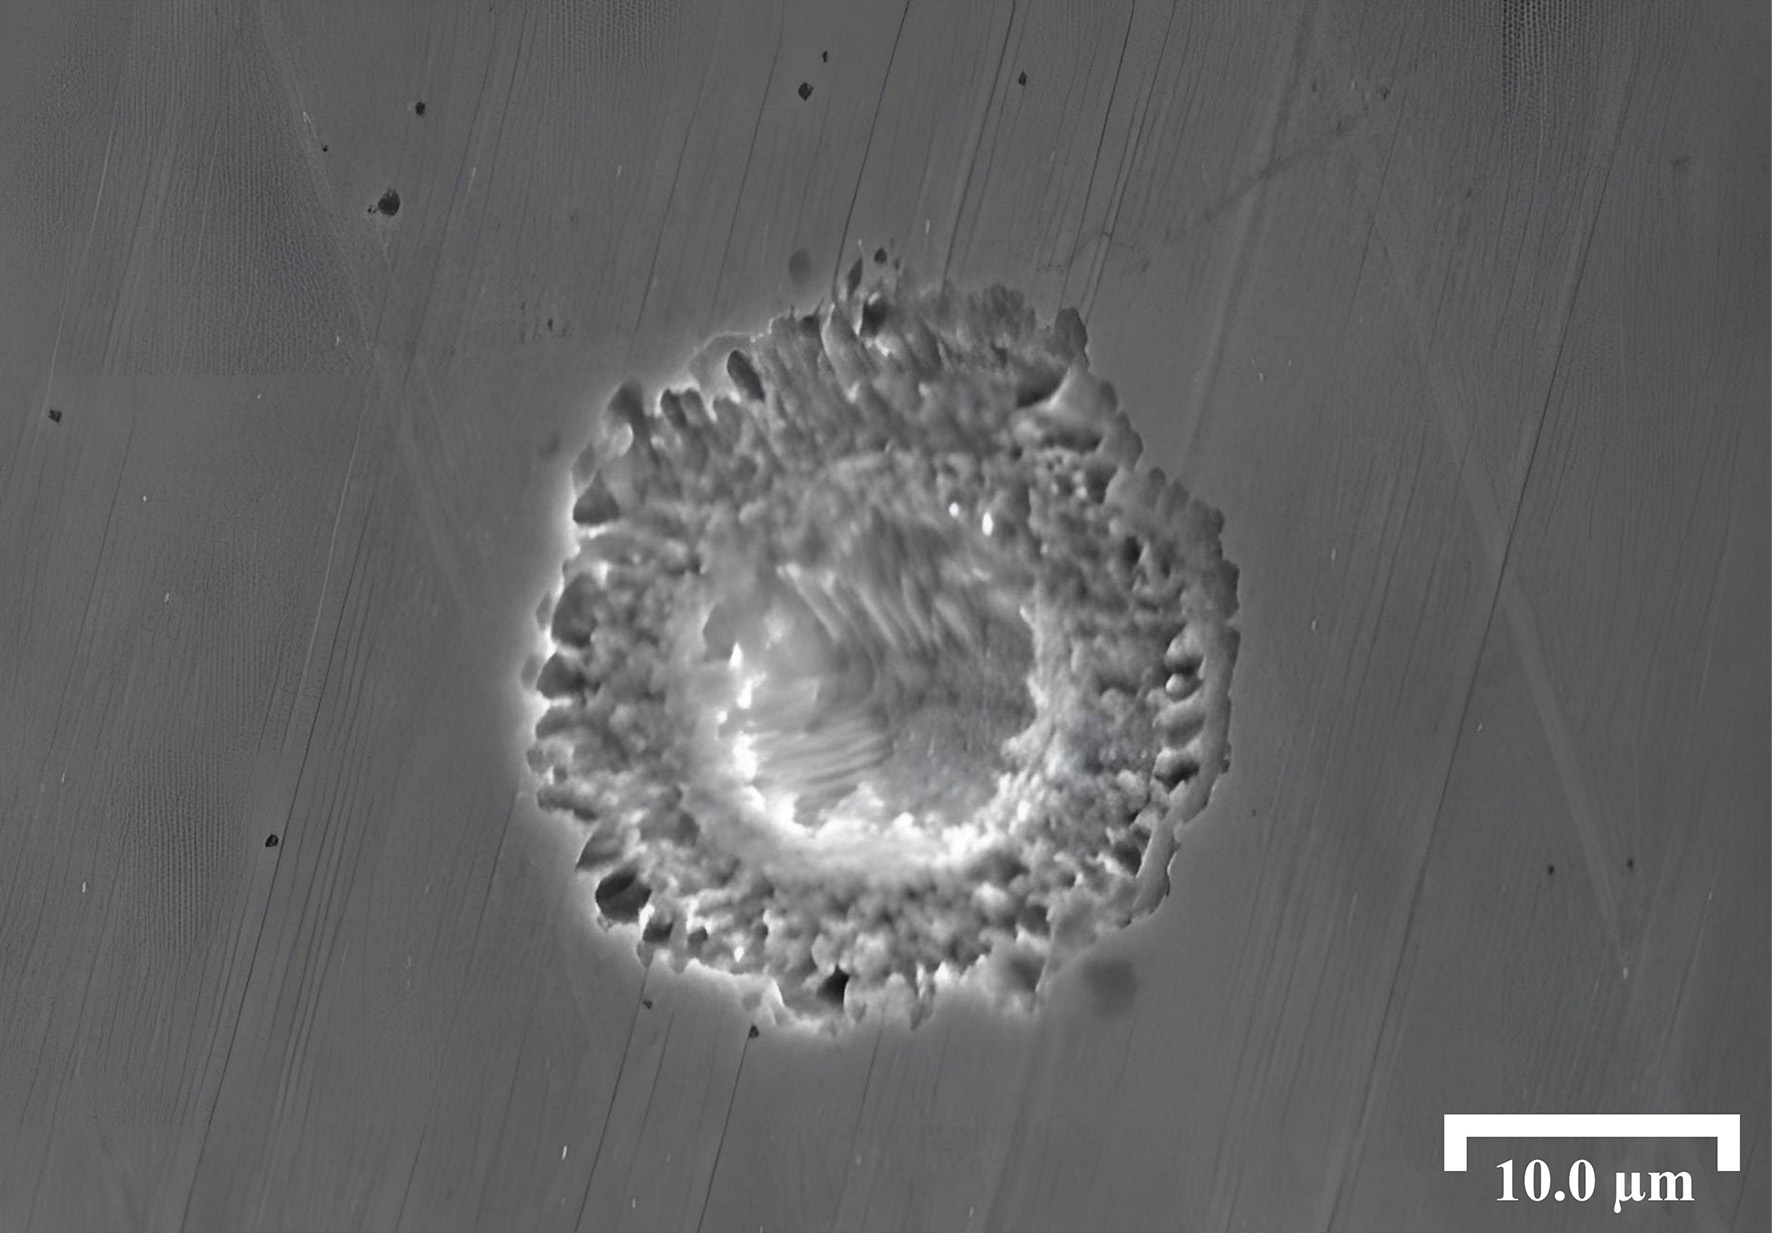
Figure 7. SEM top-view of the localized propagation of a metastable pit.
Steady-state growth process
Figure 8 shows the surface evolution of pits in Inconel 690 alloy with increasing immersion time in 6% FeCl3 + 0.16% HCl solution at 70 °C. Pits expanded outward from their central initiation sites, during which thin lacy covers formed above them. As growth proceeded, these covers eventually fractured and collapsed. The lacy covers were relatively thin, typically ranging from several to more than ten micrometers in thickness, as shown in Figure 8A. During enlargement, pits expanded radially from the initiation center, maintaining an approximately circular morphology, as shown in Figure 8B.
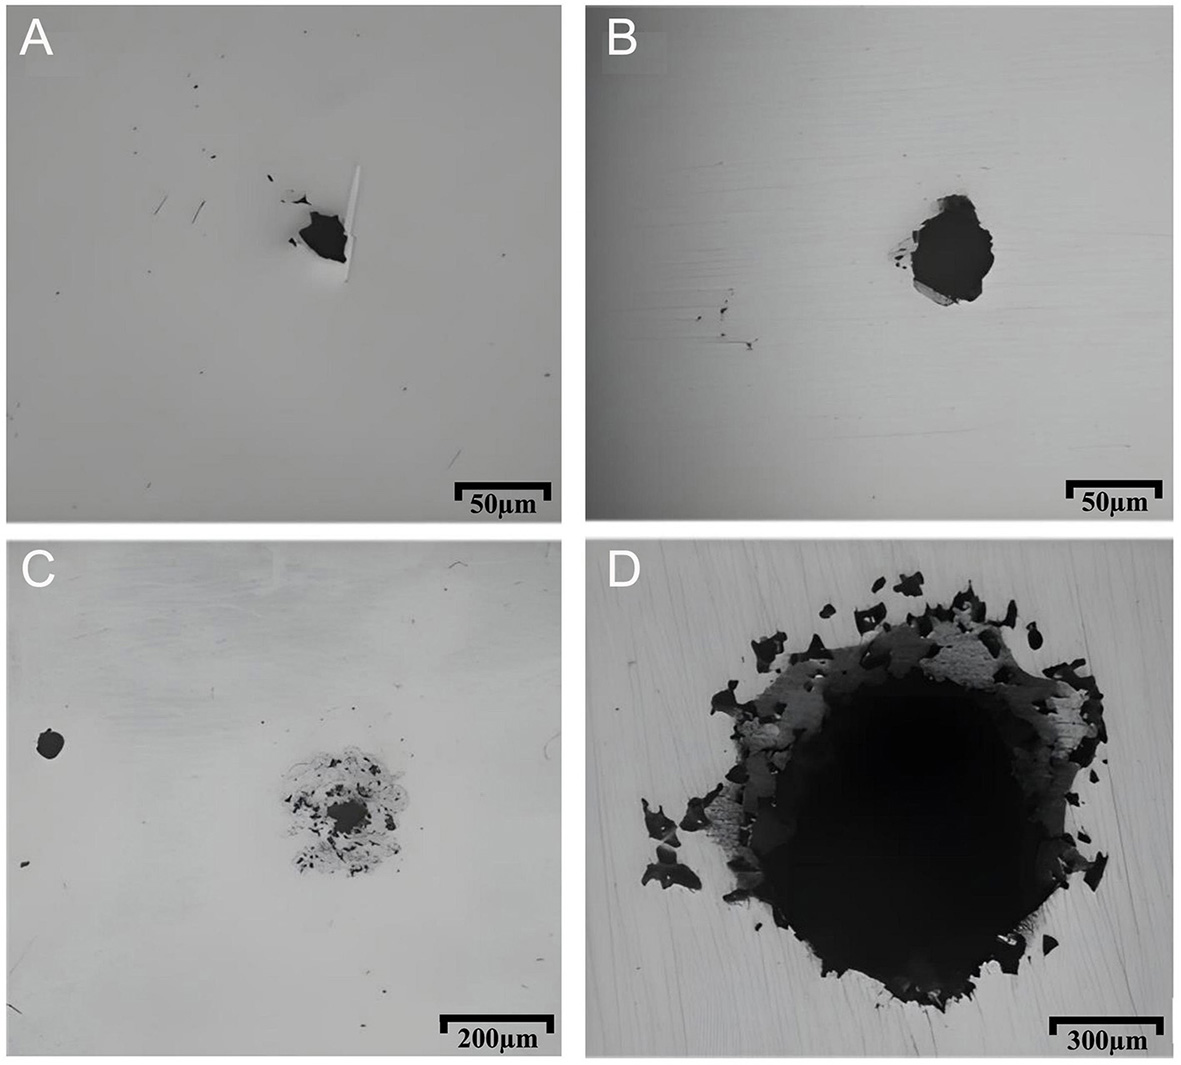
Figure 8. Growth process of pits on Inconel 690 alloy in 6% FeCl3 + 0.16% HCl solution at 70 °C (A) 9 h, (B) 12 h, (C) 15 h, and (D) 18 h.
As illustrated in Figure 9, detachment of the lacy cover in larger pits could even lead to the formation of secondary pits within the interior. The lacy cover functioned as a diffusion barrier during early pit growth, stabilizing the localized environment and facilitating continued propagation. Once the pit reached sufficient depth in the vertical direction, its geometry alone provided an effective diffusion barrier for sustaining the aggressive electrolyte within the cavity. Meanwhile, the lacy cover itself underwent progressive corrosion, developing perforations that gave rise to its characteristic morphology before ultimately collapsing and disappearing as the pit matured[34].
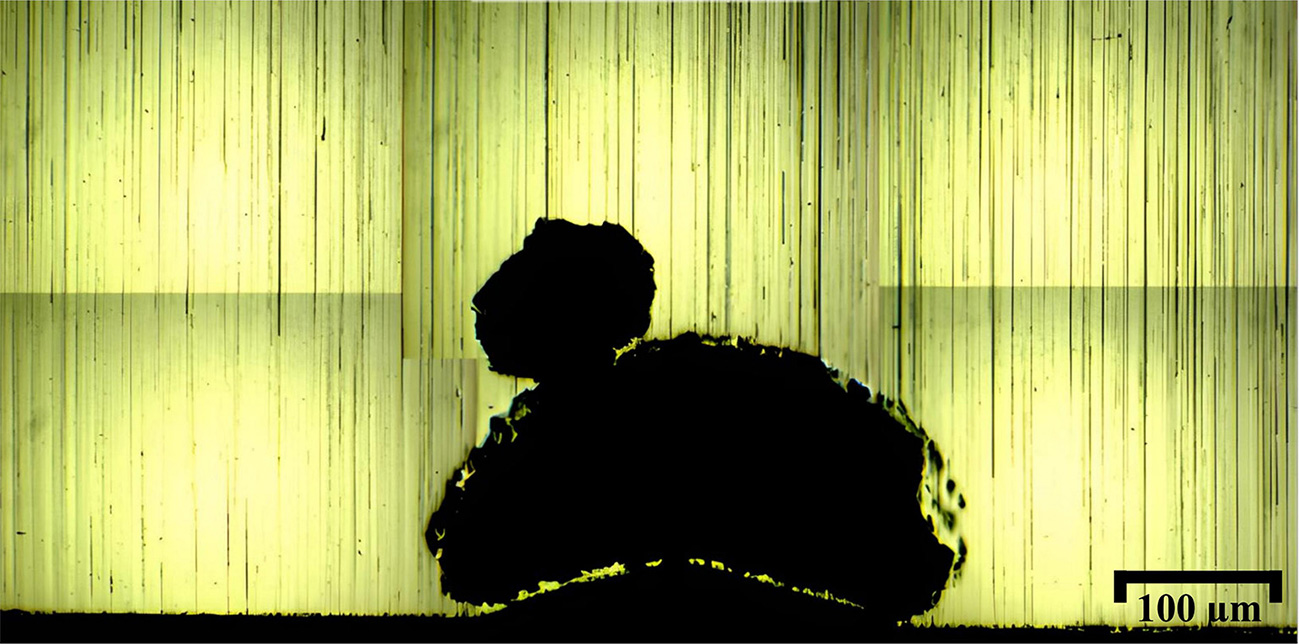
Figure 9. Cross-sectional morphology of secondary pit growth.
Analysis of corrosion products
Figure 10 shows the cross-section of a pit following freezing, extraction, and air-drying. Elemental analysis combined with EDS spectra revealed marked accumulation of Cl within the corrosion product region, together with pronounced enrichment of O and Cr. These findings indicate the formation of sparingly soluble Cr oxides during the corrosion process. In contrast, Ni and Fe were only sporadically distributed. Their corrosion products, primarily chlorides, remained soluble and readily exchanged with the external environment, preventing their accumulation within the pit region.
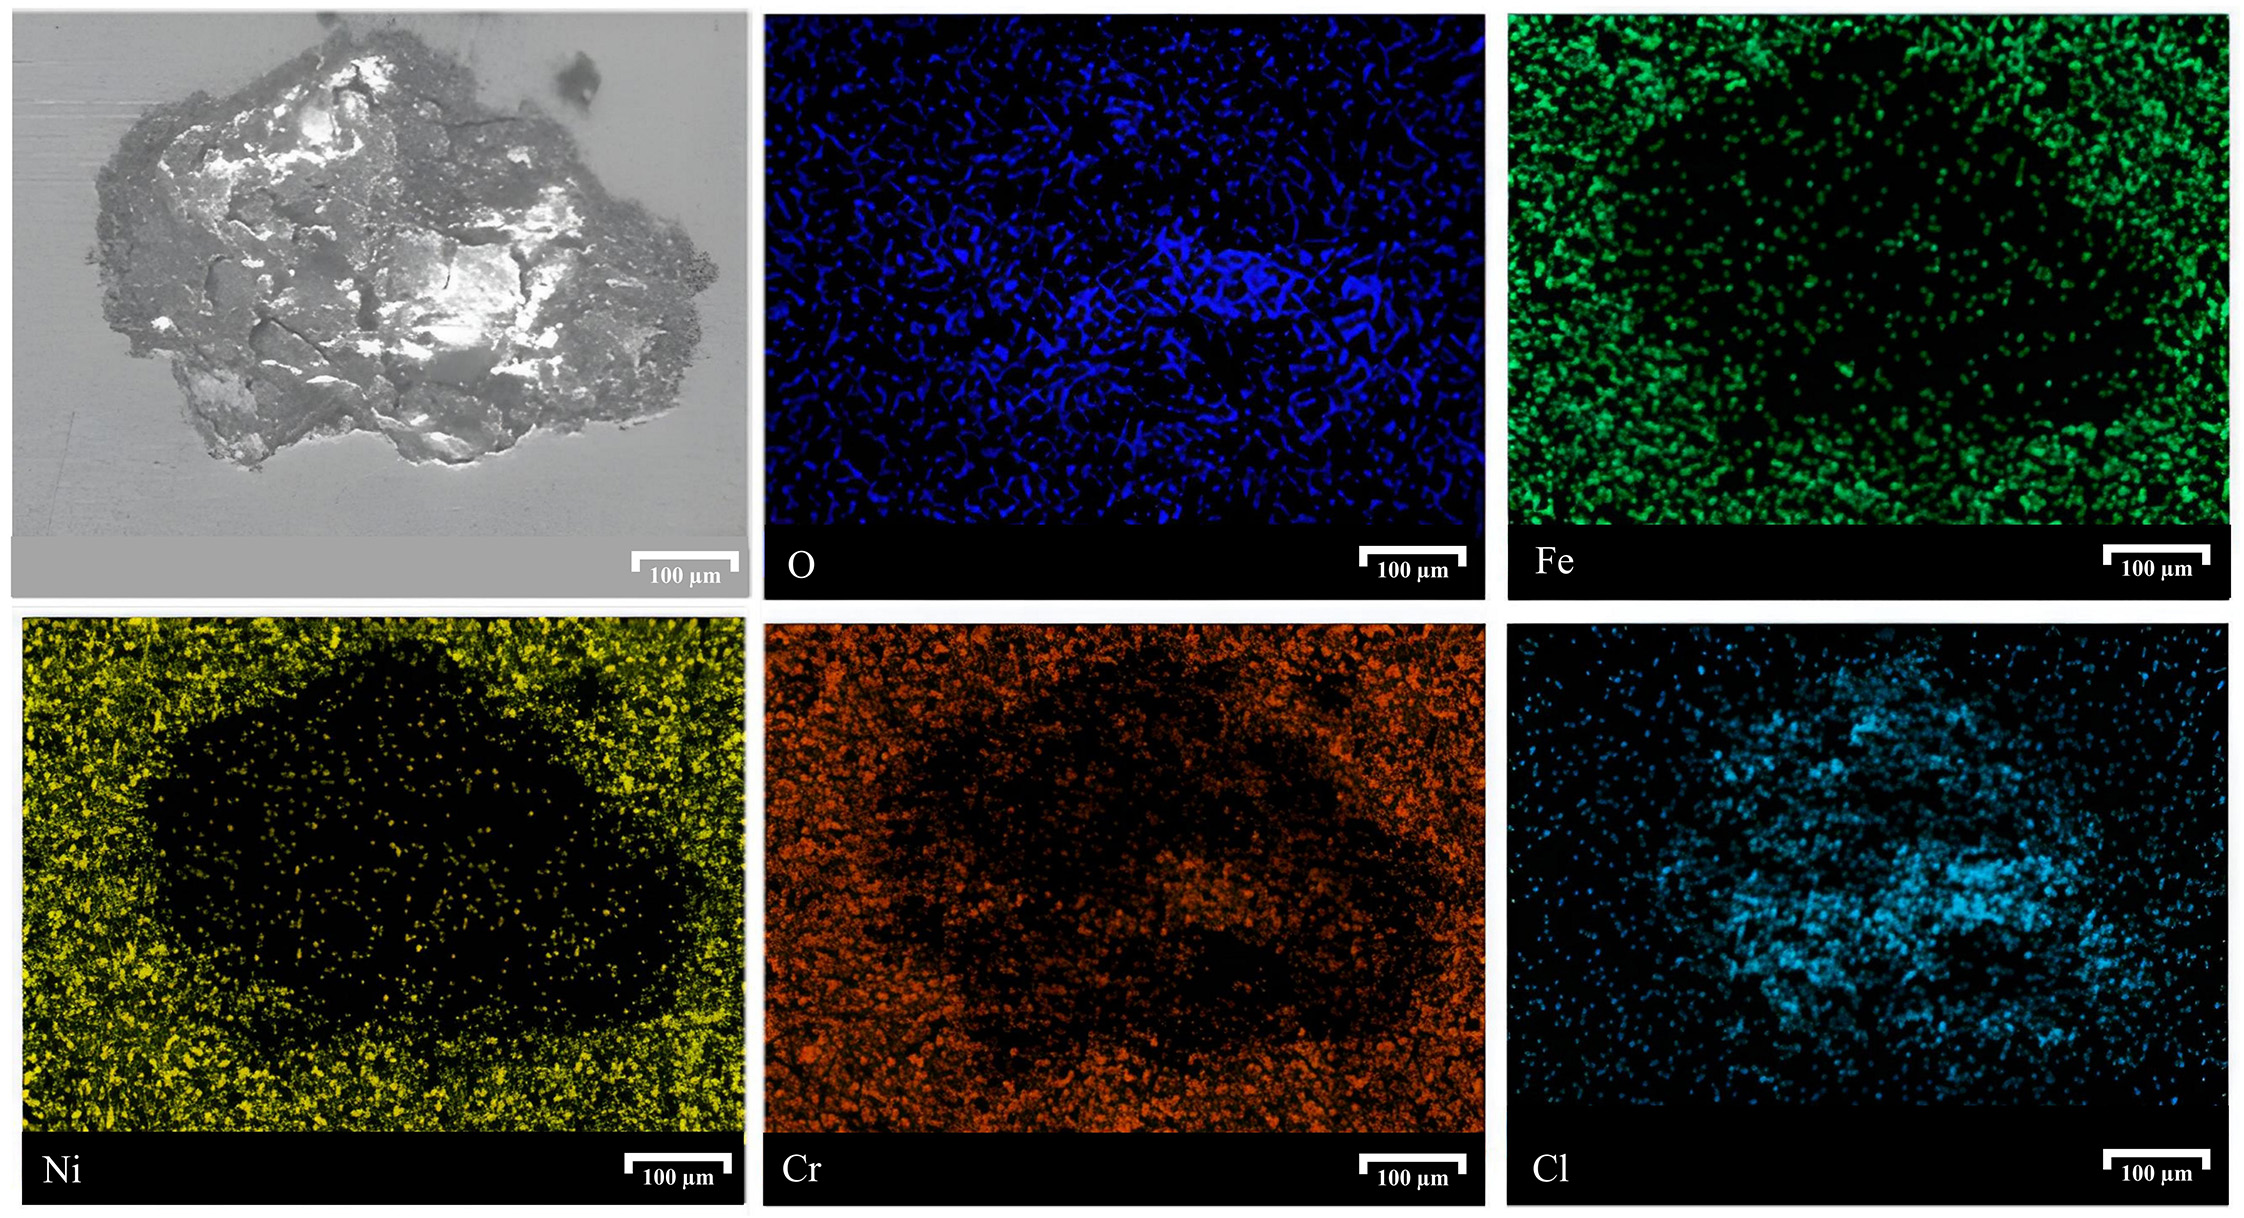
Figure 10. SEM morphology of corrosion products inside a pit and corresponding EDS spectra.
Cross-sections of pits before and after lacy cover formation were examined, and compositional mapping and line-scan analyses were performed using EDS [Figure 11]. As shown in Figure 11A, in the stage preceding lacy cover formation, only partial Cl enrichment was detected, while other ions remained at relatively low levels inside the pit. By contrast, after the lacy cover developed [Figure 11B], Cl accumulation became more pronounced, accompanied by pronounced enrichment of Cr, whereas Ni and Fe remained sparsely distributed. This difference arises because, without a cover, pits propagated at a relatively low corrosion rate, and dissolved species exchanged freely with the external solution, preventing substantial ionic accumulation[47]. The minor enrichment of Cr, Ni, and Fe observed in the EDS spectra at this stage likely resulted from the inadvertent intrusion of matrix debris during specimen preparation.
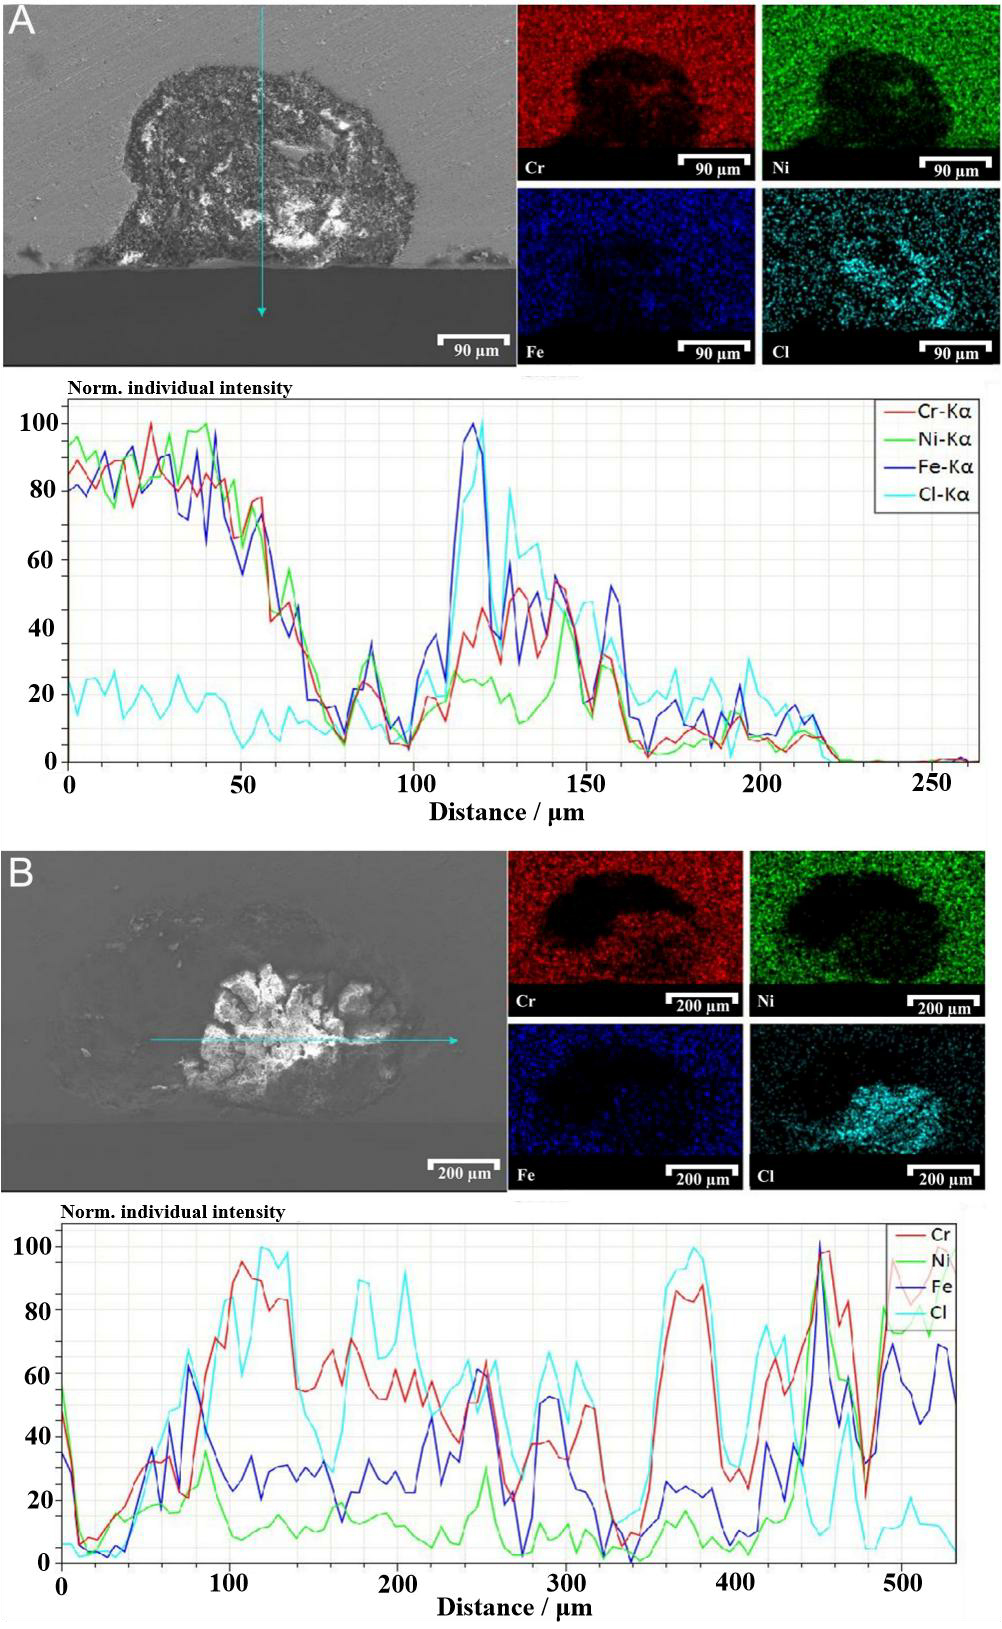
Figure 11. SEM morphology of corrosion products inside a pit with corresponding EDS mapping and line-scan spectra: (A) Before lacy cover formation; (B) After lacy cover formation.
The formation of a lacy cover accelerated the corrosion process, leading to the generation and retention of greater amounts of sparingly soluble Cr oxides. Line-scan analysis further supports this trend: in Figure 11A, the highest peaks of Cl and Fe correspond to FeCl3, the primary component of the corrosive medium, while a secondary Cl peak coincided with Cr, confirming limited Cr oxide accumulation. In contrast, nearly all Cl peaks in Figure 11B coincided with Cr peaks, indicating that the lacy cover promoted ion retention within the pit and enhanced the accumulation of sparingly soluble Cr oxides, thereby accelerating pit growth.
Dynamic evolution of pitting corrosion based on 3D reconstruction
For clarity, the pit growth stages discussed in this work are defined as follows. The metastable growth stage refers to the early phase characterized by intermittent pit propagation and frequent repassivation. Steady-state growth denotes sustained pit propagation under transport-limited conditions, accompanied by continuous pit deepening and lateral expansion. The rapid growth stage specifically describes the accelerated pit growth regime following lacy cover formation, during which pit volume and surface area increase sharply.
Evolution of pit 3D morphology
Figure 12 shows 3D reconstructed morphology of pits during their steady-state growth in 6% FeCl3 + 0.16% HCl solution at 70 °C. In the early stage of steady-state growth, pits expanded laterally, growing outward from the initiation site while also deepening, but at a slower rate, resulting in a disc-shaped morphology, as shown in Figure 12A. With continued immersion, lateral growth slowed, and depth propagation became dominant, producing a cylindrical morphology, as shown in Figure 12B.
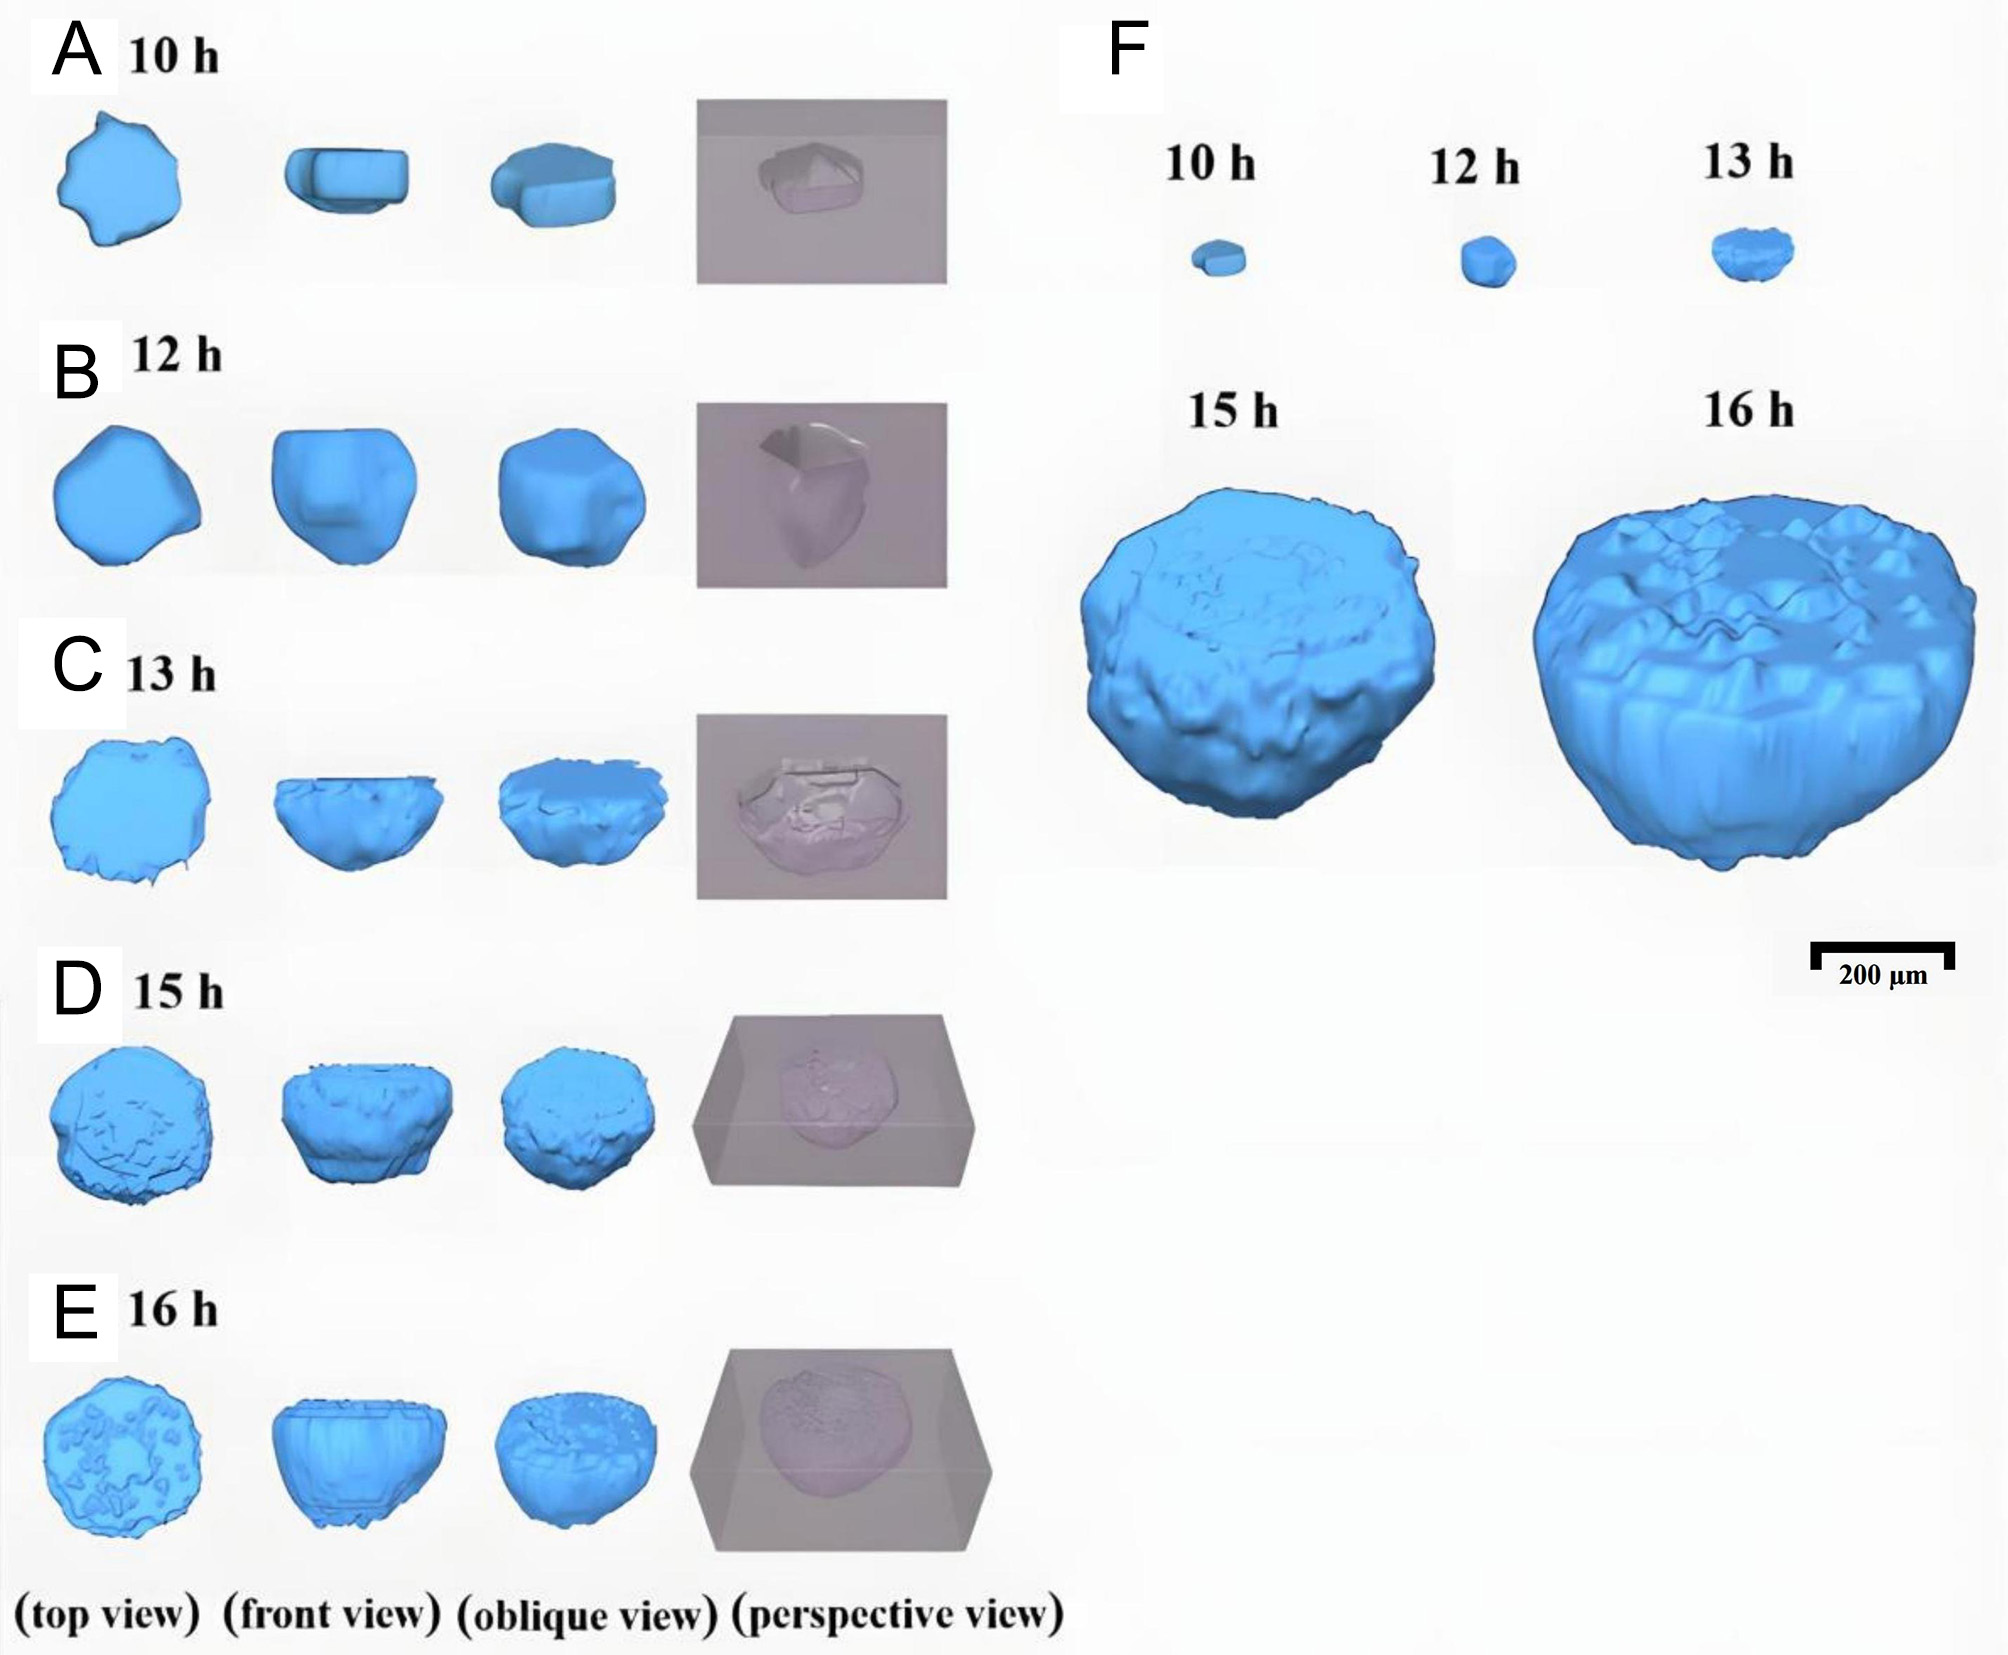
Figure 12. 3D reconstructed morphology of pits in Inconel 690 alloy immersed in a 6% FeCl3 + 0.16% HCl solution at 70 °C (A) 10 h,
As growth proceeded, a characteristic lacy cover developed over the pit, as shown in Figure 12C-E. Prior to cover formation, surface observations and 3D reconstructions revealed that the pit mouth width closely matched the maximum pit diameter, and most internal features were visible from the surface. After the cover formed, the 3D model (in blue) revealed protrusions at the uppermost layer corresponding to perforations in the lacy cover (in gray-purple box), with a surface opening much smaller than the pit’s maximum perimeter.
Figure 12F compares 3D pit reconstructions between 10 and 16 h at the same scale. Before the lacy cover developed, pit volume remained relatively small. Once the cover formed, pit volume increased sharply. This transition arises because pit growth requires retention of aggressive ions within the cavity. In the early stage, shallow pits struggle to trap ions and often repassivate. Once depth increases sufficiently, limited ion exchange slows transport to the external solution, enhancing localized attack near the pit mouth. These favors renewed lateral expansion, leading to hemispherical or ellipsoidal morphologies. Weak regions near the surface eventually perforate, forming the lacy cover, which further traps ions, accelerates corrosion, and drives rapid pit volume increase[27,31,48].
Figure 13 shows 3D reconstructed of pits formed in 6% FeCl3 + 0.16% HCl solution at 90 °C for immersion times of 4-9 h. Compared with 70 °C, pits grew markedly faster at elevated temperature, and the reconstructed lacy cover appeared larger and more densely perforated, indicating accelerated growth, as shown in Figure 13F. After 4 h, some metastable pits deepened and transitioned into steady-state pits. As shown in Figure 13A, the pits initially displayed a shallow disc-like morphology. With continued immersion, deeper propagation became dominant, and by 5-6 h the pit elongated markedly, evolving into a cylindrical shape, as shown in Figure 13B and C. This morphology enhanced ion retention, promoting sustained localized attack and setting the stage for rapid growth. By 7 h, higher temperature accelerated lacy cover development, producing densely distributed perforations, as shown in Figure 13D. As growth proceeded, the pit transitioned towards a hemispherical morphology with sharply increasing volume. At 9 h, the lacy cover collapsed, exposing the interior cavity and revealing considerable depth and width, as shown in Figure 13E. Such extensive pit growth, if occurring in service environments, could critically undermine corrosion resistance and pose risks of irreversible structural damage.
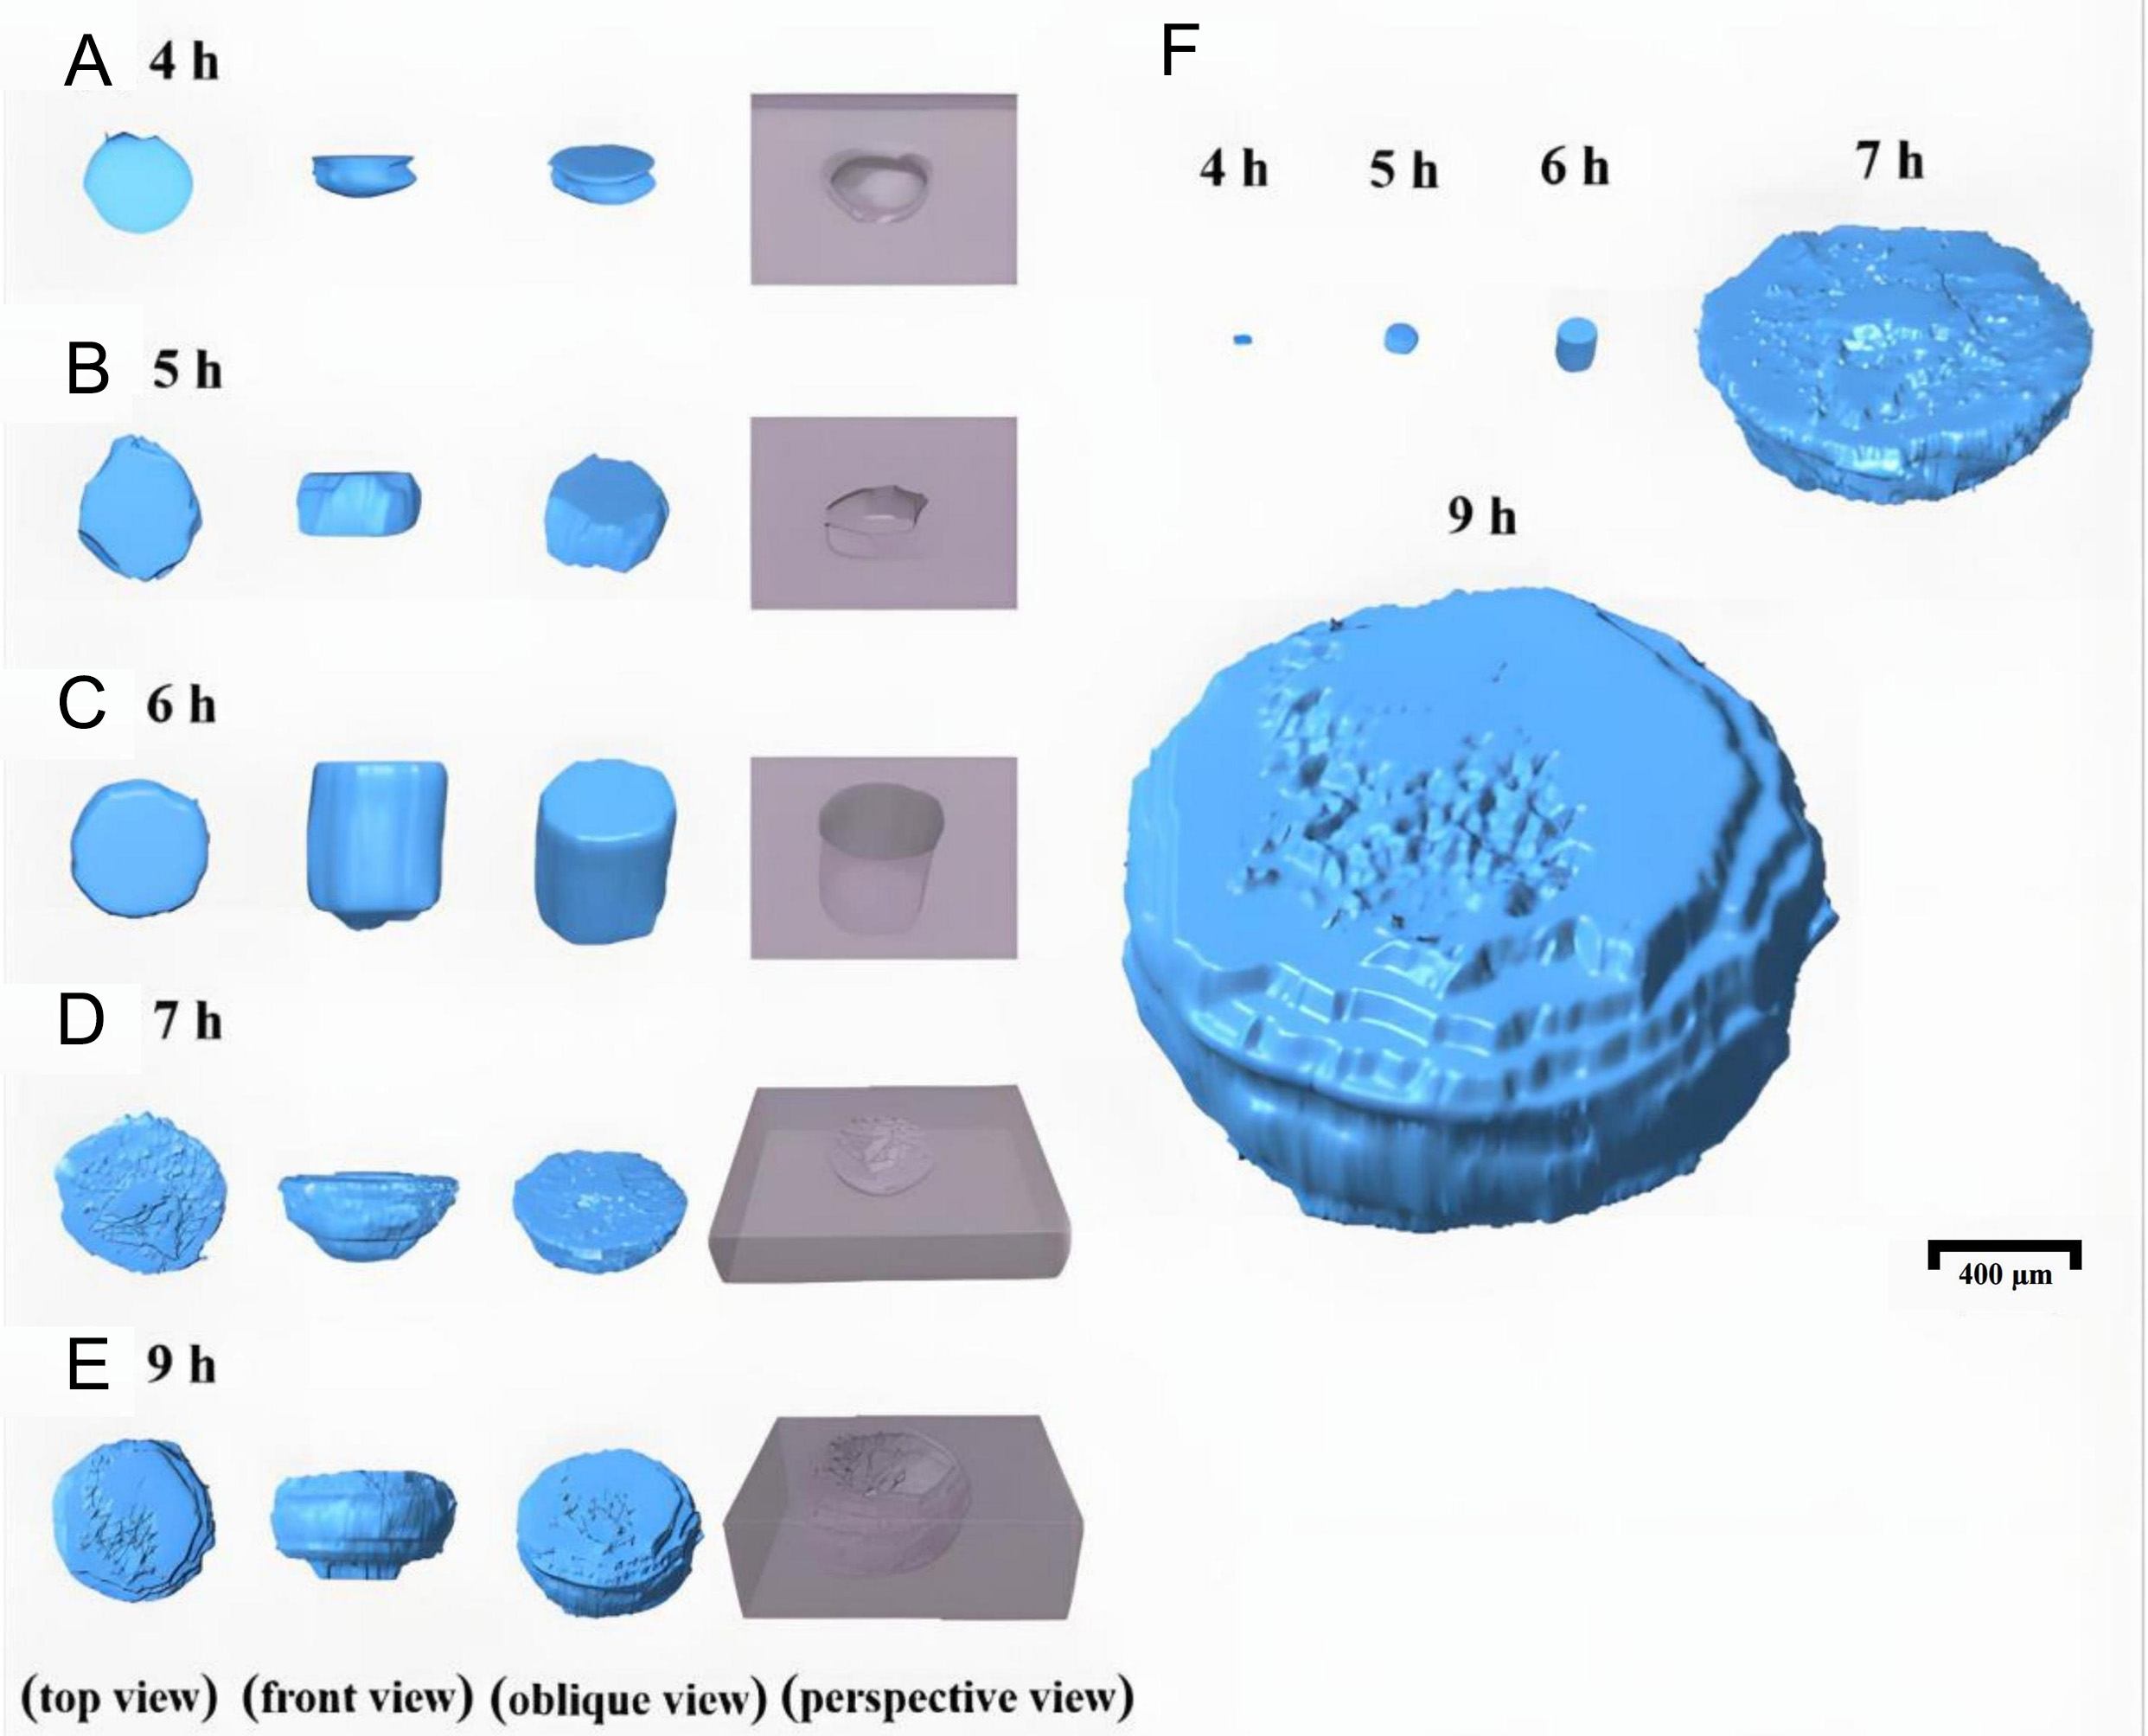
Figure 13. 3D reconstructed morphology of pits in Inconel 690 alloy immersed in 6% FeCl3 + 0.16% HCl solution at 90 °C. (A) 4 h, (B) 5 h, (C) 6 h, (D) 7 h, (E) 9 h, (F) comparative pit scale evolution between 4-9 h immersion.
Analysis of 3D pit feature parameters
The 3D feature parameters of pits including surface area, volume, width, and depth with temporal evolution under 70 and 90 °C conditions, illustrated in Figures 14 and 15.
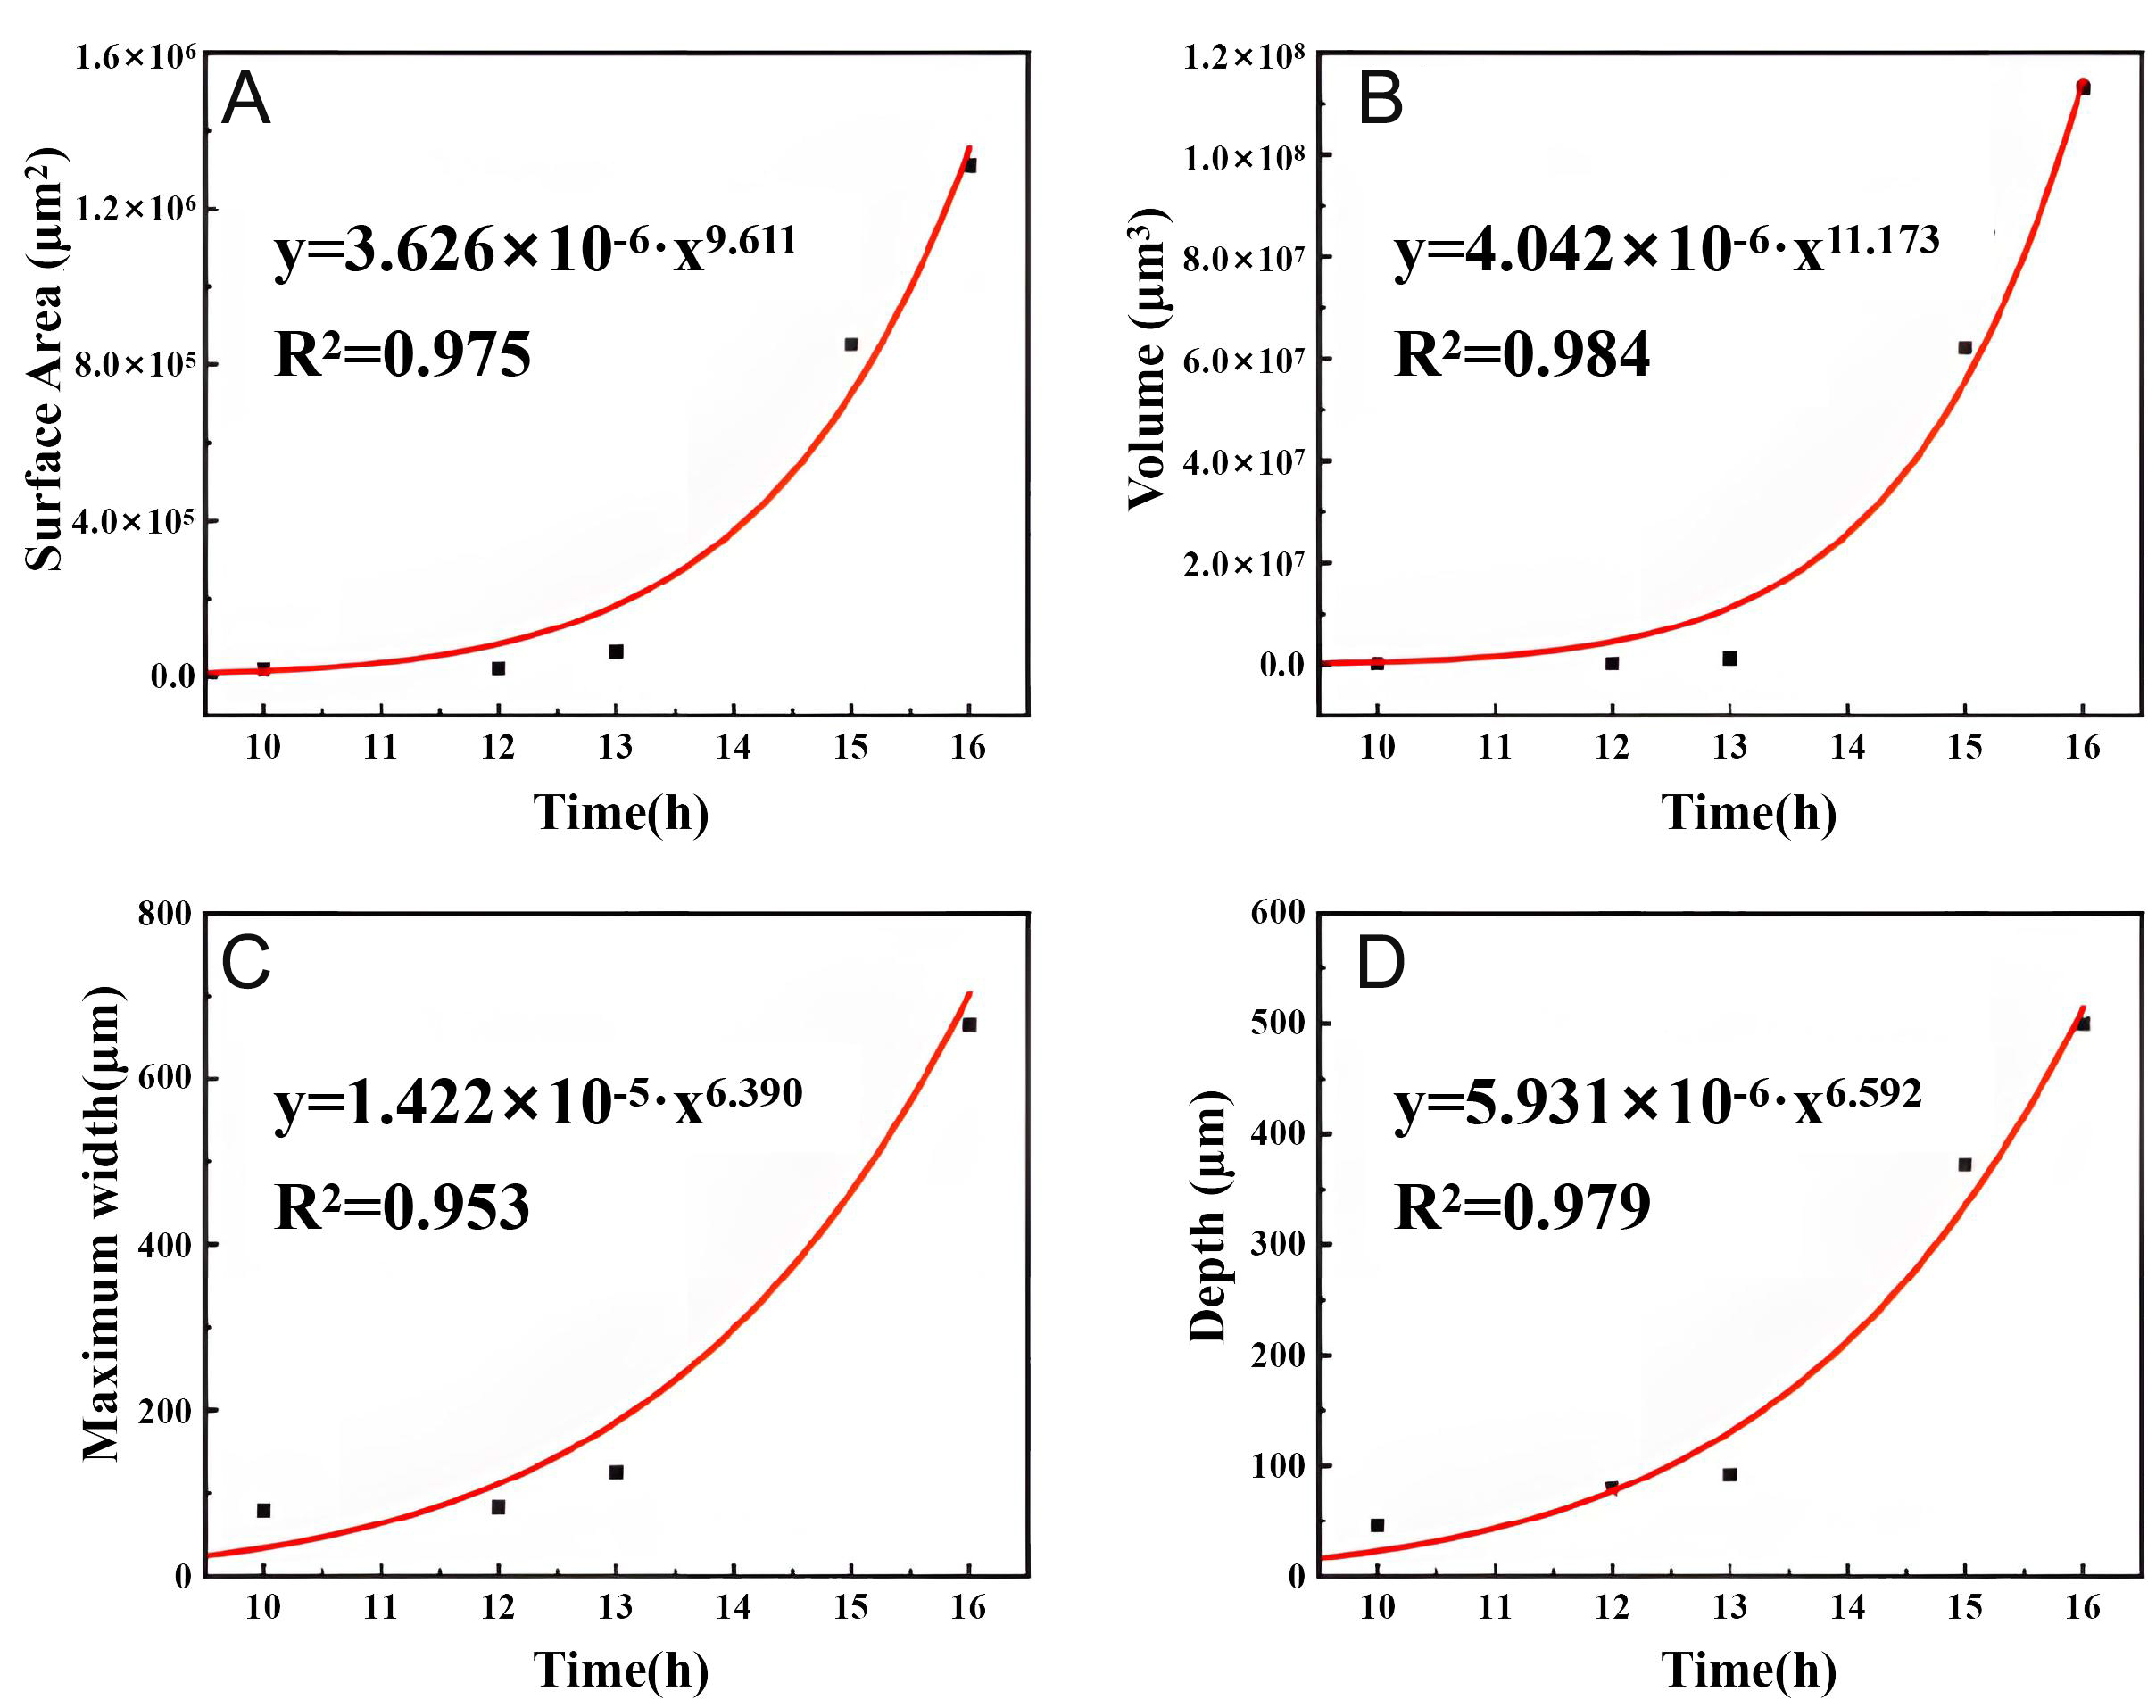
Figure 14. Curve fitting of 3D pit feature parameters for Inconel 690 alloy immersed in 6% FeCl3 + 0.16% HCl solution at 70 °C (A) Surface area, (B) Volume, (C) Maximum width, and (D) depth vs. time for immersion duration of 10-16 h.
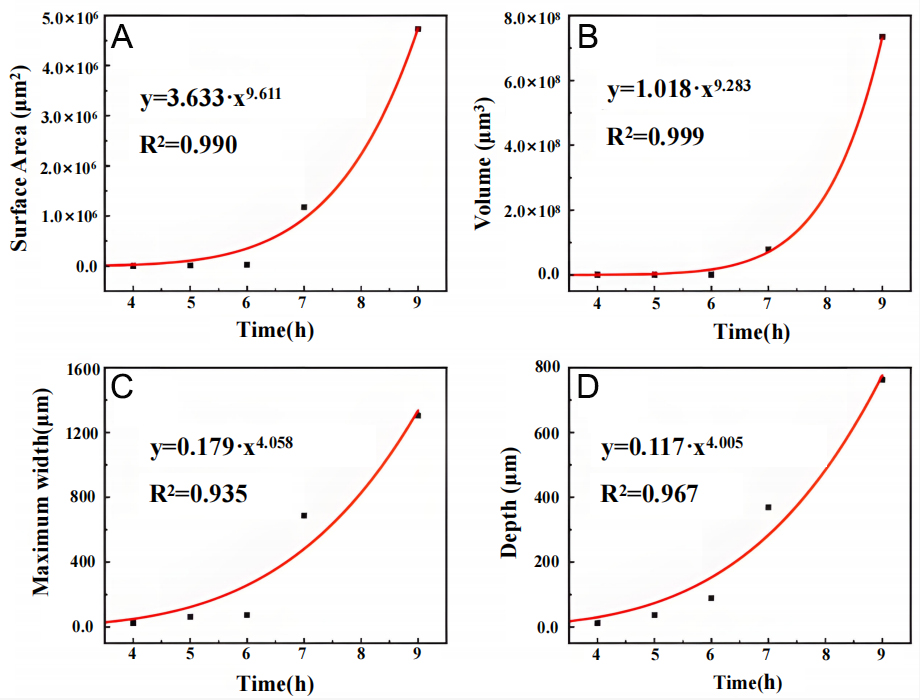
Figure 15. Curve fitting of 3D pit feature parameters for Inconel 690 alloy immersed in 6% FeCl3 + 0.16% HCl solution at 90 °C (A) Surface area, (B) Volume, (C) Maximum width, and (D) depth vs. time for immersion duration of 4-9 h.
At 70 °C, all parameters increased progressively with immersion time. Before 13 h, however, growth was relatively slow, corresponding to the stage prior to lacy cover formation. During this stage, depth growth had limited impact on pit volume and surface area. For example, from 10-12 h, pit depth nearly doubled (from 45.5-79 μm, +74%), while width increased modestly (from 69.76-83.16 μm, +20%). In contrast, volume and surface area increased only slightly (from 2.20 × 10⁵-2.41 × 105 μm3 +10%; from 2.00 × 10⁴-2.02 × 104 μm2, +1%, respectively). Once width expansion was considered, a more pronounced increase in pit volume and surface area was observed. Between 12 and 13 h, depth increased by 23% (from 79-91.7 μm), while width increased by 80% (from 69.76-125.49 μm), driving a fourfold increase in pit volume (from 2.41 × 10⁵-1.20 × 106 μm3) and a 168% increase in surface area (from 2.41 × 104 μm2 to 6.45 × 104 μm2).
Following the appearance of the lacy cover, pit growth accelerated sharply. Between 13 and 16 h, both volume and surface area increased exponentially, with a clear inflection between 13 and 15 h, as shown in Figure 14. The emergence of the lacy cover therefore marked a critical transition in pit growth dynamics.
According to the corrosion evaluation standards ASTM G46-2021 and GB 18590-2001, the maximum pit depth (D) as a function of time (t) can be expressed by a power-law relationship:
where K is a proportional factor reflecting material, surface, and environmental conditions, and β is the pitting index, also dependent on the material and environment. When the 70 °C data were fitted to this model, not only depth but also surface area, volume, and maximum width were well described, with R2 values of 0.979, 0.975, 0.984, and 0.953, respectively, as shown as red curves in Figure 14.
At 90 °C, the overall growth patterns were similar, but higher temperature markedly accelerated pit evolution. Before the lacy cover appeared, pit growth remained relatively slow, with a distinct turning point observed at approximately 6 h [Figure 15], which is characteristic of early-stage pitting behavior reported in the literature[49]. From 4-5 h, pit width increased from 23.01-60.81 μm (+164%) and depth from
Once the lacy cover formed, pit growth entered a rapid expansion phase. From 6-7 h, surface area increased explosively from 2.09 × 10⁴-1.18 × 106 μm2 (+5,646%), and volume from 2.45 × 10⁵-7.80 × 107 μm3 (+31,837%). Maximum width increased from 73.66-686.16 μm (+832%), while depth grew from 88.04-369.24 μm (319%). Although both width and depth expanded dramatically, the lateral growth rate was markedly higher than the vertical growth rate, which is consistent with the accelerated pit propagation and lateral spreading behavior associated with passive film degradation reported in the literature[50]. With prolonged immersion, the lacy cover degraded, and the disparity between lateral and vertical growth gradually diminished.
Power-law fitting of the 90 °C data also yielded excellent agreement, with R2 values of 0.990 (surface area), 0.999 (volume), 0.935 (maximum width), and 0.967 (depth) as shown as red curves in Figure 15.
Together, the two datasets demonstrate that surface area, volume, maximum width, and maximum depth can all be reliably described by a power-law model. Among these, pit width is the most accessible experimentally. However, surface observations may markedly underestimate true width due to the shielding effect of lacy covers, underscoring the importance of 3D reconstruction for accurate characterization.
Physical interpretation of power-law pit growth behavior
Although the temporal evolution of pit depth has long been described empirically using a power-law relationship in standards such as ASTM G46 and GB 18590, these formulations do not explicitly address the physical origin of such scaling behavior, nor do they explain why multiple geometric parameters may follow similar functional forms. In the present work, the power-law fitting is not intended to serve as a mechanistic corrosion model, but rather as a phenomenological description of pit growth kinetics based on high-fidelity three-dimensional geometric data.
From a physical perspective, the emergence of power-law scaling can be rationalized by the evolution of rate-controlling processes during pit propagation. In the early stage of pit growth, pit geometry is shallow and open, allowing relatively unrestricted exchange of ionic species between the pit interior and the bulk solution. Under these conditions, pit deepening is limited by electrochemical dissolution at the pit bottom, while lateral expansion contributes minimally to volume increase. As the pit deepens, geometric confinement progressively restricts mass transport, leading to the accumulation of aggressive ions (e.g., Cl-) and corrosion products within the pit cavity. This transition introduces diffusion-limited and ohmic resistance effects, which are widely recognized as key factors controlling steady-state pit growth.
The formation of a lacy cover further amplifies this confinement effect by partially shielding the pit interior from the external environment. Once such transport limitations dominate, pit growth becomes governed by coupled electrochemical kinetics and mass transport processes, resulting in non-linear time dependence that can be well approximated by power-law behavior. Under these conditions, different geometric descriptors—such as depth, width, surface area, and volume—are no longer independent but become geometrically correlated through the evolving pit morphology. Consequently, it is reasonable that these parameters exhibit similar temporal scaling trends, despite representing different aspects of pit geometry.
It should be emphasized that the driving force for pit growth in the present study is purely electrochemical in nature, arising from localized anodic dissolution sustained by aggressive chemistry within the pit environment. No external mechanical loading was applied, and stress-assisted mechanisms are therefore beyond the scope of this work. The fitted prefactors and exponents should thus be interpreted as effective parameters reflecting the combined influence of solution chemistry, temperature, and geometric confinement, rather than intrinsic material constants or direct indicators of a single rate-limiting mechanism.
Quantitative characterization of the shielding effect of lacy covers
For lacy covers formed under immersion at 70 and 90 °C, projections were made from the central opening of the cover and from the maximum contour enclosing all perforations onto the interior of the pit, as shown in Figures 16 and 17. In these 3D reconstructions, the green regions represent the projected pit space. Geometric measurements of the projected models were obtained [Tables 2 and 3] and compared with actual pit data, with the comparisons illustrated in Figures 18 and 19.
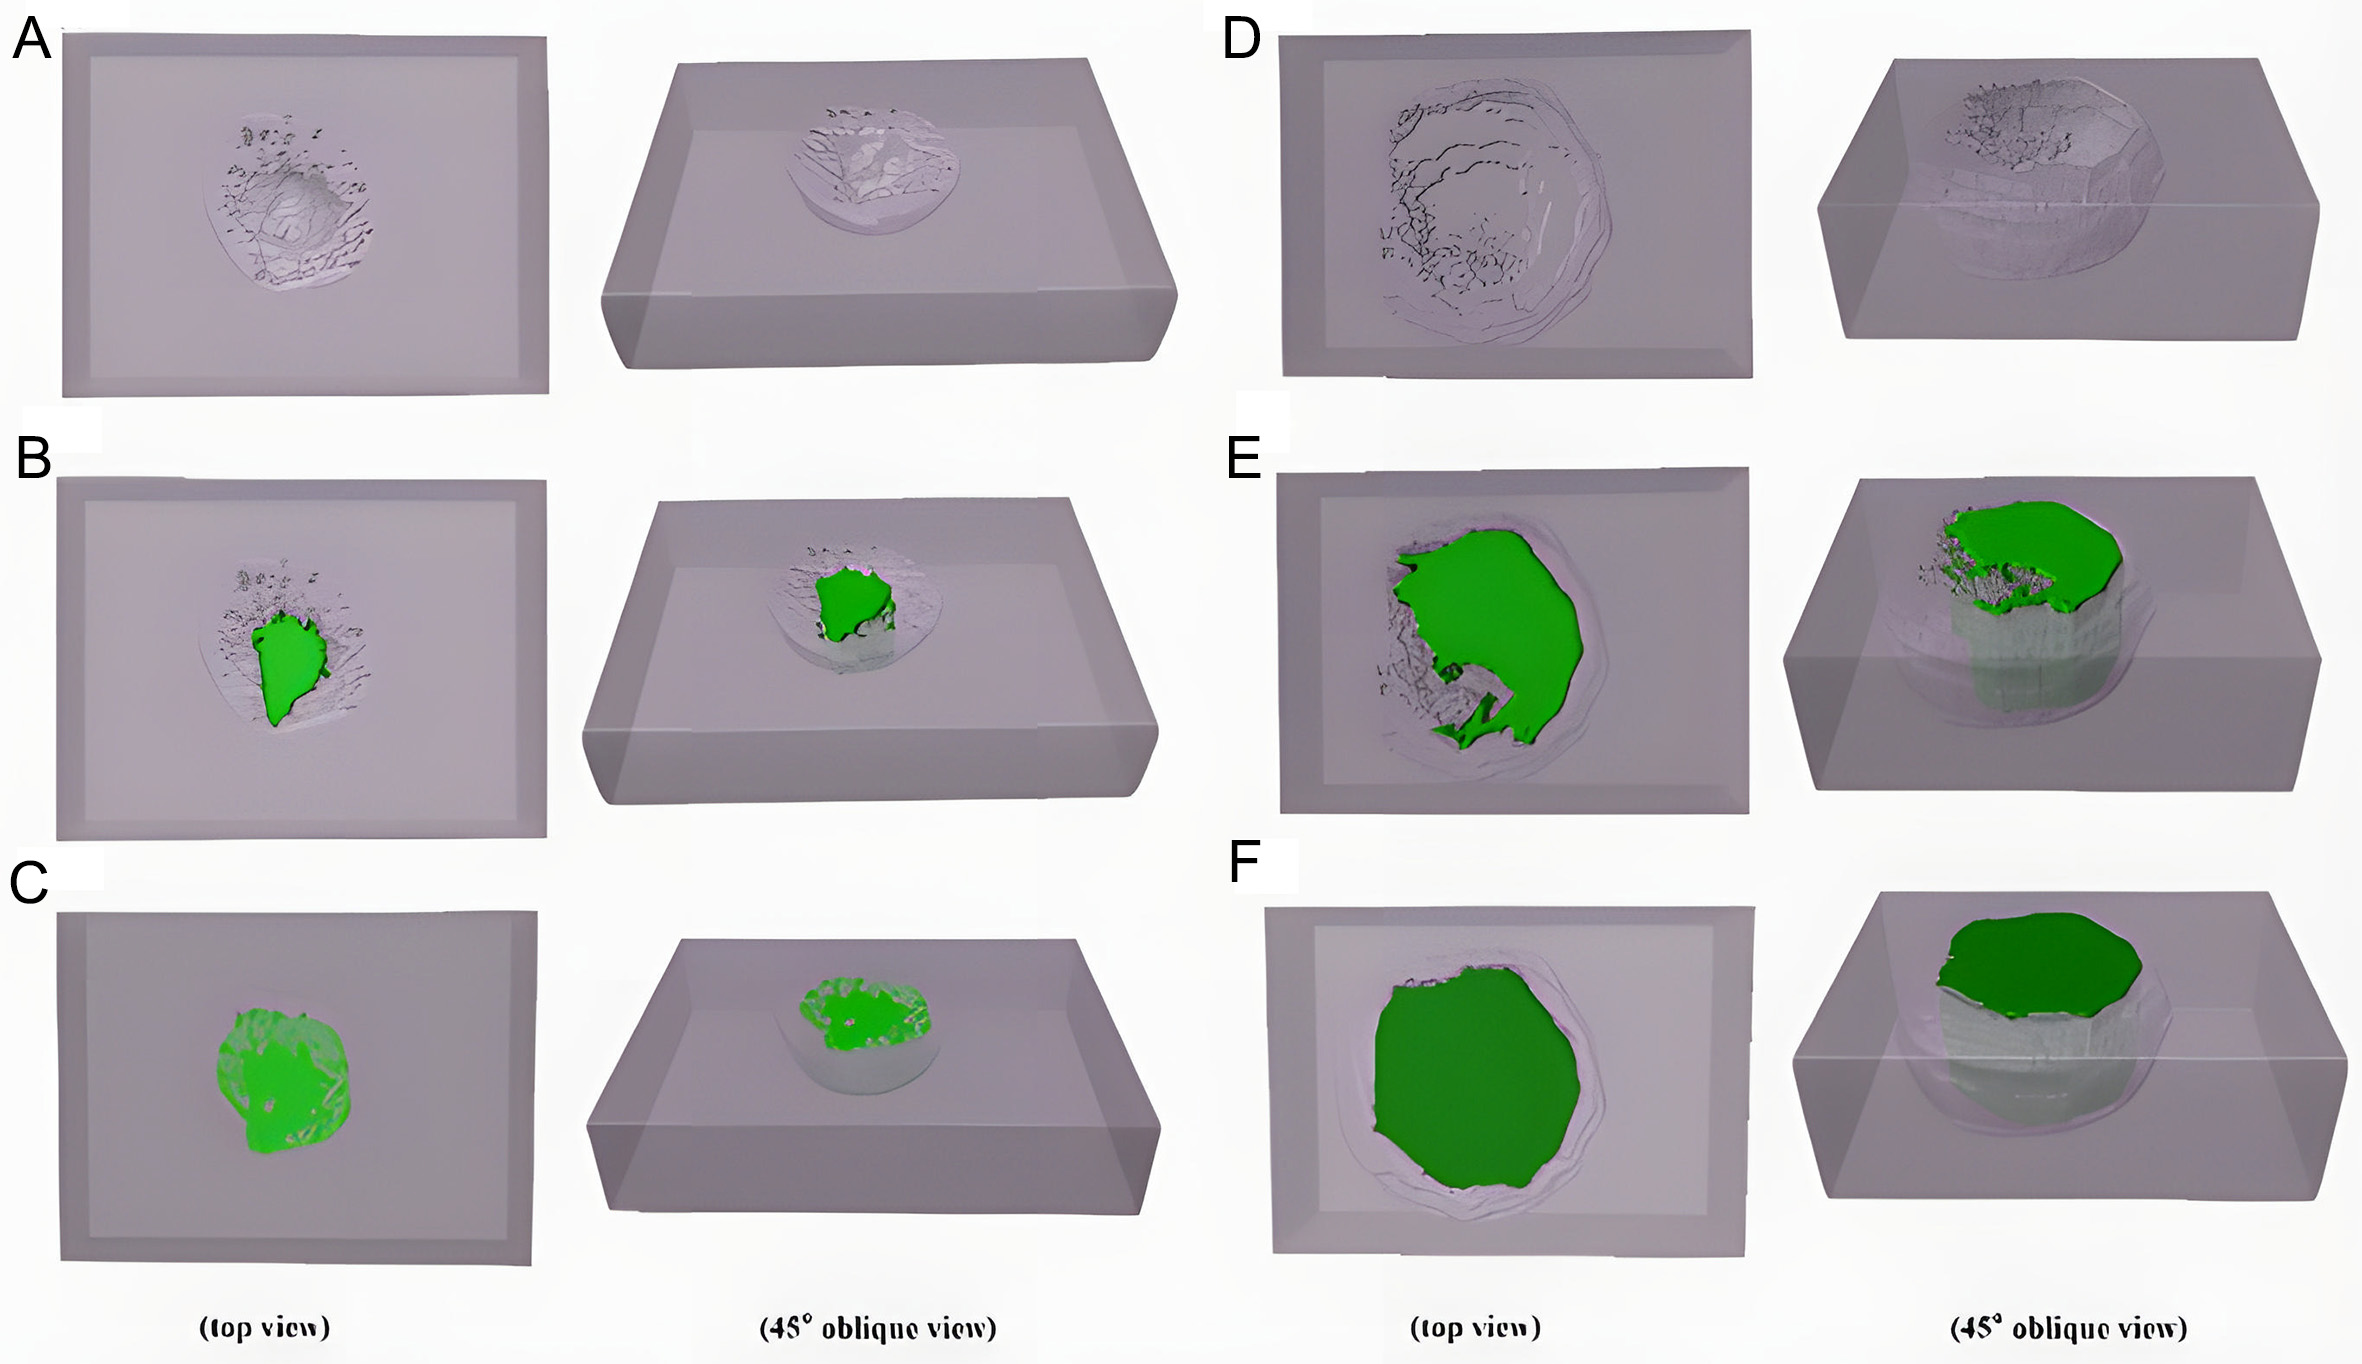
Figure 16. Contour projection of the lacy cover at 70 °C, compared with actual pit morphology. (A) Actual pit after 15 h, (B) Projection of the central opening contour after 15 h, (C) Projection of the maximum contour after 15 h, (D) Actual pit after 16 h, (E) Projection of the central opening contour after 16 h, (F) Projection of the maximum contour after 16 h.
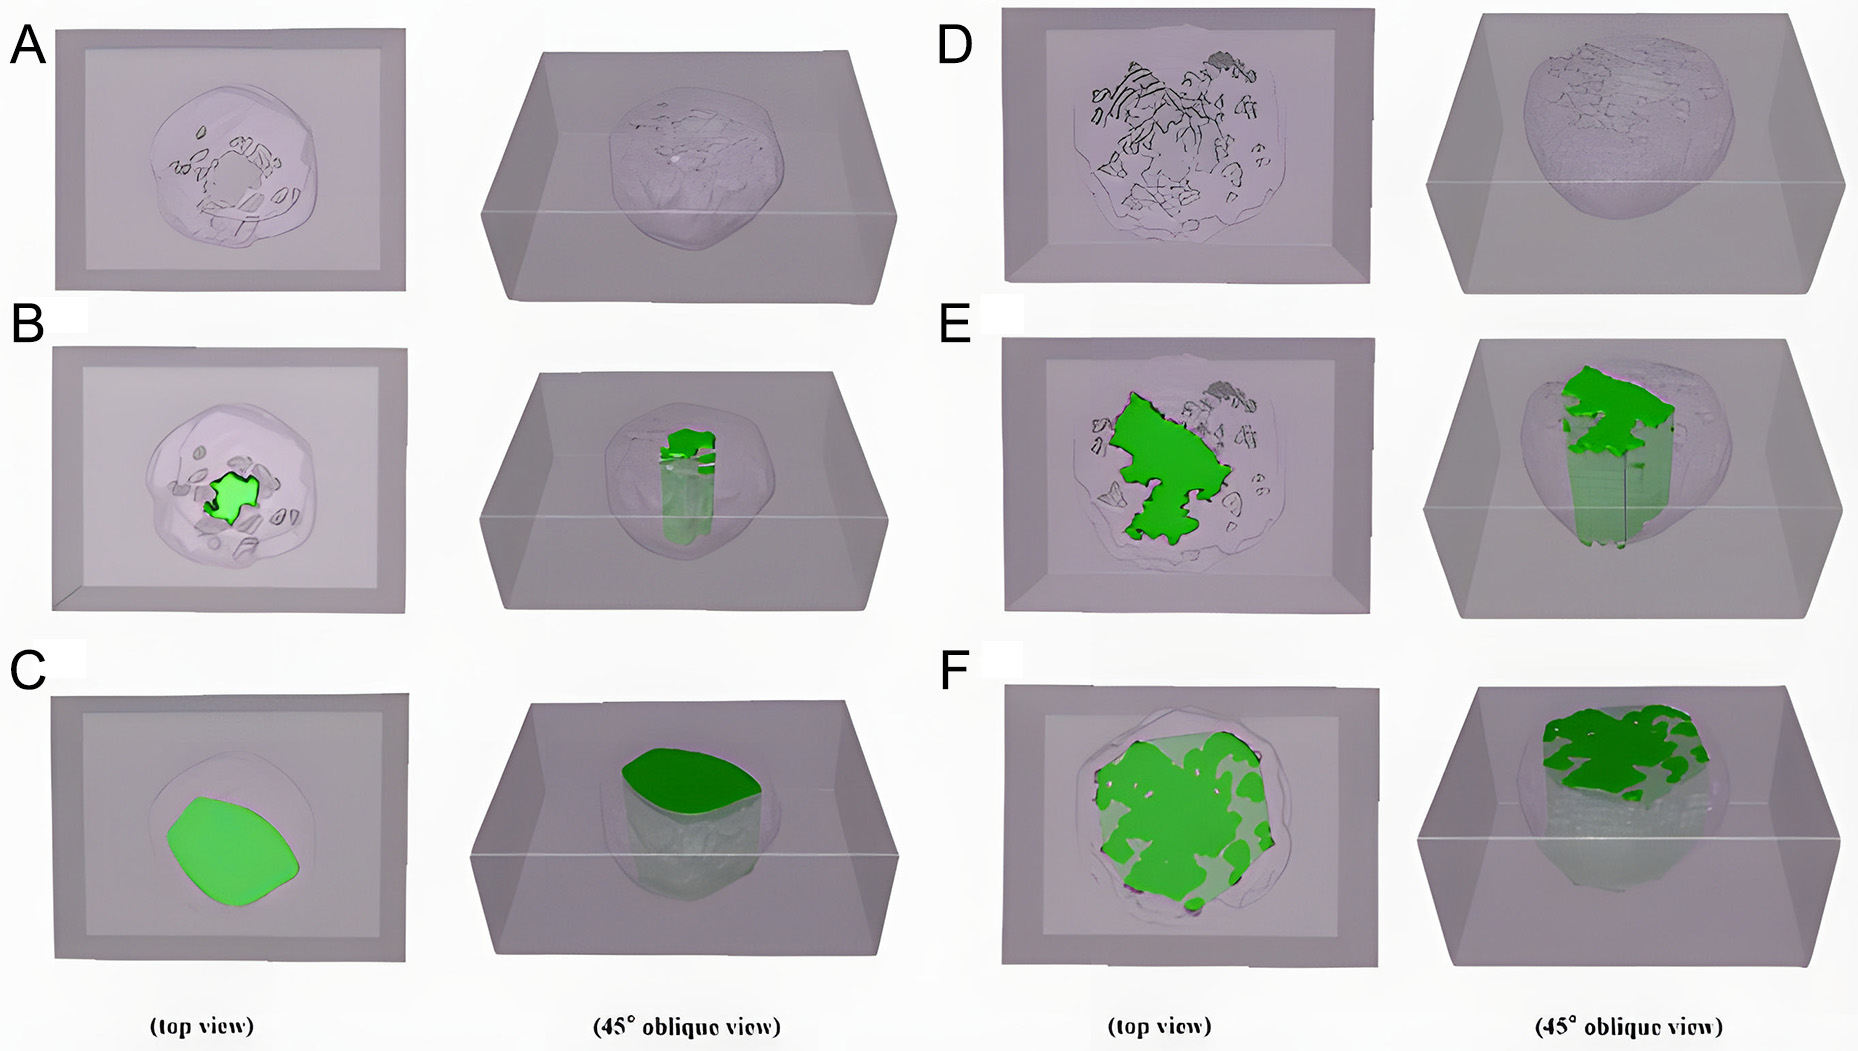
Figure 17. Contour projection of the lacy cover at 90 °C, compared with actual pit morphology. (A) Actual pit after 7 h, (B) Central opening contour projection after 7 h, (C) Maximum contour projection after 7 h, (D) Actual pit after 9 h, (E) Central opening contour projection after 9 h, (F) Maximum contour projection after 9 h.
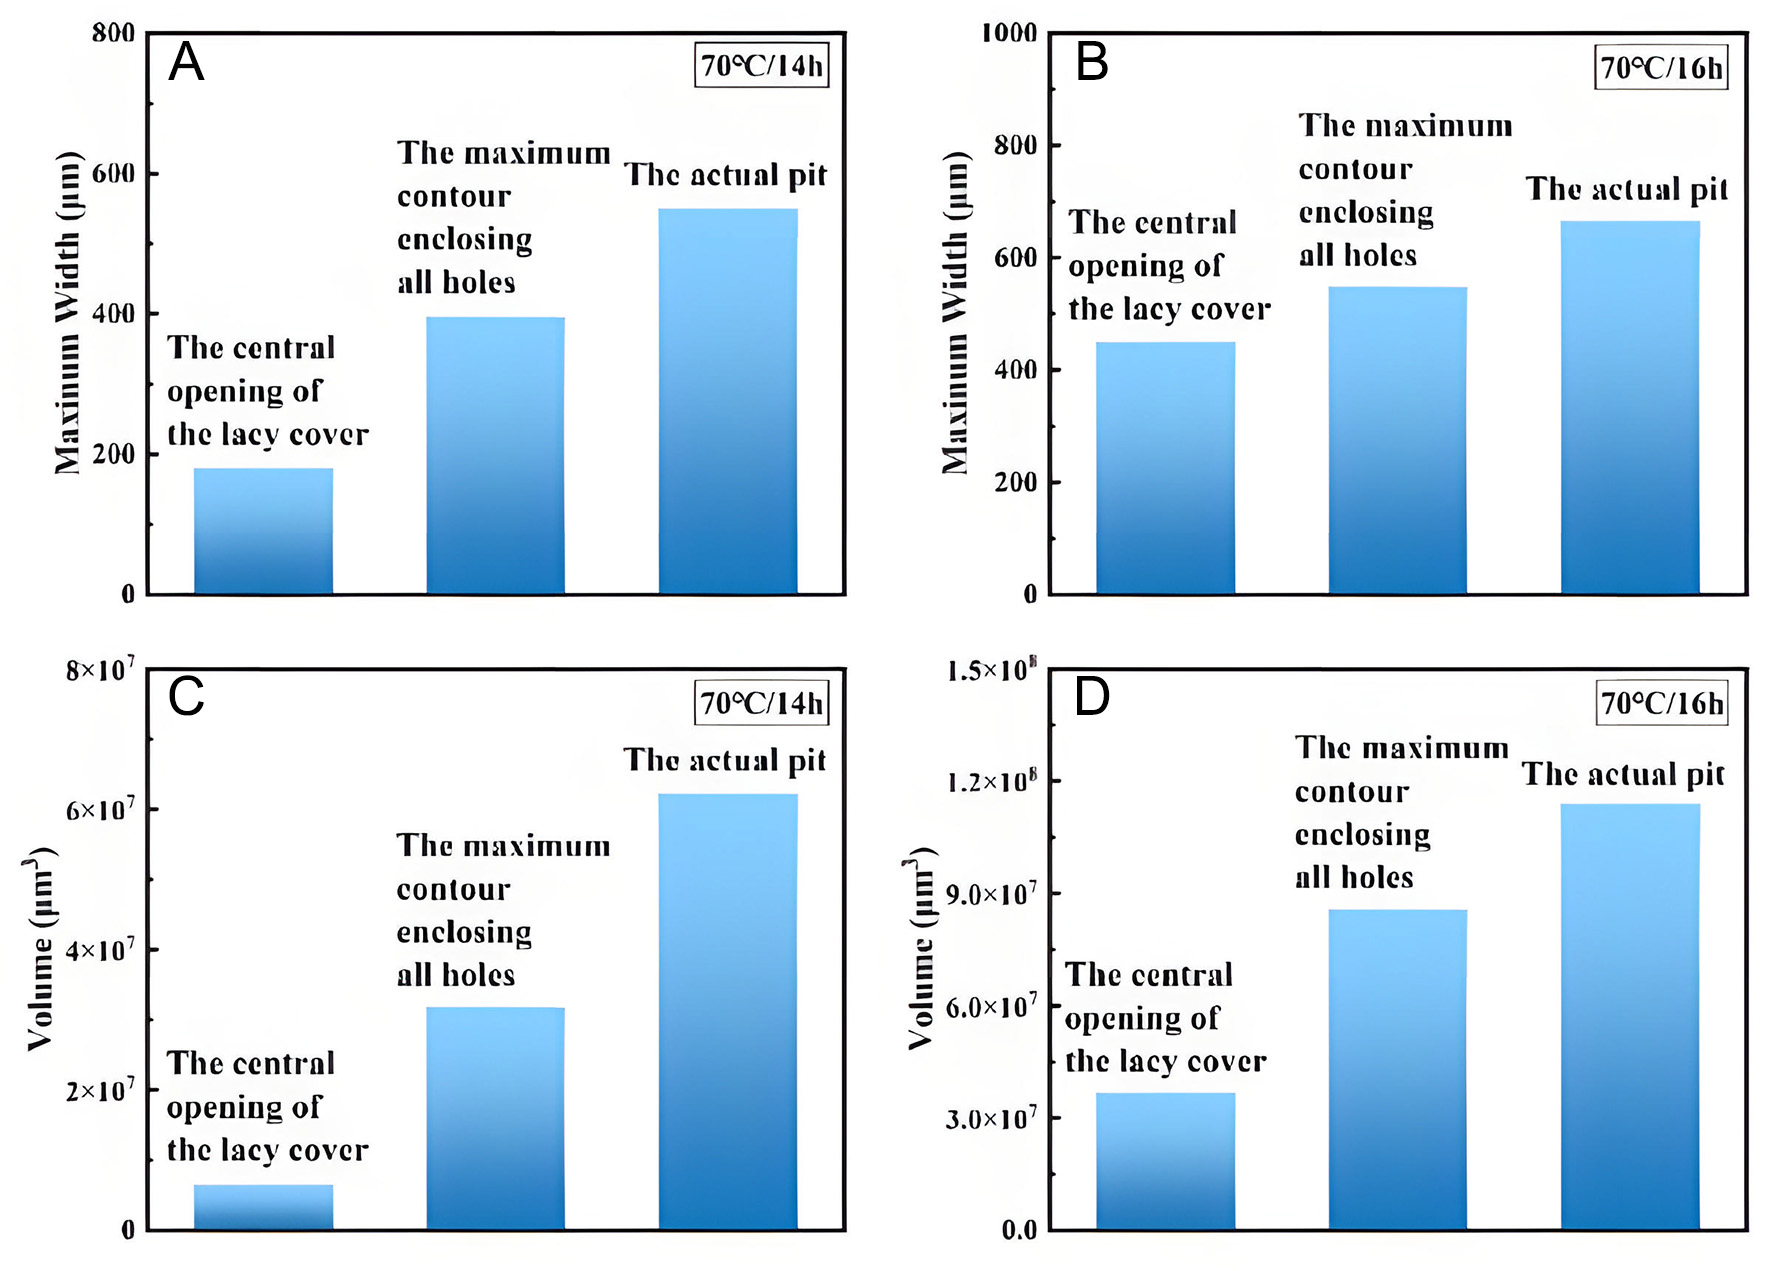
Figure 18. Comparison of projected and actual pit parameters at 70 °C: (A) Comparison of maximum width after 15 h, (B) Comparison of maximum width after 16 h, (C) Comparison of volume after 15 h, (D) Comparison of volume after 16 h.
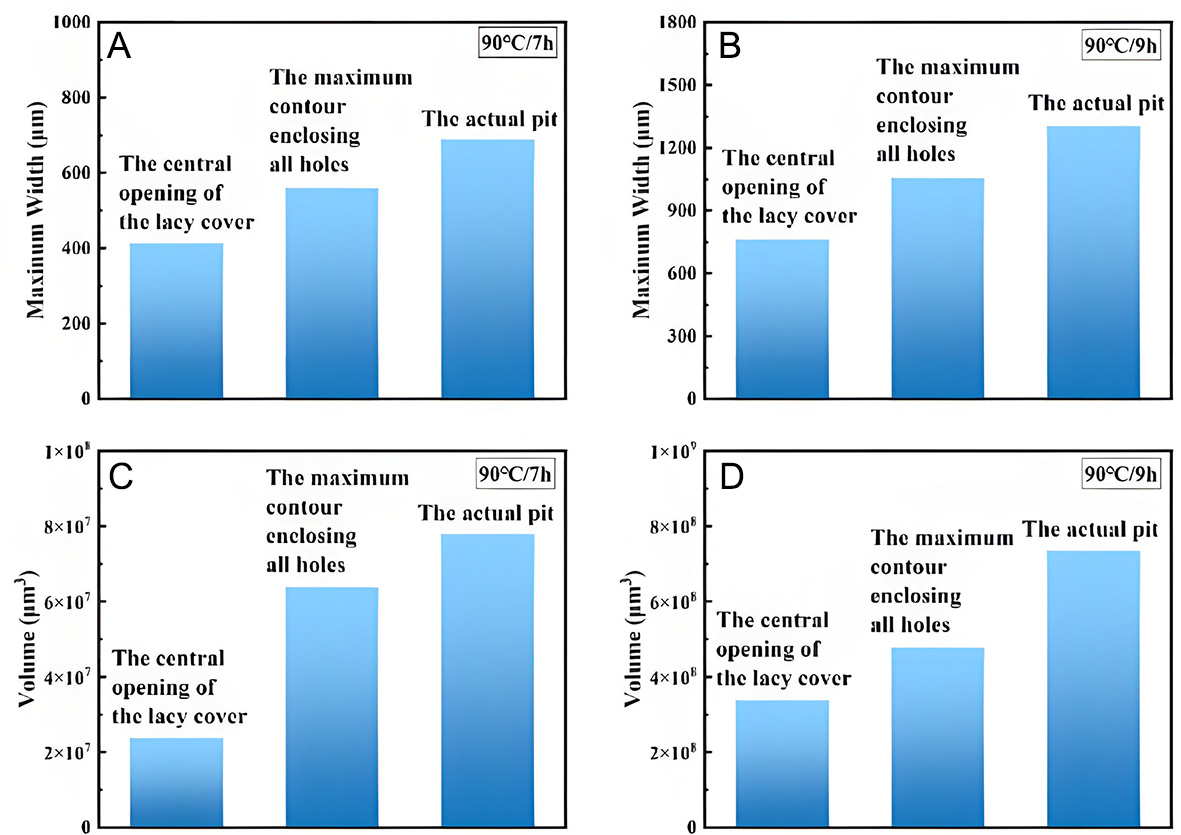
Figure 19. Comparison of projected and actual pit parameters at 90 °C: (A) Comparison of maximum width after 7 h, (B) Comparison of maximum width after 9 h, (C) Comparison of volume after 7 h, (D) Comparison of volume after 9 h.
3D projection data of the lacy cover for pits in Inconel 690 alloy immersed in a 6% FeCl3 + 0.16% HCl solution at 70 °C for 15 h and 16 h
| Time (h) | Measurement method | Volume (μm3) | Maximum width (μm) |
| 15 | The central opening of the lacy cover | 6.43 × 10⁶ | 180.53 |
| 15 | The maximum contour enclosing all holes | 3.18 × 10⁷ | 395.78 |
| 15 | The actual pit | 6.21 × 10⁷ | 550.36 |
| 16 | The central opening of the lacy cover | 3.67 × 10⁷ | 450.86 |
| 16 | The maximum contour enclosing all holes | 8.58 × 10⁷ | 548.43 |
| 16 | The actual pit | 1.13 × 10⁸ | 664.78 |
3D projection data of the lacy cover for pits in Inconel 690 alloy immersed in a 6% FeCl3 + 0.16% HCl solution at 90 °C for 7 and 9 h
| Time (h) | Measurement method | Volume (μm3) | Maximum width (μm) |
| 7 | The central opening of the lacy cover | 2.39 × 10⁷ | 414.00 |
| 7 | The maximum contour enclosing all holes | 6.39 × 10⁷ | 560.54 |
| 7 | The actual pit | 7.80 × 10⁷ | 686.16 |
| 9 | The central opening of the lacy cover | 3.37 × 10⁸ | 762.00 |
| 9 | The maximum contour enclosing all holes | 4.78 × 10⁸ | 1,058.07 |
| 9 | The actual pit | 7.34 × 10⁸ | 1,304.05 |
At 70 °C, the central opening of the early-stage lacy cover was relatively small, as shown in Figure 16B. Once the surrounding micropores became blocked by corrosion products, conventional observation methods could lead to substantial underestimation of pit dimensions. At this point, the projected volume accounted for only 10% of the actual pit volume, while the maximum width represented 33%. Using the maximum contour enclosing all holes provided improved estimates, corresponding to 72% of the actual pit width but only 50% of the actual pit volume, as shown in Figure 16C.
As corrosion progressed, micropores gradually expanded and merged, resulting in a larger central opening. At this stage, the projection from the central opening accounted for 68% of the actual pit width and 32% of the actual pit volume, as shown in Figure 16E. Simultaneously, projection from the maximum contour enclosing all holes corresponded to 82% of the actual pit width and 76% of the volume, as shown in
In summary, newly formed lacy covers exhibit a strong shielding effect, substantially concealing both pit width and volume. Although this effect diminishes as pores expand and coalesce with continued corrosion, it remains non-negligible even in later stages.
When the temperature was increased to 90 °C, the pores became denser, as shown in Figure 17A. The elevated temperature not only accelerated pit growth but also promoted the development of the lacy cover. At 90 °C/7 h, the projection of the central opening of the lacy cover accounted for 60% of the actual maximum pit width and 31% of the actual pit volume, as shown in Figure 17B. The projection of the maximum contour enclosing all holes accounted for 82% of the actual pit width and 82% of the actual pit volume, as shown in Figure 17C. With increasing corrosion time, more pores gradually interconnected, ultimately leading to the collapse of the lacy cover, as shown in Figure 17D. At this stage, the projection of the central opening accounted for 76% of the actual pit width and 46% of the actual pit volume, as shown in Figure 17E, while the projection of the maximum contour enclosing all holes corresponded to 81% of the actual pit width and 65% of the actual pit volume, as shown in Figure 17F. The comparative results of these data are summarized in Figure 19.
As demonstrated by the comparative study in this paper, obtaining full-information data is essential for establishing high-accuracy predictive models. Full-information data provide all the necessary parameters of materials during service, especially for complex corrosion processes where traditional 2D surface data often fail to comprehensively reveal their internal evolution. Therefore, capturing and analyzing 3D data, particularly the 3D morphology and evolution of localized corrosion features like pitting, can substantially improve the precision and reliability of predictive models. However, the challenge in acquiring full-information data lies in the need for extensive material characterization. These characterizations typically require complex experimental procedures, high-precision equipment, and considerable time investment, making the process costly and labor-intensive.
With the ongoing development of smart material characterization technologies and equipment, especially breakthroughs in automation and high-throughput characterization, the acquisition of large amounts of material characterization data has become increasingly easier. Modern fully automated characterization devices not only complete large-scale experimental data collection in a relatively short time but also efficiently process and analyze vast amounts of data, effectively reducing the difficulty of obtaining full-information data. This advancement makes the collection of full-information data more feasible, providing a solid foundation for the precise characterization and performance prediction of materials. By further promoting and applying these technologies, we can more efficiently establish materials service evaluation and life prediction models in the future, driving the further development of digital twin and intelligent technologies.
Microstructural and mechanical considerations in pit growth
In addition to the chemical environment, mechanical loading and microstructural length scales have been widely recognized as important factors influencing pit initiation and propagation, particularly when the characteristic dimensions of corrosion features approach critical microstructural scales. Under coupled mechanical–chemical conditions, local stress concentration at pit mouths or within subsurface regions can enhance localized dissolution, promote pit stabilization, and accelerate damage evolution. Recent studies have demonstrated that externally applied stress or residual stress can markedly alter pit growth kinetics and morphology by modifying the local electrochemical and mechanical fields, especially in small-scale or highly confined corrosion sites[51,52].
It should be emphasized that the present work intentionally focuses on chemically driven pitting corrosion under stress-free conditions, without any externally applied mechanical loading. The primary objective of this study is to resolve the intrinsic three-dimensional geometric evolution of pits and the associated mass-transport confinement effects using high-resolution continuous-sectioning-based reconstruction. Stress-assisted corrosion mechanisms, including mechanically enhanced dissolution and stress concentration–induced pit stabilization, are therefore beyond the scope of the current experimental design. Consequently, the pit growth behavior reported here reflects the combined effects of electrochemical kinetics, solution chemistry, temperature, and geometric confinement, rather than chemo-mechanical coupling.
From a microstructural perspective, the relative scale between pit dimensions and microstructural features plays a critical role in determining the dominant damage mechanisms. When pit size or contact dimensions are comparable to grain size, inclusion spacing, or phase boundary lengths, microstructure-controlled subsurface deformation and strain localization may markedly influence damage evolution, as revealed by recent crystal plasticity and micromechanical modeling studies[53]. In the present study, however, the characteristic pit dimensions during most growth stages are substantially larger than individual microstructural features of the Inconel 690 alloy. As a result, pit evolution is primarily governed by electrochemical dissolution and transport-limited processes, with microstructural effects playing a secondary role.
Nevertheless, the three-dimensional pit morphologies reconstructed in this work provide a realistic geometric basis for future investigations incorporating coupled mechanical loading and microstructural effects. By serving as high-fidelity geometric inputs, these data can be readily integrated into stress-assisted corrosion models or chemo-mechanical simulation frameworks to further explore the interactions among pit growth, local stress fields, and subsurface damage evolution under service-relevant conditions.
Implications of 3D pit datasets for service databases and predictive modeling
The present study repeatedly refers to service evaluation, life prediction, and digital twin applications in the context of pitting corrosion. It is therefore necessary to clarify the intended role and limitations of the reported dataset. The corrosion environment employed in this work (6% FeCl3 + HCl) represents a highly aggressive medium commonly used to accelerate pitting corrosion and promote the formation of well-developed pit morphologies within experimentally accessible timescales. Such conditions are not intended to replicate the exact chemical environment of steam generator tubing in service, but rather to generate representative pit geometries that capture the full three-dimensional evolution of localized corrosion features.
From this perspective, the value of the present dataset lies not in direct life prediction under service conditions, but in providing high-fidelity geometric and morphological information that is typically inaccessible through conventional two-dimensional characterization methods. Parameters such as true pit depth, internal volume, surface area, and the shielding effect of lacy covers constitute essential geometric descriptors that are often missing or underestimated in service databases derived from surface observations alone. These descriptors can serve as critical input variables for corrosion growth models, damage evolution simulations, or digital twin frameworks that require realistic defect geometries.
With regard to uncertainty and statistical variability, it should be noted that the primary objective of this work is to demonstrate a data acquisition and analysis methodology rather than to establish statistically converged lifetime predictions. The number of reconstructed pits and the controlled experimental conditions allow for reliable identification of geometric growth trends and mechanistic transitions, such as the emergence of lacy covers as a turning point in pit growth. A comprehensive statistical treatment across large pit populations, including variability quantification and probabilistic assessment, would require substantially expanded datasets and is therefore beyond the scope of the present study.
Nevertheless, the reconstructed three-dimensional pit data provide a structural foundation that can be readily integrated into predictive modeling workflows. For example, the extracted geometric parameters can be incorporated into semi-empirical pit growth laws, transport-limited corrosion models, or finite-element-based damage simulations as geometry-informed inputs. In the context of digital twin applications, such data contribute to the defect geometry layer, enabling more realistic coupling between corrosion evolution, local environmental conditions, and subsequent mechanical integrity assessments. In this sense, the present work establishes a methodological and data-level basis for future service-oriented modeling, rather than delivering a standalone predictive tool.
Universality of 3D reconstruction for material structure characterization
The three-dimensional reconstruction strategy employed in this study is not limited to the specific material system or corrosion environment investigated here. Its universality originates from the fundamental principle of continuous cross-sectional information acquisition combined with digital reconstruction, which enables access to internal structural information that is inherently inaccessible to conventional two-dimensional characterization techniques.
From a methodological perspective, serial-sectioning-based 3D reconstruction is independent of the underlying damage mechanism or material class. By appropriately adjusting sectioning parameters, imaging modalities, and segmentation strategies, the same reconstruction framework can be applied to a wide range of material structure characterization problems, including localized corrosion, void and crack evolution, additive manufacturing defects, and heterogeneous microstructural features. In all these cases, the key advantage lies in the ability to resolve true three-dimensional geometries rather than relying on surface projections or apparent two-dimensional metrics.
In the context of the present work, pitting corrosion in Inconel 690 serves as a representative example demonstrating how full-field three-dimensional information can be systematically acquired and quantified. While the observed pit morphologies and growth characteristics are specific to the selected material and corrosive environment, the reconstruction workflow—comprising continuous sectioning, image acquisition, digital alignment, and geometric analysis—remains transferable to other material systems and degradation scenarios. The universality of the approach therefore resides in the reconstruction framework itself, rather than in material-specific outcomes.
Consequently, the serial-sectioning-based 3D reconstruction strategy provides a general pathway for obtaining comprehensive, geometry-resolved data suitable for structure–property–damage correlation studies. When combined with appropriate experimental design and data interpretation, this methodology enables consistent extraction of internal structural descriptors across different materials and damage processes, supporting its broad applicability in advanced material characterization.
CONCLUSIONS
This study aims to elucidate the dynamic evolution of pitting corrosion in Inconel 690 alloy through combined surface characterization and three-dimensional reconstruction of pit morphologies.
The results show that pitting corrosion evolves through distinct initiation, metastable growth, and stable growth stages, accompanied by characteristic three-dimensional morphological transitions. In particular, the formation of lacy covers plays a critical role in regulating pit growth by altering pit geometry and growth direction. Quantitative three-dimensional characterization further confirms that key geometric parameters of pit growth can be consistently described by power-law relationships over time.
Overall, this work highlights the importance of three-dimensional reconstruction for capturing the true internal morphology of corrosion pits and provides a framework for geometry-informed analysis of localized corrosion processes, supporting future applications in advanced material characterization and modeling.The methodology presented in this work also demonstrates the potential of serial-sectioning-based three-dimensional reconstruction for quantitative characterization of localized corrosion damage.
DECLARATIONS
Acknowledgements
Quantitative plots and data visualizations were generated using Origin software, which is a legally licensed version purchased by our institution. Three-dimensional reconstruction results and volumetric renderings were produced using Dragonfly (Object Research Systems, ORS) software. The Dragonfly software is used under a valid institutional license held by the University of Science and Technology Beijing. All figures, including the graphical abstract, were created using Microsoft Visio.
Authors’ contributions
Investigation, writing-original draft: Li, X.
Writing-review and editing: Wang, L.
Discussing: Liu, Y.; Su, Y.; Yao, M.
Conception, writing-review and editing, supervision, funding acquisition: Huang, H.
Availability of data and materials
The data supporting the findings of this study are available from the corresponding author upon reasonable request.
AI and AI-assisted tools Statement
Not applicable.
Financial support and sponsorship
This work was supported by the Advanced Materials-National Science and Technology Major Project (Grant: 2025ZD0619400).
Conflicts of interest
All authors declared that there are no conflicts of interest.
Ethical approval and consent to participate
Not applicable.
Consent for publication
Not applicable.
Copyright
© The Author(s) 2026.
REFERENCES
1. Brynk, T.; Perosanz Lopez, F. J.; Mclennan, A. Increase of nuclear installations safety by better understanding of materials performance and new testing techniques development (MEACTOS, INCEFA-SCALE, and FRACTESUS H2020 projects). EPJ. Nucl. Sci. Technol. 2022, 8, 42.
2. Kim, Y.; Choi, K.; Cho, S.; et al. Second ATLAS domestic standard problem (DSP-02) for a code assessment. Nucl. Eng. Technol. 2013, 45, 871-94.
3. Kang, K.; Park, Y.; Bae, B.; Kim, J.; Choi, N.; Choi, K. Code assessment of ATLAS integral effect test simulating main steam-line break accident of an advanced pressurized water reactor. J. Nucl. Sci. Technol. 2017, 55, 104-12.
4. Park, Y.; Kim, J.; Bae, B. U.; et al. Open calculation result of DSP-05 activity utilizing ATLAS test facility with multiple steam generator tube rupture under PAFS operation scenario. In: Transactions of the Korean Nuclear Society Virtual Spring Meeting, July 9-10, 2020. Available from: https://www.kns.org/files/pre_paper/43/20S-234-%EB%B0%95%EC%9C%A0%EC%84%A0.pdf [Last accessed on 22 Apr 2026].
5. Malet, J.; Porcheron, E.; Vendel, J. OECD international standard problem ISP-47 on containment thermal-hydraulics-conclusions of the TOSQAN part. Nucl. Eng. Des. 2010, 240, 3209-20.
6. Ganesan, A.; Springer, R.; Howell, A.; Burns, B.; Hall, D. M. High-resolution X-ray computerized tomography to characterize localized corrosion rates of carbon steel in contaminated steam cycles. NPJ. Mater. Degrad. 2025, 9, 8.
7. van Gaalen, K.; Gremse, F.; Benn, F.; McHugh, P. E.; Kopp, A.; Vaughan, T. J. Automated ex-situ detection of pitting corrosion and its effect on the mechanical integrity of rare earth magnesium alloy - WE43. Bioact. Mater. 2022, 8, 545-58.
8. Eguchi, K.; Burnett, T. L.; Engelberg, D. L. X-Ray tomographic characterisation of pitting corrosion in lean duplex stainless steel. Corros. Sci. 2020, 165, 108406.
9. Phang, J. T. S.; Lim, K. H.; Chiong, R. C. W. A review of three dimensional reconstruction techniques. Multimed. Tools. Appl. 2021, 80, 17879-91.
10. Karimi, P.; Sadeghi, E.; Ålgårdh, J.; et al. Tailored grain morphology via a unique melting strategy in electron beam-powder bed fusion. Mater. Sci. Eng. A. 2021, 824, 141820.
11. Schaffer, M.; Wagner, J.; Schaffer, B.; Schmied, M.; Mulders, H. Automated three-dimensional X-ray analysis using a dual-beam FIB. Ultramicroscopy 2007, 107, 587-97.
12. Singh, S. S.; Loza, J. J.; Merkle, A. P.; Chawla, N. Three dimensional microstructural characterization of nanoscale precipitates in AA7075-T651 by focused ion beam (FIB) tomography. Mater. Charact. 2016, 118, 101-11.
13. Du Plessis, A.; Yadroitsava, I.; Le Roux, S. G.; et al. Prediction of mechanical performance of Ti6Al4V cast alloy based on microCT-based load simulation. J. Alloys. Compd. 2017, 724, 267-74.
14. Li, J.; Lin, B.; Zheng, H.; et al. Study on pitting corrosion behavior and semi in-situ pitting corrosion growth model of 304 L SS with elastic stress in NaCl corrosion environment. Corros. Sci. 2023, 211, 110862.
15. Yamashita, N.; Matsuno, T.; Maeda, D.; Kikuzuki, M.; Yokota, H. Efficient 3D observation of steel microstructure using serial sectioning with precision cutting and on-site etching. Precis. Eng. 2022, 75, 37-45.
16. Ahmed, S.; Girerd, T.; Clare, A. T.; Speidel, A. Electrolyte jet tomography: three-dimensional microstructure mapping with an electrochemical machine tool and an optical microscope. J. Mater. Process. Technol. 2024, 332, 118571.
17. Moschetti, M.; Lemiasheuski, A.; Bajer, E.; et al. Robot‐assisted automated serial‐sectioning and imaging for 3D microstructural investigations. Adv. Eng. Mater. 2025, 28, e202502202.
18. Stubbers, A.; Solano-Castrejon, E.; Swartley, B.; et al. Machine learning assisted serial sectioning to enable rapid 3D crack network reconstruction. Materialia 2026, 45, 102661.
19. Noell, P. J.; Karasz, E.; Schindelholz, E. J.; et al. The evolution of pit morphology and growth kinetics in aluminum during atmospheric corrosion. NPJ. Mater. Degrad. 2023, 7, 12.
20. DelVecchio, E.; Liu, T.; Chang, Y. T.; et al. Metastable cellular structures govern localized corrosion damage development in additive manufactured stainless steel. NPJ. Mater. Degrad. 2024, 8, 45.
21. Blaizot, J.; Chaise, T.; Nélias, D.; Perez, M.; Cazottes, S.; Chaudet, P. Constitutive model for nickel alloy 690 (Inconel 690) at various strain rates and temperatures. Int. J. Plasticity. 2016, 80, 139-53.
22. Kuang, W.; Ma, X.; Meng, F.; Han, E. Recent research progress in stress corrosion crack initiation of Alloy 690 in pressurized water reactor primary water. Rev. Mater. Res. 2025, 1, 100109.
23. Sipilä, K.; Ikäläinen, T.; Lavonen, T.; et al. Corrosion of alloy 690 in simulated steam generator chemistry with boiling-effect of chloride and sulfate impurities. Electrochim. Acta. 2023, 447, 142129.
24. Li, X.; Wang, J.; Han, E.; Ke, W. Corrosion behavior for Alloy 690 and Alloy 800 tubes in simulated primary water. Corros. Sci. 2013, 67, 169-78.
25. Ning, F.; Tan, J.; Zhang, Z.; et al. Crevice corrosion behaviors of Alloy 690 and 405 stainless steel in chloride solutions with different concentrations of thiosulfate. J. Nucl. Mater. 2023, 575, 154226.
26. Akpanyung, K.; Loto, R. Pitting corrosion evaluation: a review. J. Phys. Conf. Ser. 2019, 1378, 022088.
27. Ghahari, M.; Krouse, D.; Laycock, N.; et al. Synchrotron X-ray radiography studies of pitting corrosion of stainless steel: Extraction of pit propagation parameters. Corros. Sci. 2015, 100, 23-35.
28. Li, J.; Hughes, A. E.; Yang, Y. S.; et al. Quantitative 3D characterization for kinetics of corrosion initiation and propagation in additively manufactured austenitic stainless steel (Adv. Sci. 36/2022). Adv. Sci. 2022, 9, 2270231.
29. Wang, M.; Zhong, Y.; Liang, D.; et al. Investigation on pitting corrosion mechanism of the Fe-based amorphous alloy coating by three-dimensional X-ray imaging at micro-scale. J. Mater. Res. Technol. 2023, 26, 6405-18.
30. Zhang, B.; Wang, J.; Wu, B.; et al. Unmasking chloride attack on the passive film of metals. Nat. Commun. 2018, 9, 2559.
31. Soltis, J. Passivity breakdown, pit initiation and propagation of pits in metallic materials - review. Corros. Sci. 2015, 90, 5-22.
32. Zhang, B.; Ma, X. A review - pitting corrosion initiation investigated by TEM. J. Mater. Sci. Technol. 2019, 35, 1455-65.
33. Amatsuka, S.; Nishimoto, M.; Muto, I. Pitting-corrosion inhibition in stainless steel by NaNO3: mechanistic insights on sulfide dissolution, depassivation, and active dissolution. NPJ. Mater. Degrad. 2026, 10, 40.
34. Maier, B.; Frankel, G. S. Pitting corrosion of bare stainless steel 304 under chloride solution droplets. J. Electrochem. Soc. 2010, 157, C302.
35. Becerra Araneda, A. A.; Kappes, M. A.; Rodríguez, M. A.; Carranza, R. M.; Rebak, R. B. Effect of thiosulfate on the pitting corrosion of nickel base alloys in chloride solutions. In Proceedings of the Conference on Effect of Thiosulfate on the Pitting Corrosion of Nickel Base Alloys in Chloride Solutions, New Orleans, LA, USA, 26 March 2017.
36. Jafarzadeh, S.; Chen, Z.; Zhao, J.; Bobaru, F. Pitting, lacy covers, and pit merger in stainless steel: 3D peridynamic models. Corros. Sci. 2019, 150, 17-31.
37. Jafarzadeh, S.; Chen, Z.; Bobaru, F. Computational modeling of pitting corrosion. Corros. Rev. 2019, 37, 419-40.
38. Xi, N.; Sun, Y.; Xiao, L.; Mei, G. Designing parallel adaptive laplacian smoothing for improving tetrahedral mesh quality on the GPU. Appl. Sci. 2021, 11, 5543.
39. Ji, C.; Li, J.; Praster, M.; Rath, B.; Hildebrand, F.; Eschweiler, J. Smoothing the undersampled carpal bone model with small volume and large curvature: a feasibility study. Life 2022, 12, 770.
40. Hou, Y.; Ni, Z.; Li, G. The influence of alloying elements segregation on heterogeneous nucleation of TiN on Al2O3 and its local corrosion resistance. J. Mater. Res. Technol. 2024, 32, 338-46.
41. Chen, Y.; Liu, Y.; Ying, T.; et al. Stainless magnesium alloy based on self-healing amorphous surface. Mater. Today. 2026, 92, 35-43.
42. Ju, J.; Zan, R.; Shen, Z.; et al. Remarkable bioactivity, bio-tribological, antibacterial, and anti-corrosion properties in a Ti-6Al-4V-xCu alloy by laser powder bed fusion for superior biomedical implant applications. Chem. Eng. J. 2023, 471, 144656.
43. Tan, J.; Wu, X.; Han, E.; et al. Role of TiN inclusion on corrosion fatigue behavior of Alloy 690 steam generator tubes in borated and lithiated high temperature water. Corros. Sci. 2014, 88, 349-59.
44. Liu, C.; Revilla, R. I.; Li, X.; et al. New insights into the mechanism of localised corrosion induced by TiN-containing inclusions in high strength low alloy steel. J. Mater. Sci. Technol. 2022, 124, 141-9.
45. Wang, T.; Hua, B.; Liu, X.; et al. Mechanism analysis of pitting induced by Al2O3 inclusions: insight from simulation calculation. J. Iron. Steel. Res. Int. 2024, 32, 1061-72.
46. Zhao, Q.; Lyu, S.; Zhang, G.; Chen, M. Effect of MgO contents on the microstructure, mechanical properties and corrosion behavior of low-alloyed Mg-Zn-Ca alloy. Metals 2024, 14, 274.
47. Trentin, A.; Mardoukhi, A.; Lambai, A.; Pohjanne, P.; Huttunen-saarivirta, E. Pitting corrosion of austenitic and duplex stainless steels in dilute acids at elevated temperature: Effect of electrolyte chemistry and material microstructure. Corros. Sci. 2025, 247, 112769.
48. Ernst, P.; Laycock, N.; Moayed, M.; Newman, R. The mechanism of lacy cover formation in pitting. Corros. Sci. 1997, 39, 1133-6.
49. Vanegas, M.; Wang, K.; Iannuzzi, M. Understanding the effect of applied current and potential on pitting in 316L stainless steels. J. Electrochem. Soc. 2023, 170, 121501.
50. Zhou, Y.; Liu, X.; Zhao, T.; Zheng, C.; Kong, Q.; Zhang, C. Effects of chloride and bromide on passive film degradation and pitting corrosion evolution of lean duplex stainless steel 2001 in coastal infrastructure. Electrochim. Acta. 2025, 540, 147251.
51. Greiner, C.; Liu, Z.; Strassberger, L.; Gumbsch, P. Sequence of stages in the microstructure evolution in copper under mild reciprocating tribological loading. ACS. Appl. Mater. Interfaces. 2016, 8, 15809-19.
52. Ruebeling, F.; Xu, Y.; Richter, G.; Dini, D.; Gumbsch, P.; Greiner, C. Normal load and counter body size influence the initiation of microstructural discontinuities in copper during sliding. ACS. Appl. Mater. Interfaces. 2021, 13, 4750-60.
Cite This Article
How to Cite
Download Citation
Export Citation File:
Type of Import
Tips on Downloading Citation
Citation Manager File Format
Type of Import
Direct Import: When the Direct Import option is selected (the default state), a dialogue box will give you the option to Save or Open the downloaded citation data. Choosing Open will either launch your citation manager or give you a choice of applications with which to use the metadata. The Save option saves the file locally for later use.
Indirect Import: When the Indirect Import option is selected, the metadata is displayed and may be copied and pasted as needed.
About This Article
Copyright

Data & Comments
Data
0


Comments
Comments must be written in English. Spam, offensive content, impersonation, and private information will not be permitted. If any comment is reported and identified as inappropriate content by OAE staff, the comment will be removed without notice. If you have any queries or need any help, please contact us at [email protected].