


fig18
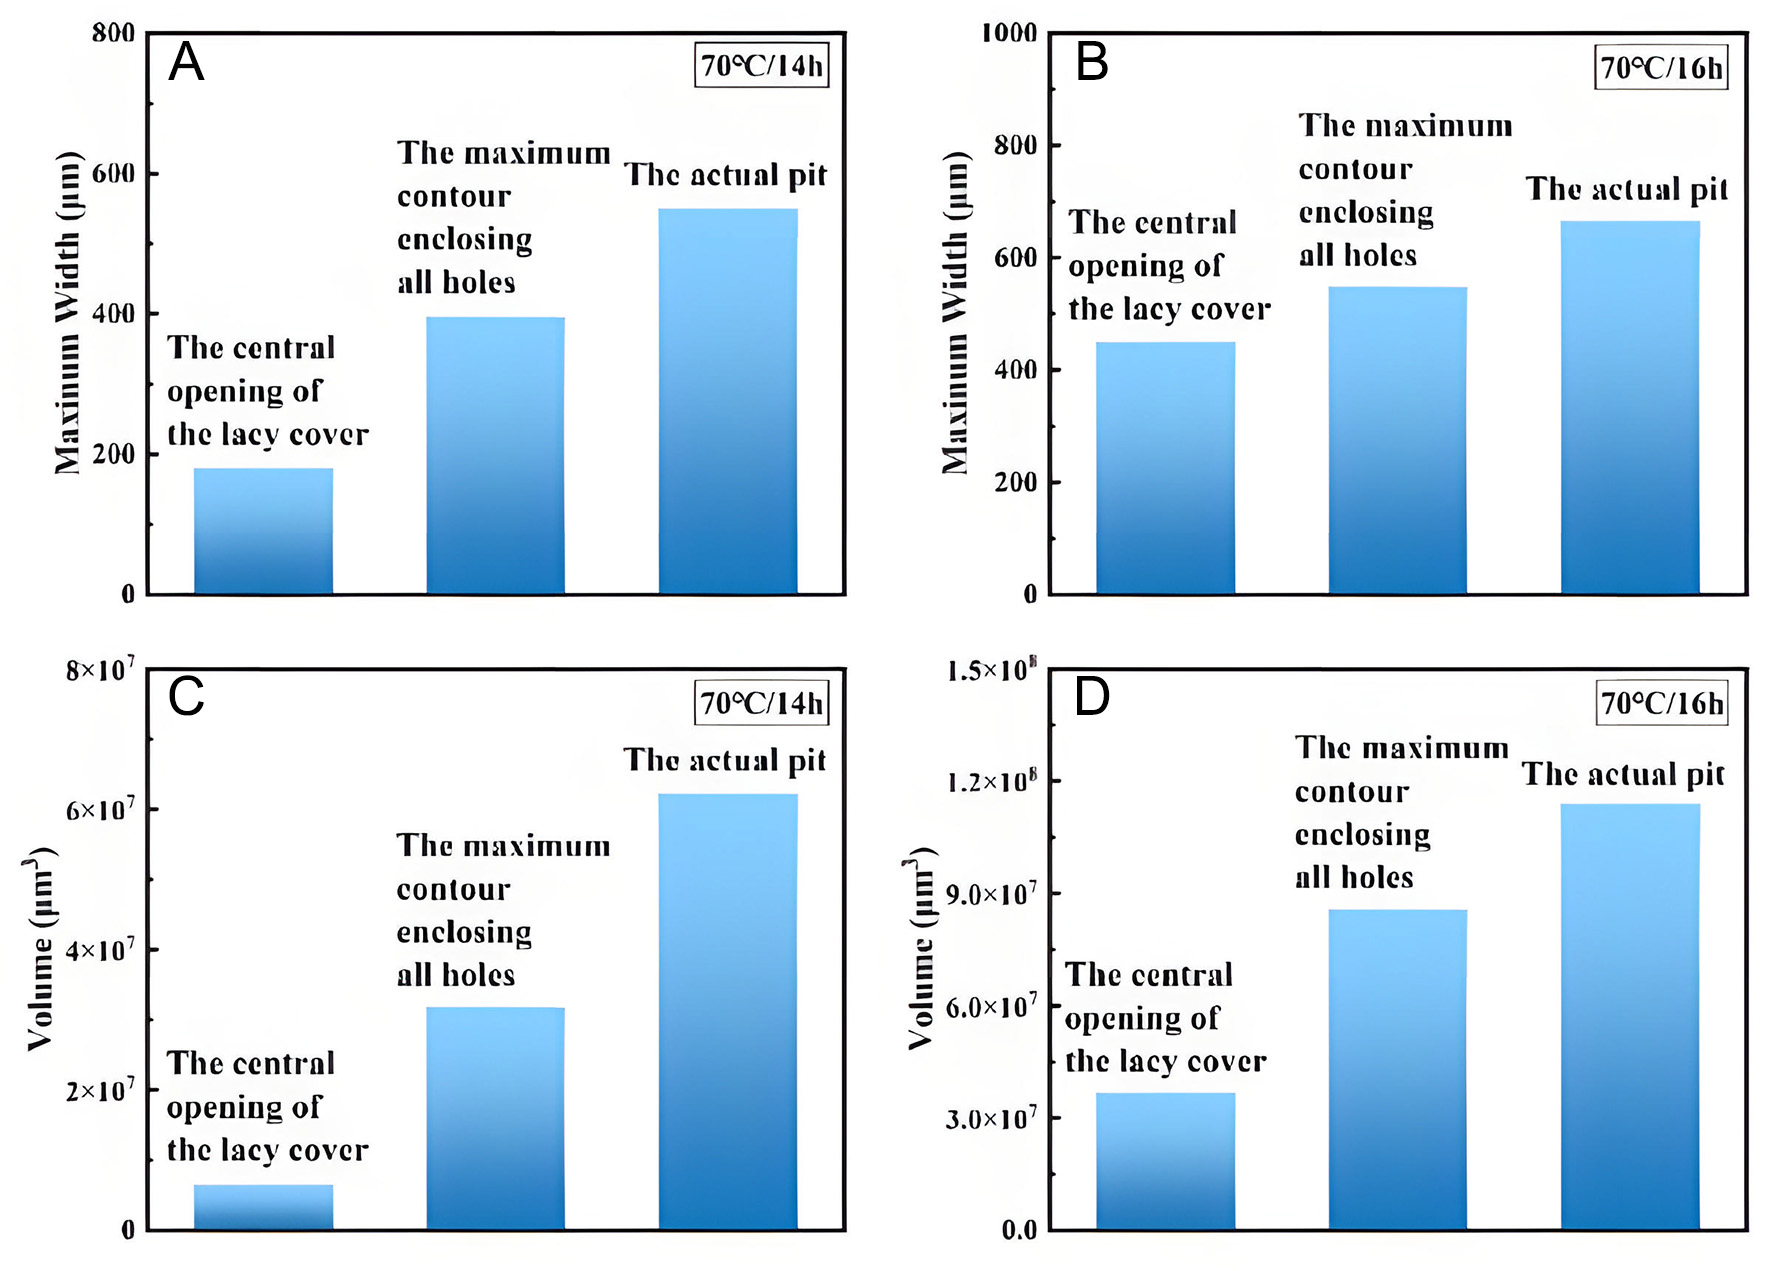
Figure 18. Comparison of projected and actual pit parameters at 70 °C: (A) Comparison of maximum width after 15 h, (B) Comparison of maximum width after 16 h, (C) Comparison of volume after 15 h, (D) Comparison of volume after 16 h.
Figure 18. Comparison of projected and actual pit parameters at 70 °C: (A) Comparison of maximum width after 15 h, (B) Comparison of maximum width after 16 h, (C) Comparison of volume after 15 h, (D) Comparison of volume after 16 h.


All published articles are preserved here permanently:
https://www.portico.org/publishers/oae/


