


fig16
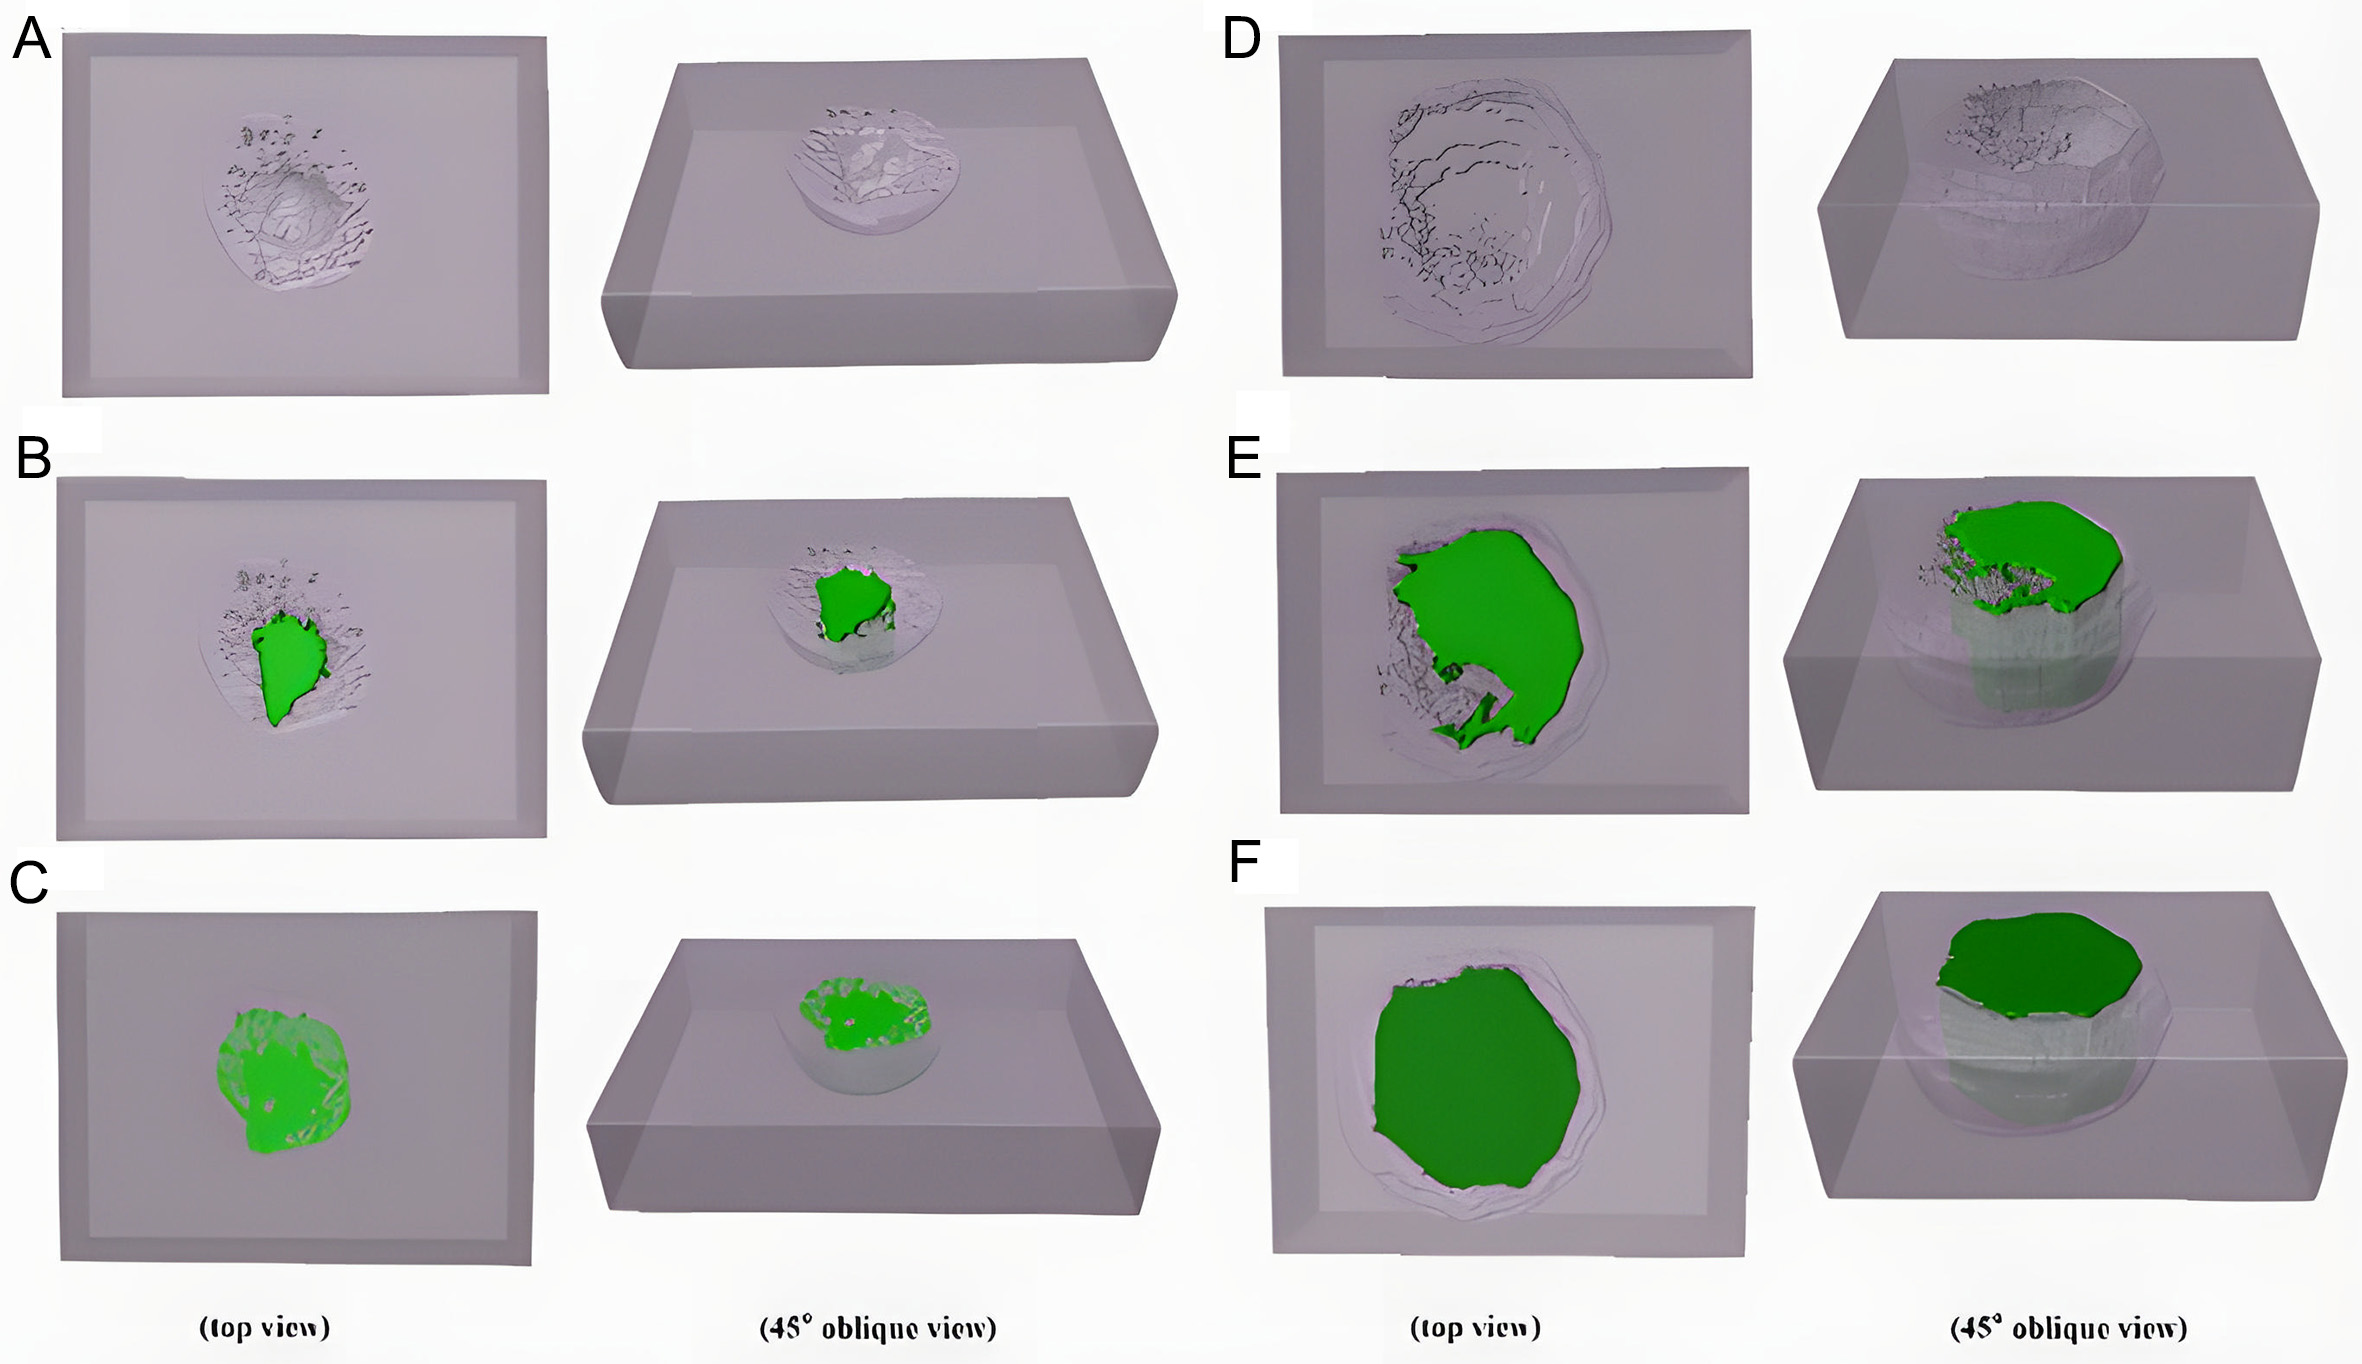
Figure 16. Contour projection of the lacy cover at 70 °C, compared with actual pit morphology. (A) Actual pit after 15 h, (B) Projection of the central opening contour after 15 h, (C) Projection of the maximum contour after 15 h, (D) Actual pit after 16 h, (E) Projection of the central opening contour after 16 h, (F) Projection of the maximum contour after 16 h.


