


fig17
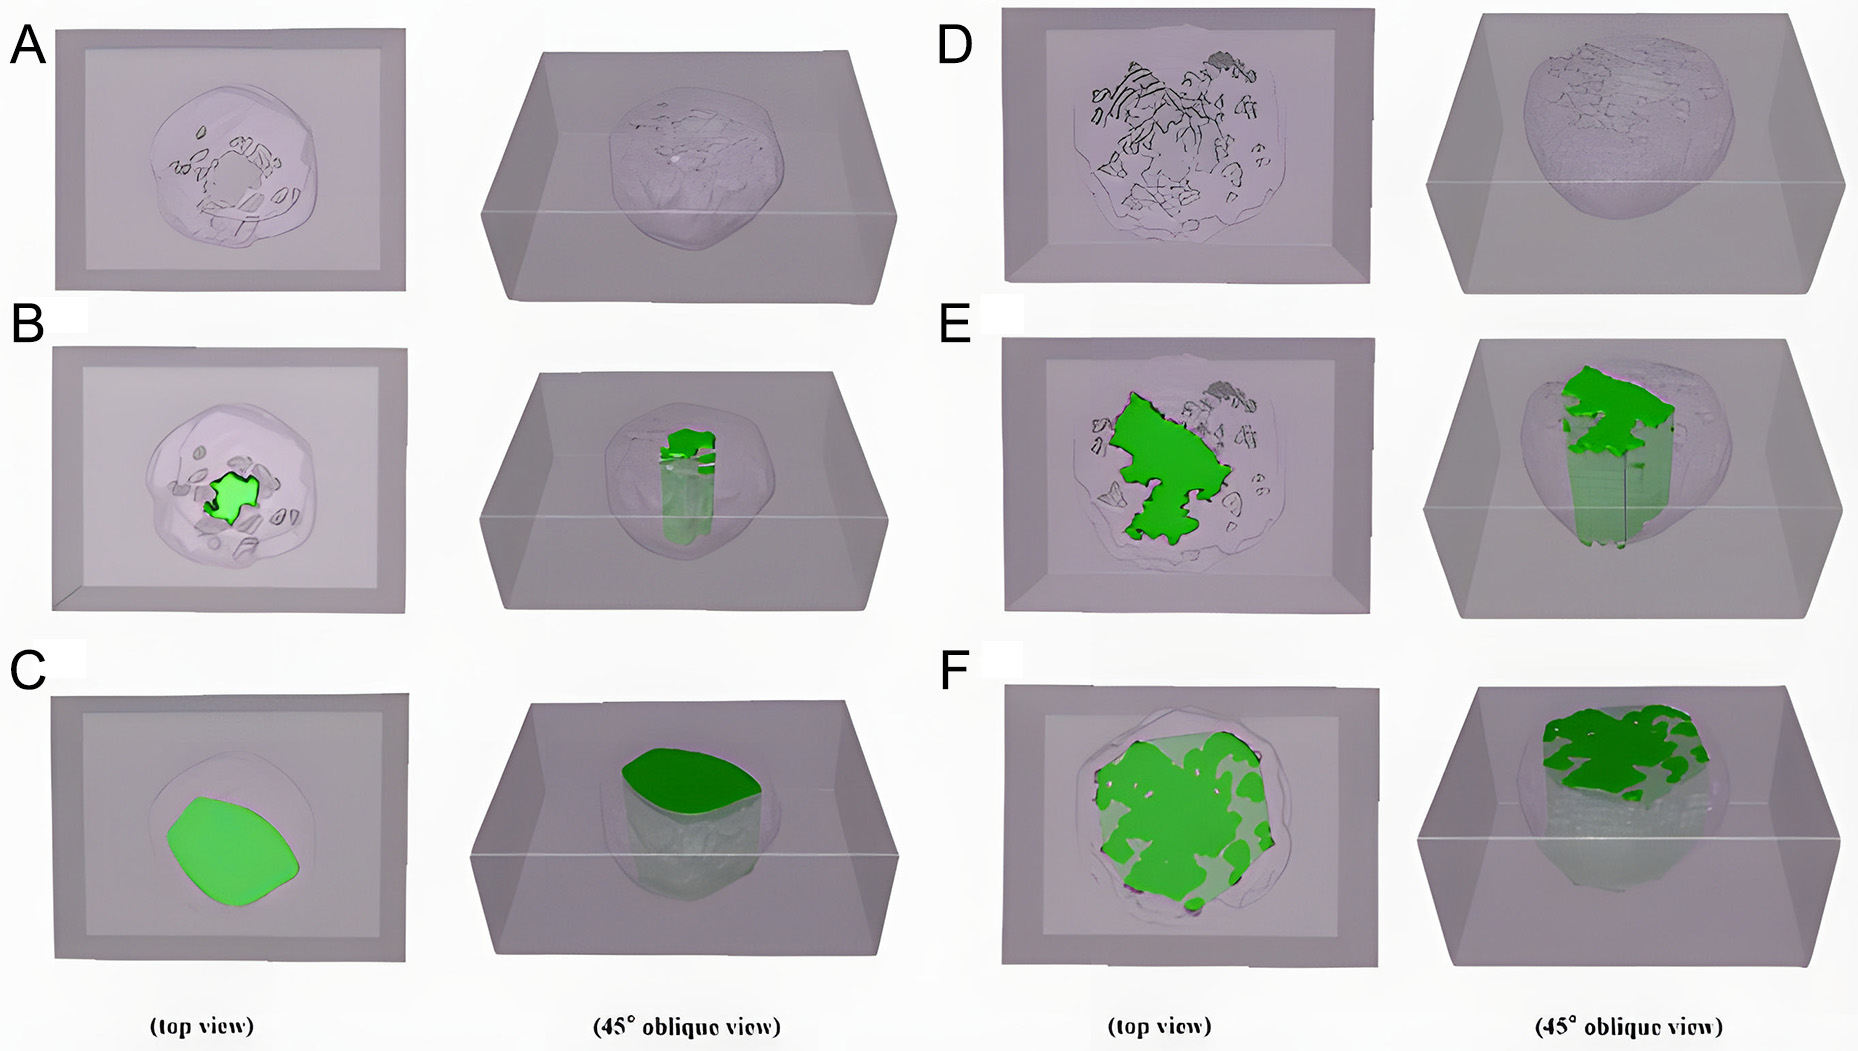
Figure 17. Contour projection of the lacy cover at 90 °C, compared with actual pit morphology. (A) Actual pit after 7 h, (B) Central opening contour projection after 7 h, (C) Maximum contour projection after 7 h, (D) Actual pit after 9 h, (E) Central opening contour projection after 9 h, (F) Maximum contour projection after 9 h.


