


Cuproptosis-related gene-based characterization and diagnostic biomarker screening in gliomas
 0
0 Abstract
Aim: Glioma, the most common primary brain tumor, is known for its poor prognosis, limited treatment success, and high level of aggressiveness. Although cuproptosis-related genes have been linked to outcomes in other cancers, their role in glioma is still not well understood.
Methods: By leveraging the Cancer Genome Atlas (TCGA) and additional databases, we conducted Cox regression and Kaplan-Meier analysis to determine the predictive importance of cuproptosis-related genes in individuals with glioma. By utilizing data from Gene Expression Omnibus (GEO) and other relevant databases, we examined how the expression of cuproptosis-associated genes correlates with immune cell infiltration, immunological checkpoint status, pathological stage, and histological grade. Additionally, we analyzed the connection between gene expression linked to cuproptosis and the prognosis in glioma patients.
Results: Our newly developed cuproptosis-based glioma predictive model demonstrated promising prediction performance. Additionally, we identified glutaminase (GLS) in glioblastoma as a potential novel diagnostic indicator for glioma patients.
Conclusion: GLS holds the potential to provide novel perspectives on cancer management and serve as a valuable diagnostic predictor for glioma patients.
Keywords
INTRODUCTION
Gliomas are classified into World Health Organization (WHO) types I-IV based on standard histopathologic criteria, with glioblastoma (GBM) being the most aggressive subtype[1-3]. While gliomas can exhibit median survival rates of 5-10 years with a combination of surgery, radiation, and chemotherapy, GBMs typically present a median survival of only 1-2 years[4,5]. Current prognostic assessment models for gliomas rely heavily on clinical variables and often lack robust predictive value, highlighting the need for more advanced prognostic tools[6-9].
Over the past few decades, cancer models have become increasingly refined, and treatment options have grown more diversified. From the initial reliance on surgical interventions alone to the current era of therapies targeting oncogenic alterations and associated signaling pathways, gene-targeted approaches will continue to play a vital role in cancer treatment. As recently summarized by NCI experts, the evolution of cancer treatment paradigms has highlighted the urgent need for novel therapeutic targets[10].
Recent studies have linked copper ion carriers to a form of cell death called cuproptosis, emphasizing the significance of copper regulation and mitochondrial roles in various illnesses[11-13]. Copper is essential for various cellular functions, such as autophagy, kinase signaling, redox signaling, and mitochondrial respiration[14-16]. It acts as a structural and catalytic enzyme cofactor and modulates host defense through immunological stimulation[17]. The accumulation of copper ions in mitochondria has been linked to proteotoxic stress and cell death, mainly through cuproptosis[18]. While prognostic models based on cuproptosis have been developed for several malignancies to predict prognosis, immune response, and treatment efficacy, a specific prognostic model for copper-induced cell death in gliomas has not yet been established[19-24]. While pan-cancer analyses of cuproptosis genes using the Cancer Genome Atlas (TCGA) datasets have revealed conserved molecular patterns across malignancies[25,26], their glioma-specific regulatory mechanisms remain unexplored. This knowledge gap prompted our investigation into the role of cuproptosis-related genes (CRGs) in gliomas, aiming to provide novel insights into prognostic prediction for glioma patients.
Our study delves into the expression and clinical significance of CRGs in the tumor microenvironment, immune cell infiltration, glioma prognosis, and different pathological stages and histologies through comprehensive bioinformatics analysis. Using weighted gene co-expression network analysis (WGCNA), we pinpointed glutaminase (GLS) as a possible diagnostic marker for gliomas and examined its prognostic significance and expression trends in these tumors. Our research establishes a foundation for the potential therapeutic targeting of cuproptosis regulators in gliomas, emphasizing the crucial role of CRGs in glioma development.
METHODS
Multiomics data source and preprocessing
We obtained CRG data and clinical information of glioma patients from TCGA database[27]. Gene expression was evaluated by splice tagging and reporting (STAR) as raw read counts and then transformed into transcripts per million (TPM). The GENCODE project (v22) cataloged gene features, including chromosome positions, gene categories, Ensembl IDs, and official symbols[28].
Data on somatic mutations in glioma, obtained through whole exome/genome sequencing (WXS/WGS), were accessed from the GDC TCGA-GBMLGG project on the UCSC Xena server[29]. Using the MuTect2 method[30], more germline mutations were detected, enhancing the confidence in somatic variations. The oncoplot was generated using the R package “maftools”, sorted by decreasing mutation frequency[31].
Digital focal-level copy number variation (CNV) values were calculated by GISTIC2 from tumor aliquots at the item level using a “masked copy number fragment” file, and these values were filtered with a noise threshold of 0.3[32]. The R package “ggpubr” was used to generate a Cleveland dot plot to show the frequency of CNV.
Differential expression analysis and validation
We examined the expression levels of CRGs that varied between tumor and normal samples. To maintain data quality, we systematically addressed missing values and outliers. Initially, we employed the distinct function from the “dplyr” package to eliminate duplicate gene names. Next, the na.omit function is applied to address missing values. We further utilize the normalizeBetweenArrays function from the “limma” package to eliminate batch effects and mitigate interference caused by outliers.
We regarded it as statistically significant if | log2FC | > 1 and P < 0.05 were satisfied. We gathered two datasets (GSE16011[33] and GSE116520[34]) from Gene Expression Omnibus (GEO) containing 326 glioma and peritumoral brain zone samples for validation. Box plots were used using the R package “ggplot2” to compare the expression of CRGs in different datasets.
Gene network and enrichment analysis of CRGs
We used the GENEMANIA website to perform a gene network analysis to explore potential links between these genes[35]. To conduct the enrichment analysis, the R package “clusterProfiler” was used, with references to the Kyoto Encyclopedia of Genes and Genomes (KEGG) and Gene Ontology (GO)[36]. The Benjamini-Hochberg method was employed for multiple corrections, considering a false discovery rate (FDR) of less than 0.05 as significant.
Generate a prognostic signature for CRGs utilizing penalized regression
Using iterative sure independence screening (SIS), we formulated a signature to analyze CRGs at the individual level[37]. We utilized the R package “SIS” to apply SIS and LASSO-penalized Cox regression for identifying CRGs associated with survival[38]. The risk score was calculated using the regression coefficients of the identified prognostic signature of CRGs for overall survival (OS) and progression-free survival (PFS). The patients were categorized into high-risk and low-risk groups according to the median risk score. The Kaplan-Meier survival curve was created using the R package “ggsurvplot” to compare OS or PFS between high-risk and low-risk groups. We additionally estimated the 1-, 3-, and 5-year survival rates using the signature and the nearest neighbor estimation technique[39]. The R package “survivalROC” was used to calculate ROC curves to demonstrate prediction capabilities. Furthermore, we examined possible distinctions between subgroups categorized based on age, gender, and tumor stage. The “regplot” R package was utilized to develop improved regression nomograms for CRG scores and other clinical variables in glioma patients. The “rms” R package was used to evaluate the bias-corrected estimates of predicted versus observed values from the calibration curves of CRG scores and other clinical variables in glioma patients, using 1000 bootstrapping.
Analysis of correlation with immune infiltration
The relationship between the expression of CRGs and the quantity of six immune cells-CD4+ T cells, CD8+ T cells, B cells, neutrophils, dendritic cells, and macrophages-was analyzed using a Tumor Immune Estimation Resource (TIMER)[40]. Furthermore, the expression levels of genes associated with immunological checkpoints are linked to the effectiveness of immune checkpoint inhibitors in treatment. We examined five immune checkpoints: CD276, TLR4, HMGB1, BTN3A1, and TNFSF4[41].
Screening and verification of diagnostic markers
We employed WGCNA[40] to select features for screening diagnostic indicators for gliomas. Following quality verification, the expression matrices of the GSE16011 and GSE116520 data sets were combined into a single, independent data set. Then, a gene co-expression network was created using the R package known as “WGCNA”[42]. The correlation strength between the nodes was then represented by an adjacency matrix, which we converted into a topological overlap matrix. After that, we used hierarchical clustering to find modules (minModuleSize = 30) that contained at least 30 genes. Ultimately, we determined the eigengene, grouped the modules hierarchically, and combined related modules (abline = 0.25). A group of highly comparable genes with high topological overlap make up the co-expression module. There is generally more co-expression among genes belonging to the same module. To determine the important clinical modules, we last computed the correlation between the modules and the clinical data. In the end, we combined the CRGs and WCGNA genes for further analysis, considering a two-tailed P-value below 0.05 as statistically significant.
Genetic alteration analysis
Data on GLS gene mutations and mutation sites in TCGA tumors were assessed using the cBioPortal web server (https://www.cbioportal.org/)[43,44]. Kaplan-Meier plots were utilized to illustrate and compare the differences in OS and disease-free survival (DFS) among patients with and without GLS mutations. The outcome was presented as a logarithmic rank P-value.
The expressions of GLS in glioma patients
The Human Protein Atlas (HPA) site was utilized to evaluate the differences in GLS protein levels between cancerous and healthy tissues[45].
Total RNA was extracted from the tissues using Trizol (Invitrogen, Waltham, MA, USA) following the manufacturer’s instructions. The RevertAid First Strand cDNA Synthesis Kit (K1622) for cDNA reversal was supplied by Thermo Scientific, Waltham, MA, USA. qRT-PCR was performed using the ABI StepOne TM real-time Quantitative PCR machine from Applied Biosystems, located in Waltham, MA, USA. GAPDH served as the internal control for normalizing GLS. The primers used are shown in Table 1. The 2-ΔΔCt values were used to compare the relative expression levels of target genes between the control and experimental groups, with the test conducted in triplicate.
qRT-PCR primers
| Gene | Primer (5’-3’) |
| GLS-forward | TCTACAGGATTGCGAACGTCT |
| GLS-reverse | CTTTGTCTAGCATGACACCATCT |
| GAPDH-forward | GGAAGCTTGTCATCAATGGAAATC |
| GAPDH-reverse | TGATGACCCTTTTGGCTCCC |
The study used glioma and normal tissues taken from Soochow University’s First Affiliated Hospital. All specimens, including normal brain tissue, were obtained from the contused brain tissue of patients undergoing surgery for traumatic brain injury, with the informed consent of the patients or their families. The tumors were categorized by the WHO classification based on histological analysis. After being excised, the tissue samples were frozen in liquid nitrogen and stored at -80 degrees Celsius until further processing. Soochow University’s Clinical Research Ethics Committee approved all investigations.
Statistical analysis
At first, we conducted a descriptive statistical analysis of glioma patients using TCGA. Continuous variables were characterized using the mean ± standard deviation, while categorical data were described using frequency and proportion. A Kruskal-Wallis rank sum test was used to analyze the variation in CRG expression across different pathological stages and histological grades in glioma patients. Variables with a normal distribution were assessed using the t-test, while the Mann-Whitney U test was used for others. For more than two data sets, a one-way analysis of variance was conducted. All statistical analyses were conducted using R version 3.6.3. P values were considered significant if they were less than 0.05, with a
RESULTS
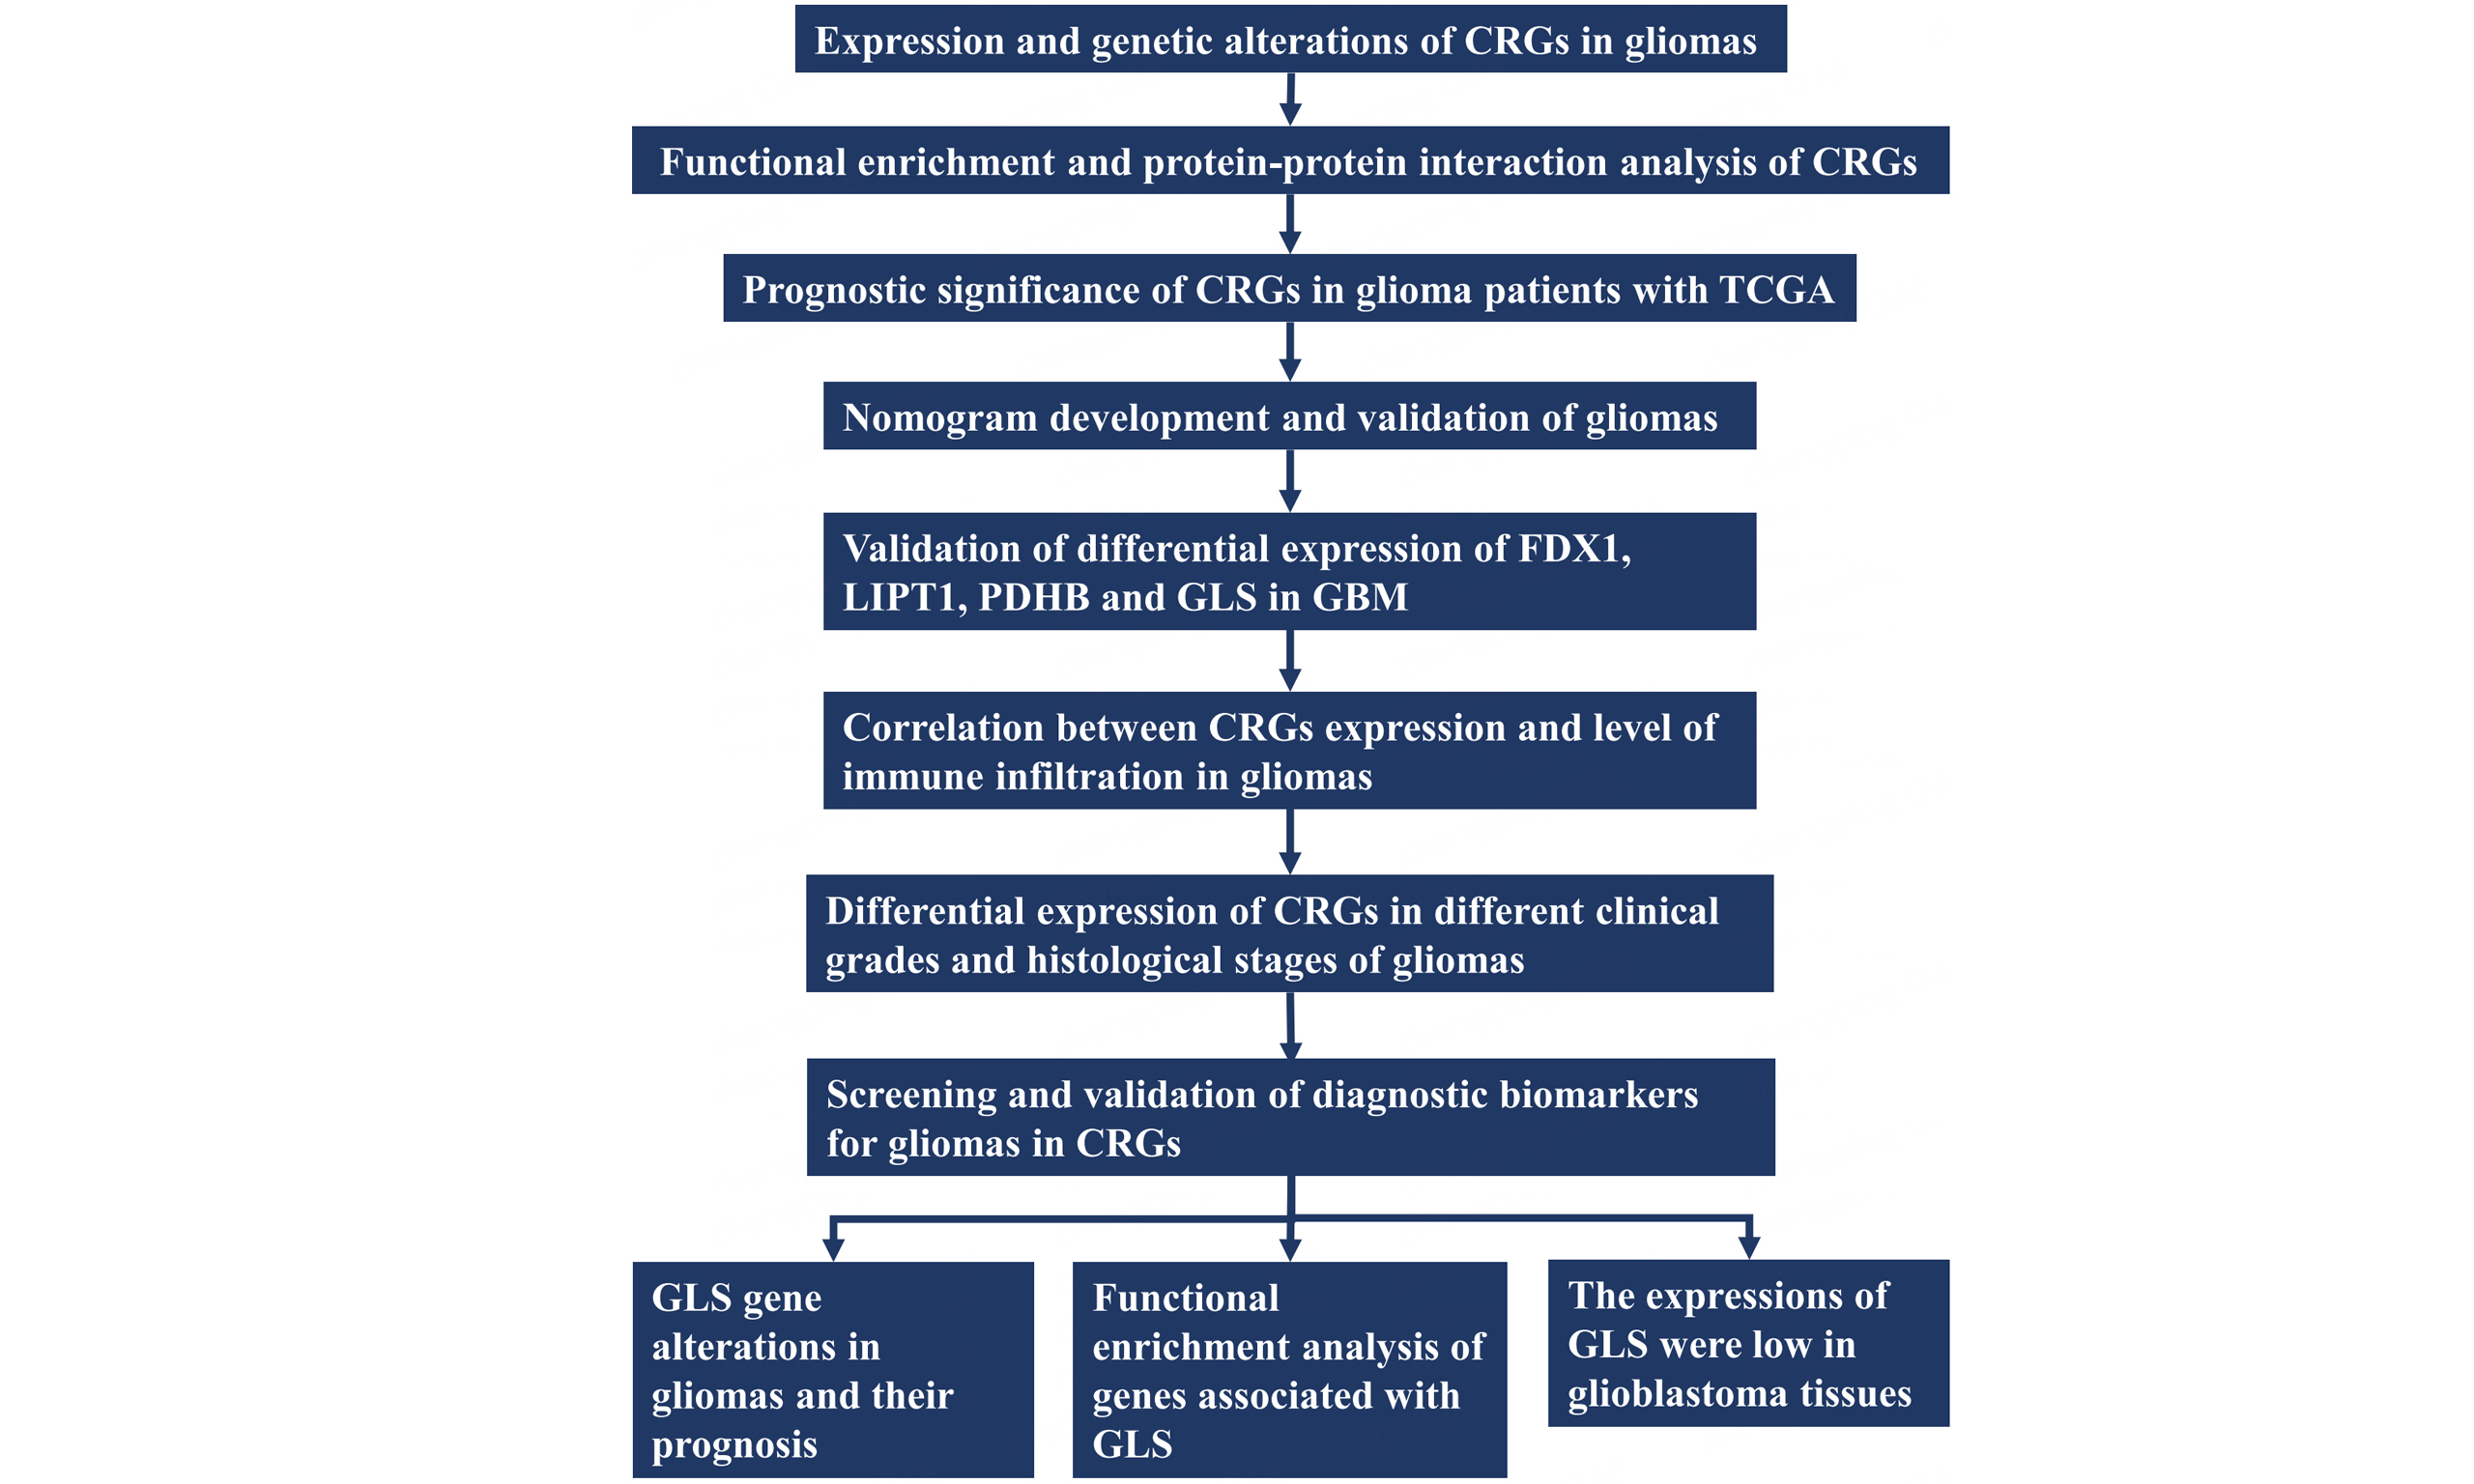
Expression and genetic alterations of CRGs in gliomas
In their study, Tsvetkov et al. conducted a genome-wide CRISPR-Cas9 loss-of-function screening to identify genes involved in copper ionophore-induced cell death[12]. The identified genes, including FDX1, LIAS, LIPT1, DLD, DLAT, PDHA1, PDHB, MTF1, GLS, and CDKN2A, were linked to particular metabolic pathways related to copper toxicity. During our study, we examined the gene expression levels in gliomas and found that seven CRGs were upregulated in glioma tissues: FDX1, LIAS, LIPT1, DLD, DLAT, PDHA1, MTF1, and CDKN2A. At the same time, MTF1, GLS, and CDKN2A were downregulated [Figure 1A]. We further examined the correlation between the expression levels of several genes [Figure 1B] and observed significant positive correlations, particularly between DLAT and DLD (r = 0.919, P < 0.001) [Figure 1C]. These findings provide insights into the coordinated expression patterns of CRGs in gliomas.
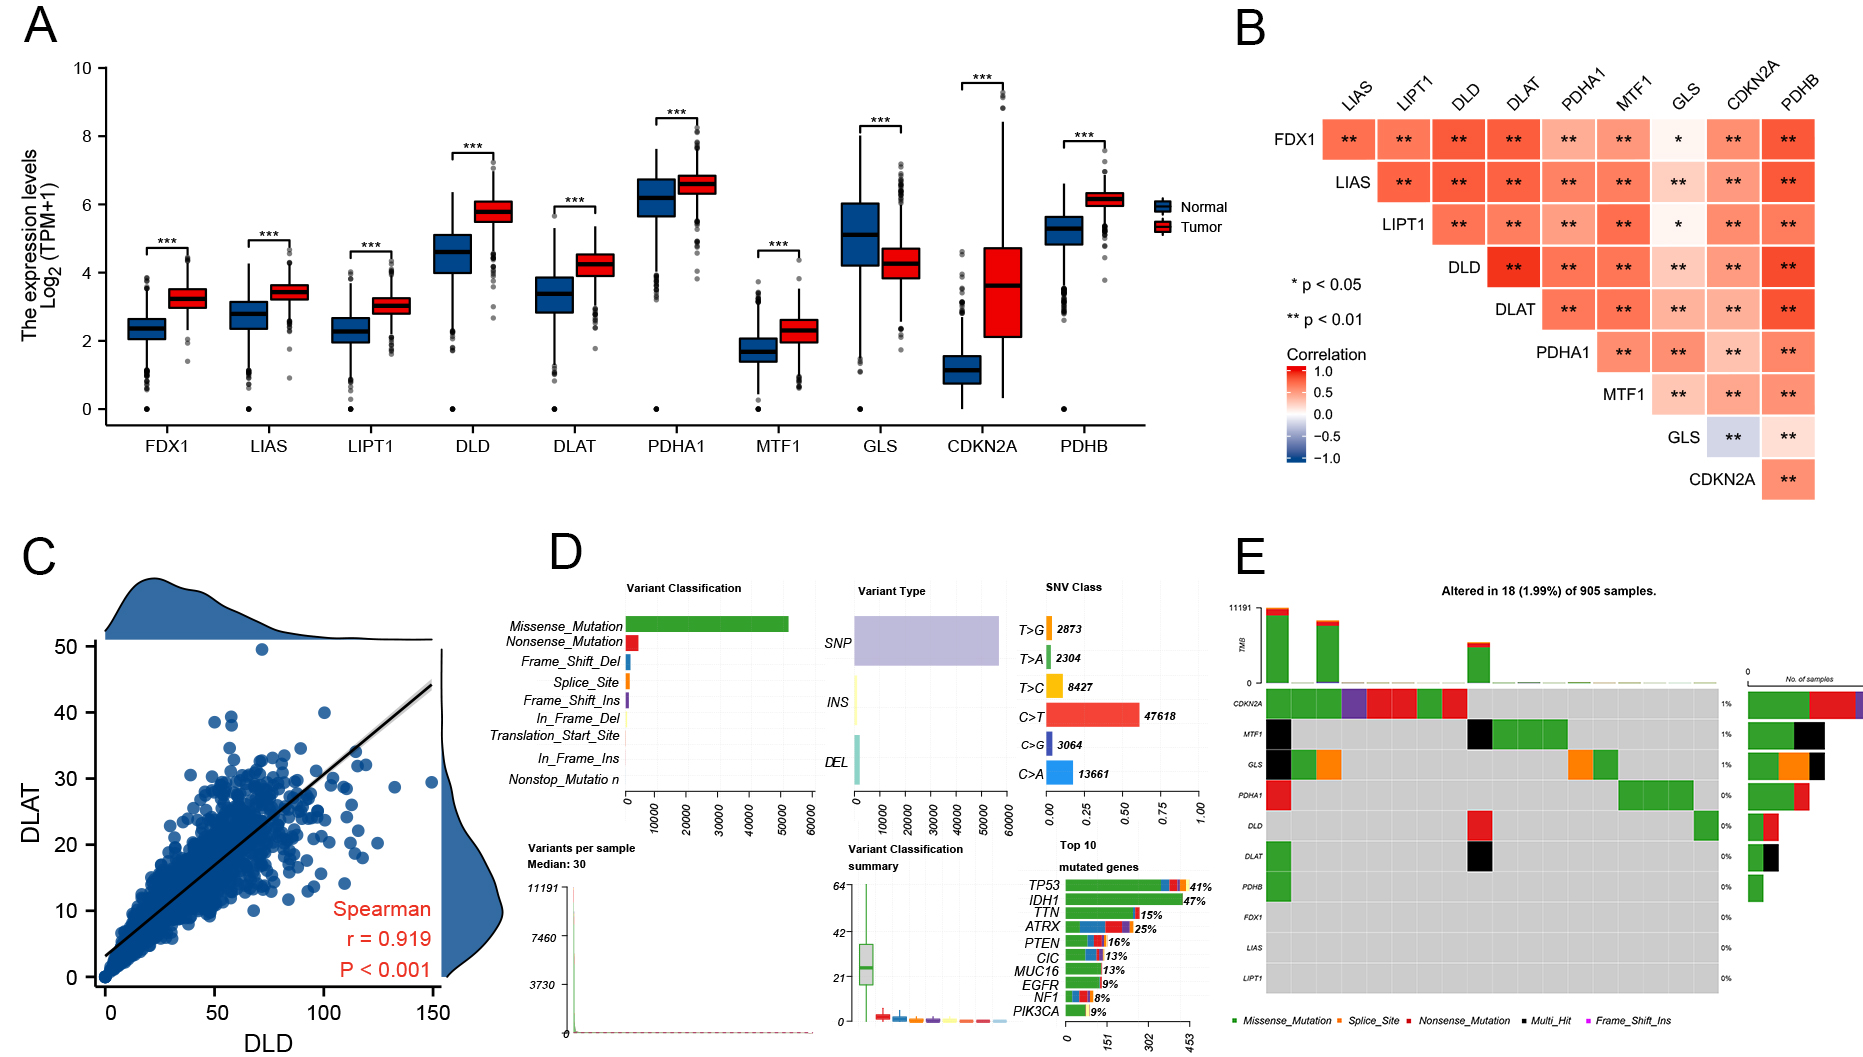
Figure 1. Expression and gene alterations of CRGs in glioma. (A) Expression levels of 10 CRGs in glioma and normal tissues (tumor: red, normal: blue); (B) Correlation among CRG expression levels; (C) Correlation between DLD and DLAT; (D and E) CNV profiles, mutation frequencies, and classification of CRGs in glioma. *P < 0.05, **P < 0.01, ***P < 0.001. CRGs: Cuproptosis-related genes; CNV: copy number variation; DLD: dihydrolipoamide dehydrogenase.
With an emphasis on somatic mutations, the frequency of cuproptosis-related gene modifications was ascertained among glioma samples; the somatic mutation status of 18 out of 905 (1.99%) glioma samples is displayed [Figure 1D and E]. Our analysis revealed that missense mutations were the most prevalent according to the mutation classification [Figure 1D]. The most common type of variant was SNP, and the highest-ranking single nucleotide variant (SNV) class was C > T (47618). Additionally, we discovered that the mutation frequencies of CDKN2A (1%), MTF1 (1%), and GLS (1%) were greater than those of the other three [Figure 1E].
Functional enrichment and protein-protein interaction analysis of CRGs
Using the GO and KEGG databases, we examined the associated pathways to illustrate the biological roles of CRGs. The tricarboxylic acid cycle, acetyl coenzyme-A biosynthesis, citrate metabolism process, and pyruvate acetyl coenzyme-A biosynthesis process were the primary biochemical processes implicated in CRGs. The tricarboxylic acid cycle enzyme complex, the oxidoreductase complex, the dihydrolipoyl dehydrogenase complex, and the mitochondrial matrix are the constituents of the cell. The primary molecular activities include iron-sulfur cluster binding, metal cluster binding, oxidoreductase activity acting on the donor’s aldehyde or oxygen moiety, NAD or NADP acting as acceptor, and oxidoreductase activity acting on the donor’s aldehyde or oxygen group [Figure 2A]. Additionally, KEGG pathway enrichment analysis revealed that CRGs are primarily linked to the citrate cycle, glycolysis/gluconeogenesis, carbon metabolism, and pyruvate metabolism [Figure 2B]. Protein-protein interaction (PPI) analysis further demonstrated that CRGs interact with a range of proteins [Figure 3].
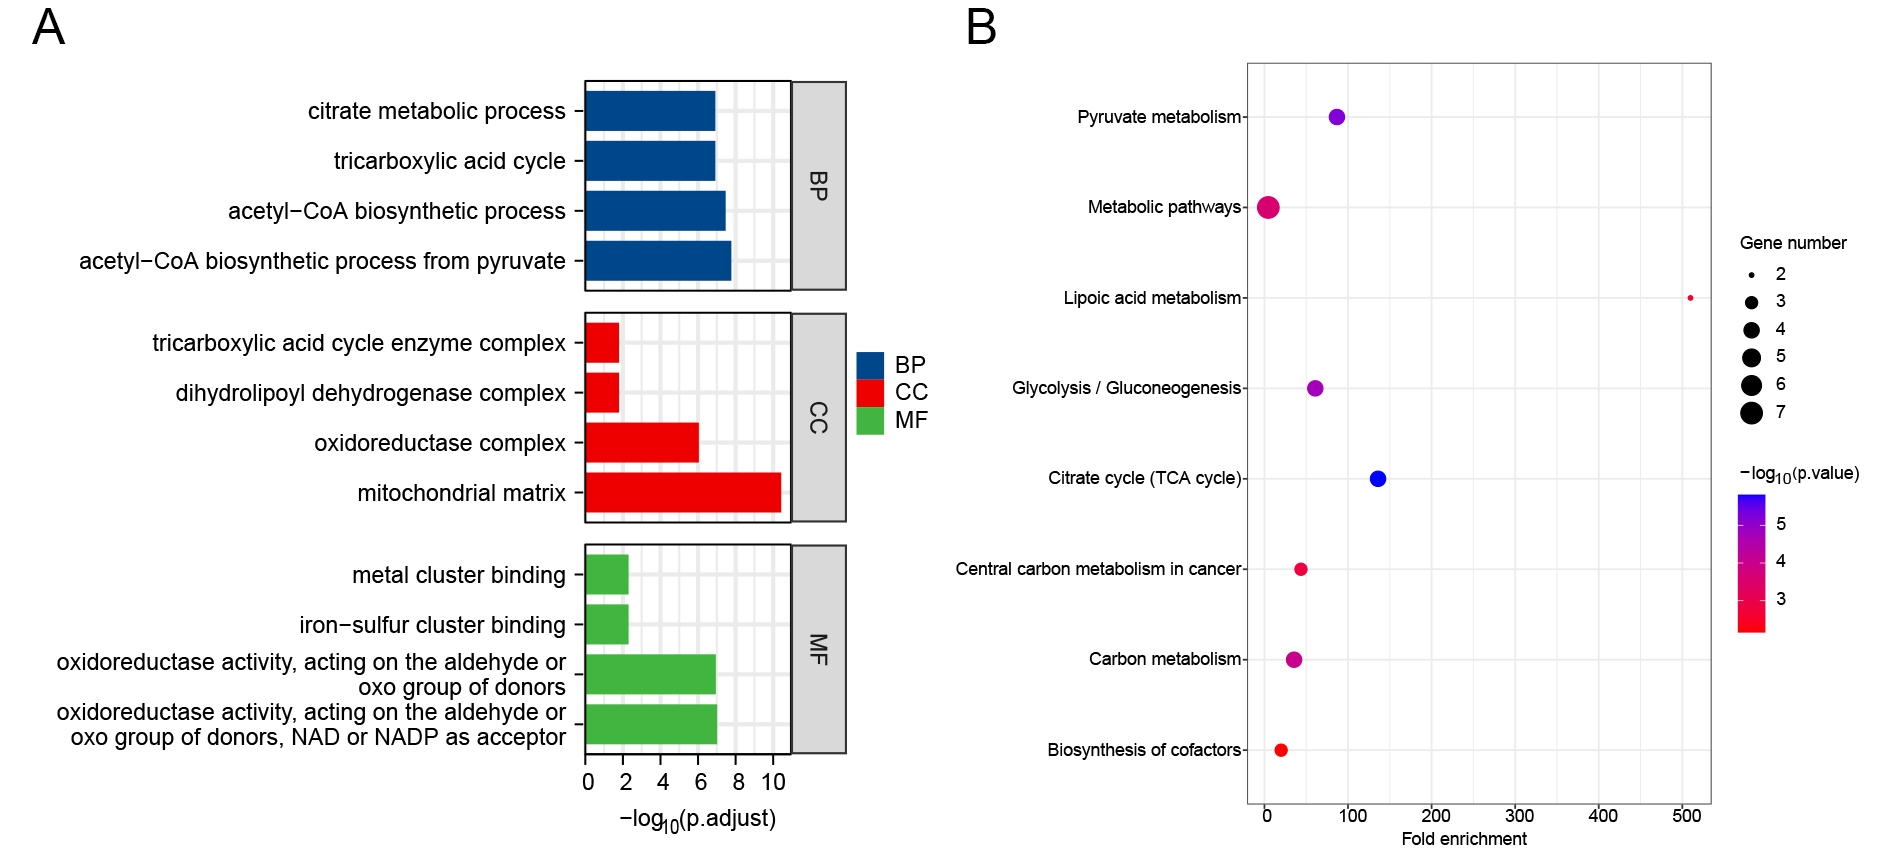
Figure 2. Functional enrichment analysis of CRGs. (A) GO enrichment analysis; (B) KEGG pathway enrichment. Circle size represents the number of enriched genes. BP: Biological process; CC: cellular component; MF: molecular function; CRGs: cuproptosis-related genes; GO: gene ontology; KEGG: kyoto encyclopedia of genes and genomes.
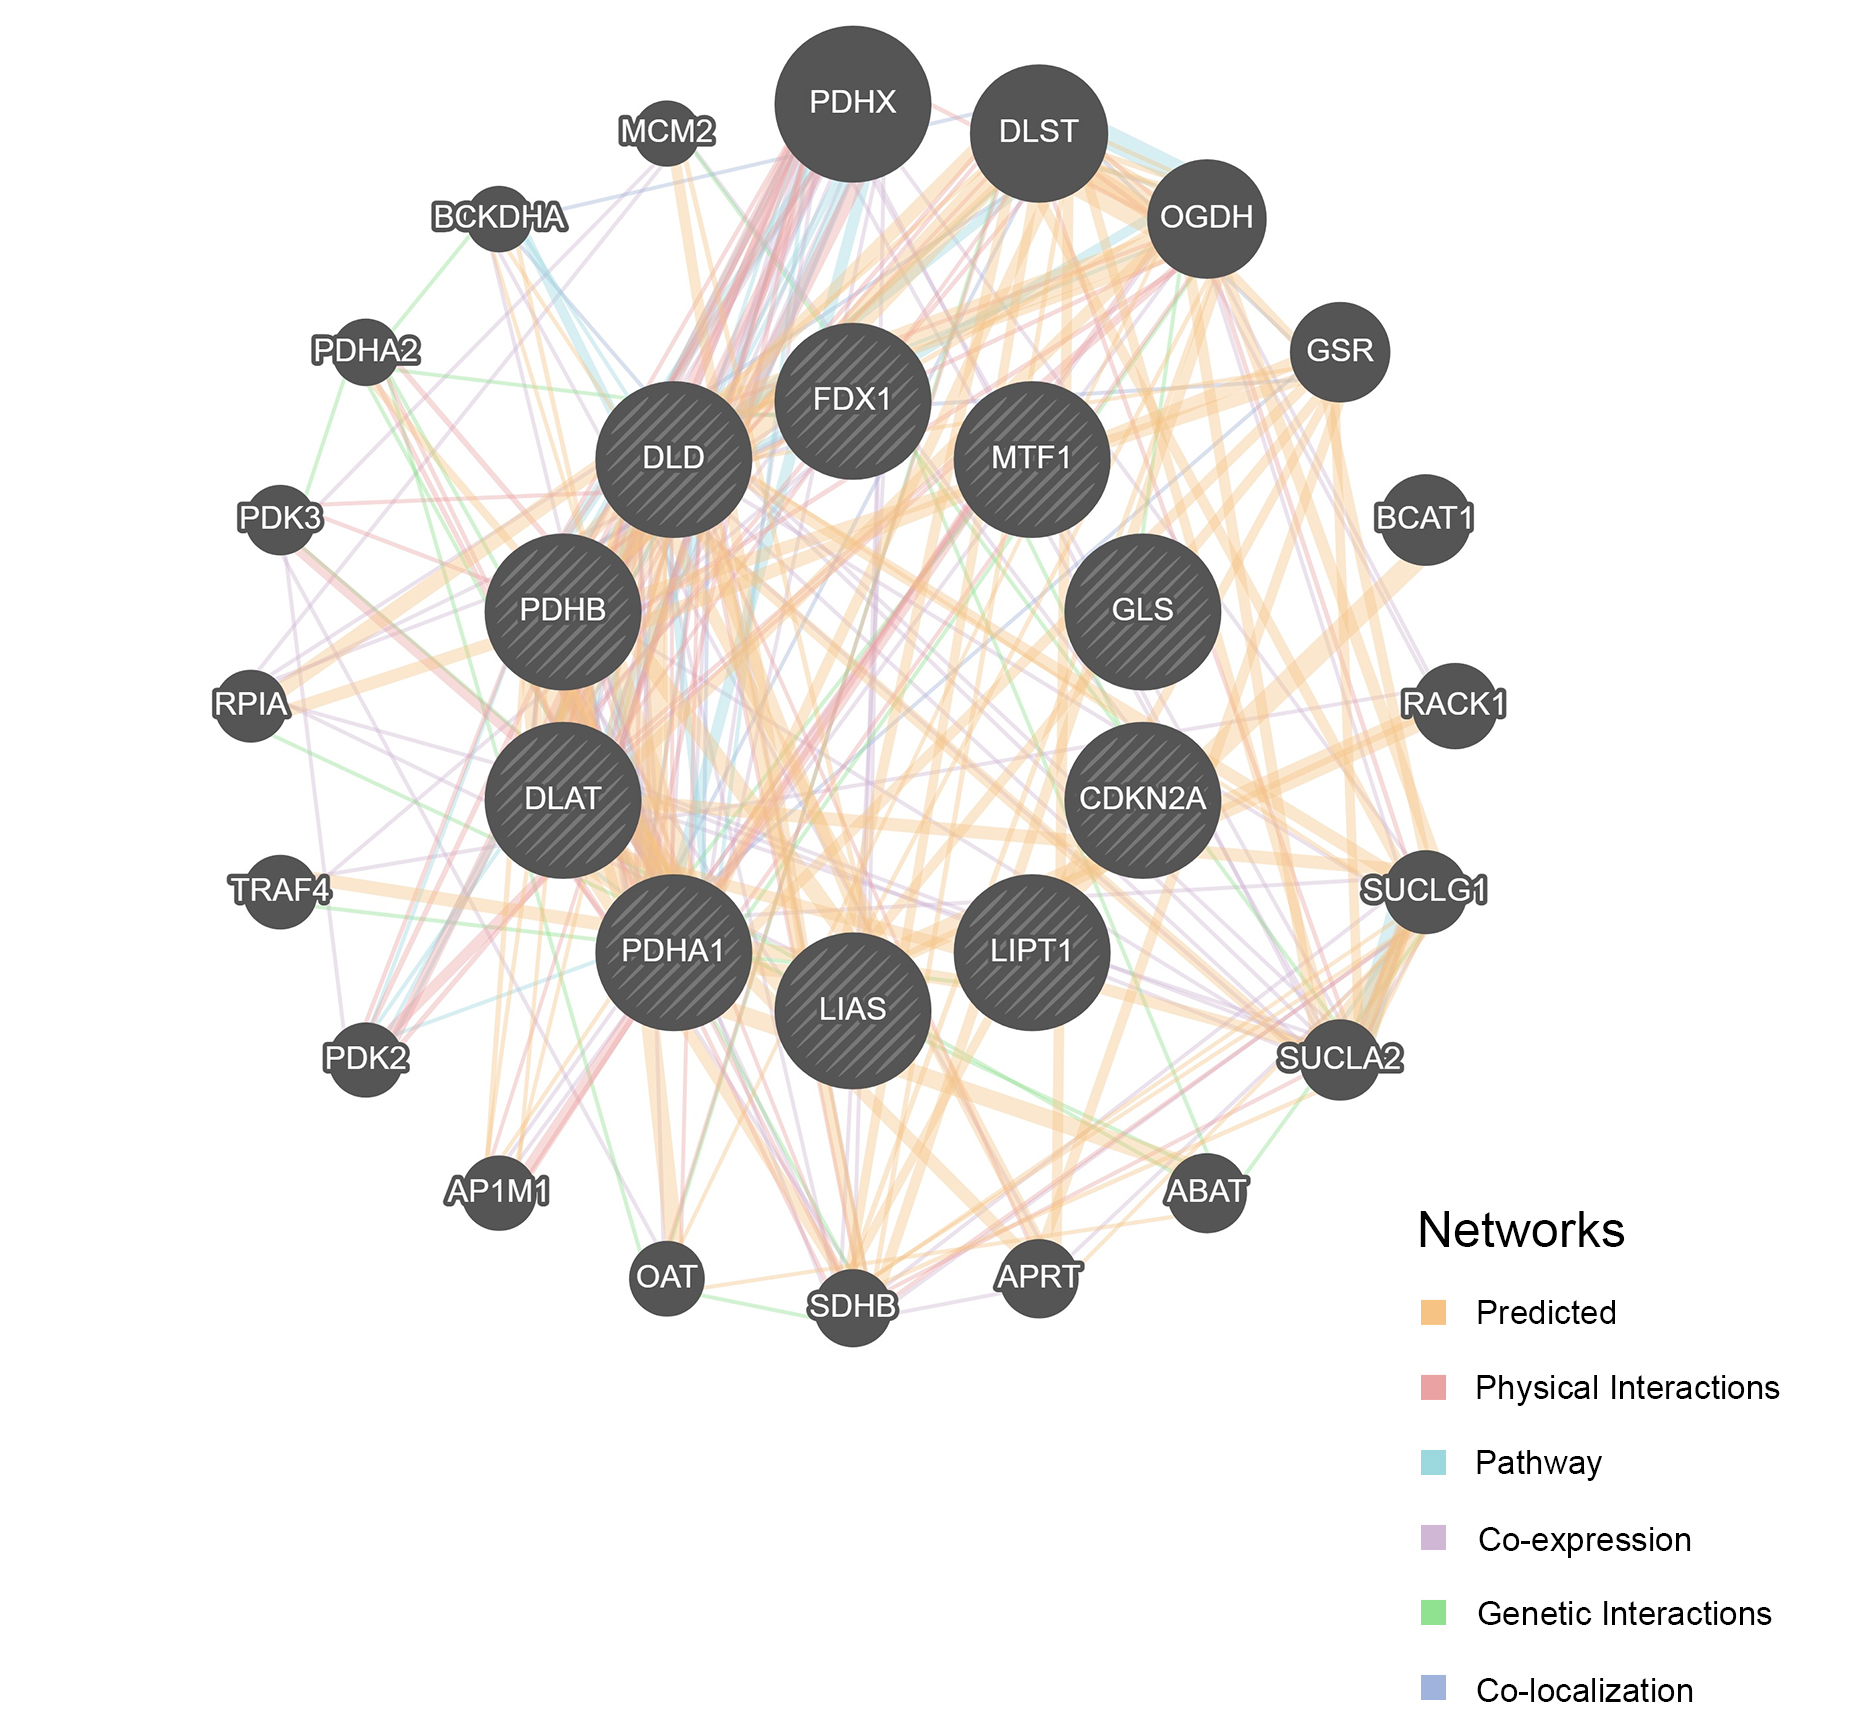
Figure 3. Protein-protein interaction network of CRGs. Visualization of the interaction network among CRGs. CRGs: Cuproptosis-related genes.
Prognostic significance of CRGs in glioma patients with TCGA
The predictive importance of CRGs for glioma OS and PFS was constructed using SIS. Seven genes were chosen to predict OS outcomes in glioma patients, and prognostic scores were calculated based on their regression coefficients; higher risk scores for CRG features were linked to worse OS (HR = 3.56, 95%CI: 2.73-4.65, P < 0.001, Figure 4A and B). Additionally, a weighted risk score that included all relevant genes was used to predict 1-, 3-, and 5-year OS [Figure 4C]. The AUC values for the 1-, 3-, and 5-year Receiver Operating Characteristic (ROC) curves were 0.776, 0.759, and 0.763, respectively, demonstrating good predictive accuracy. Kaplan-Meier analysis showed that, except for PDHA1
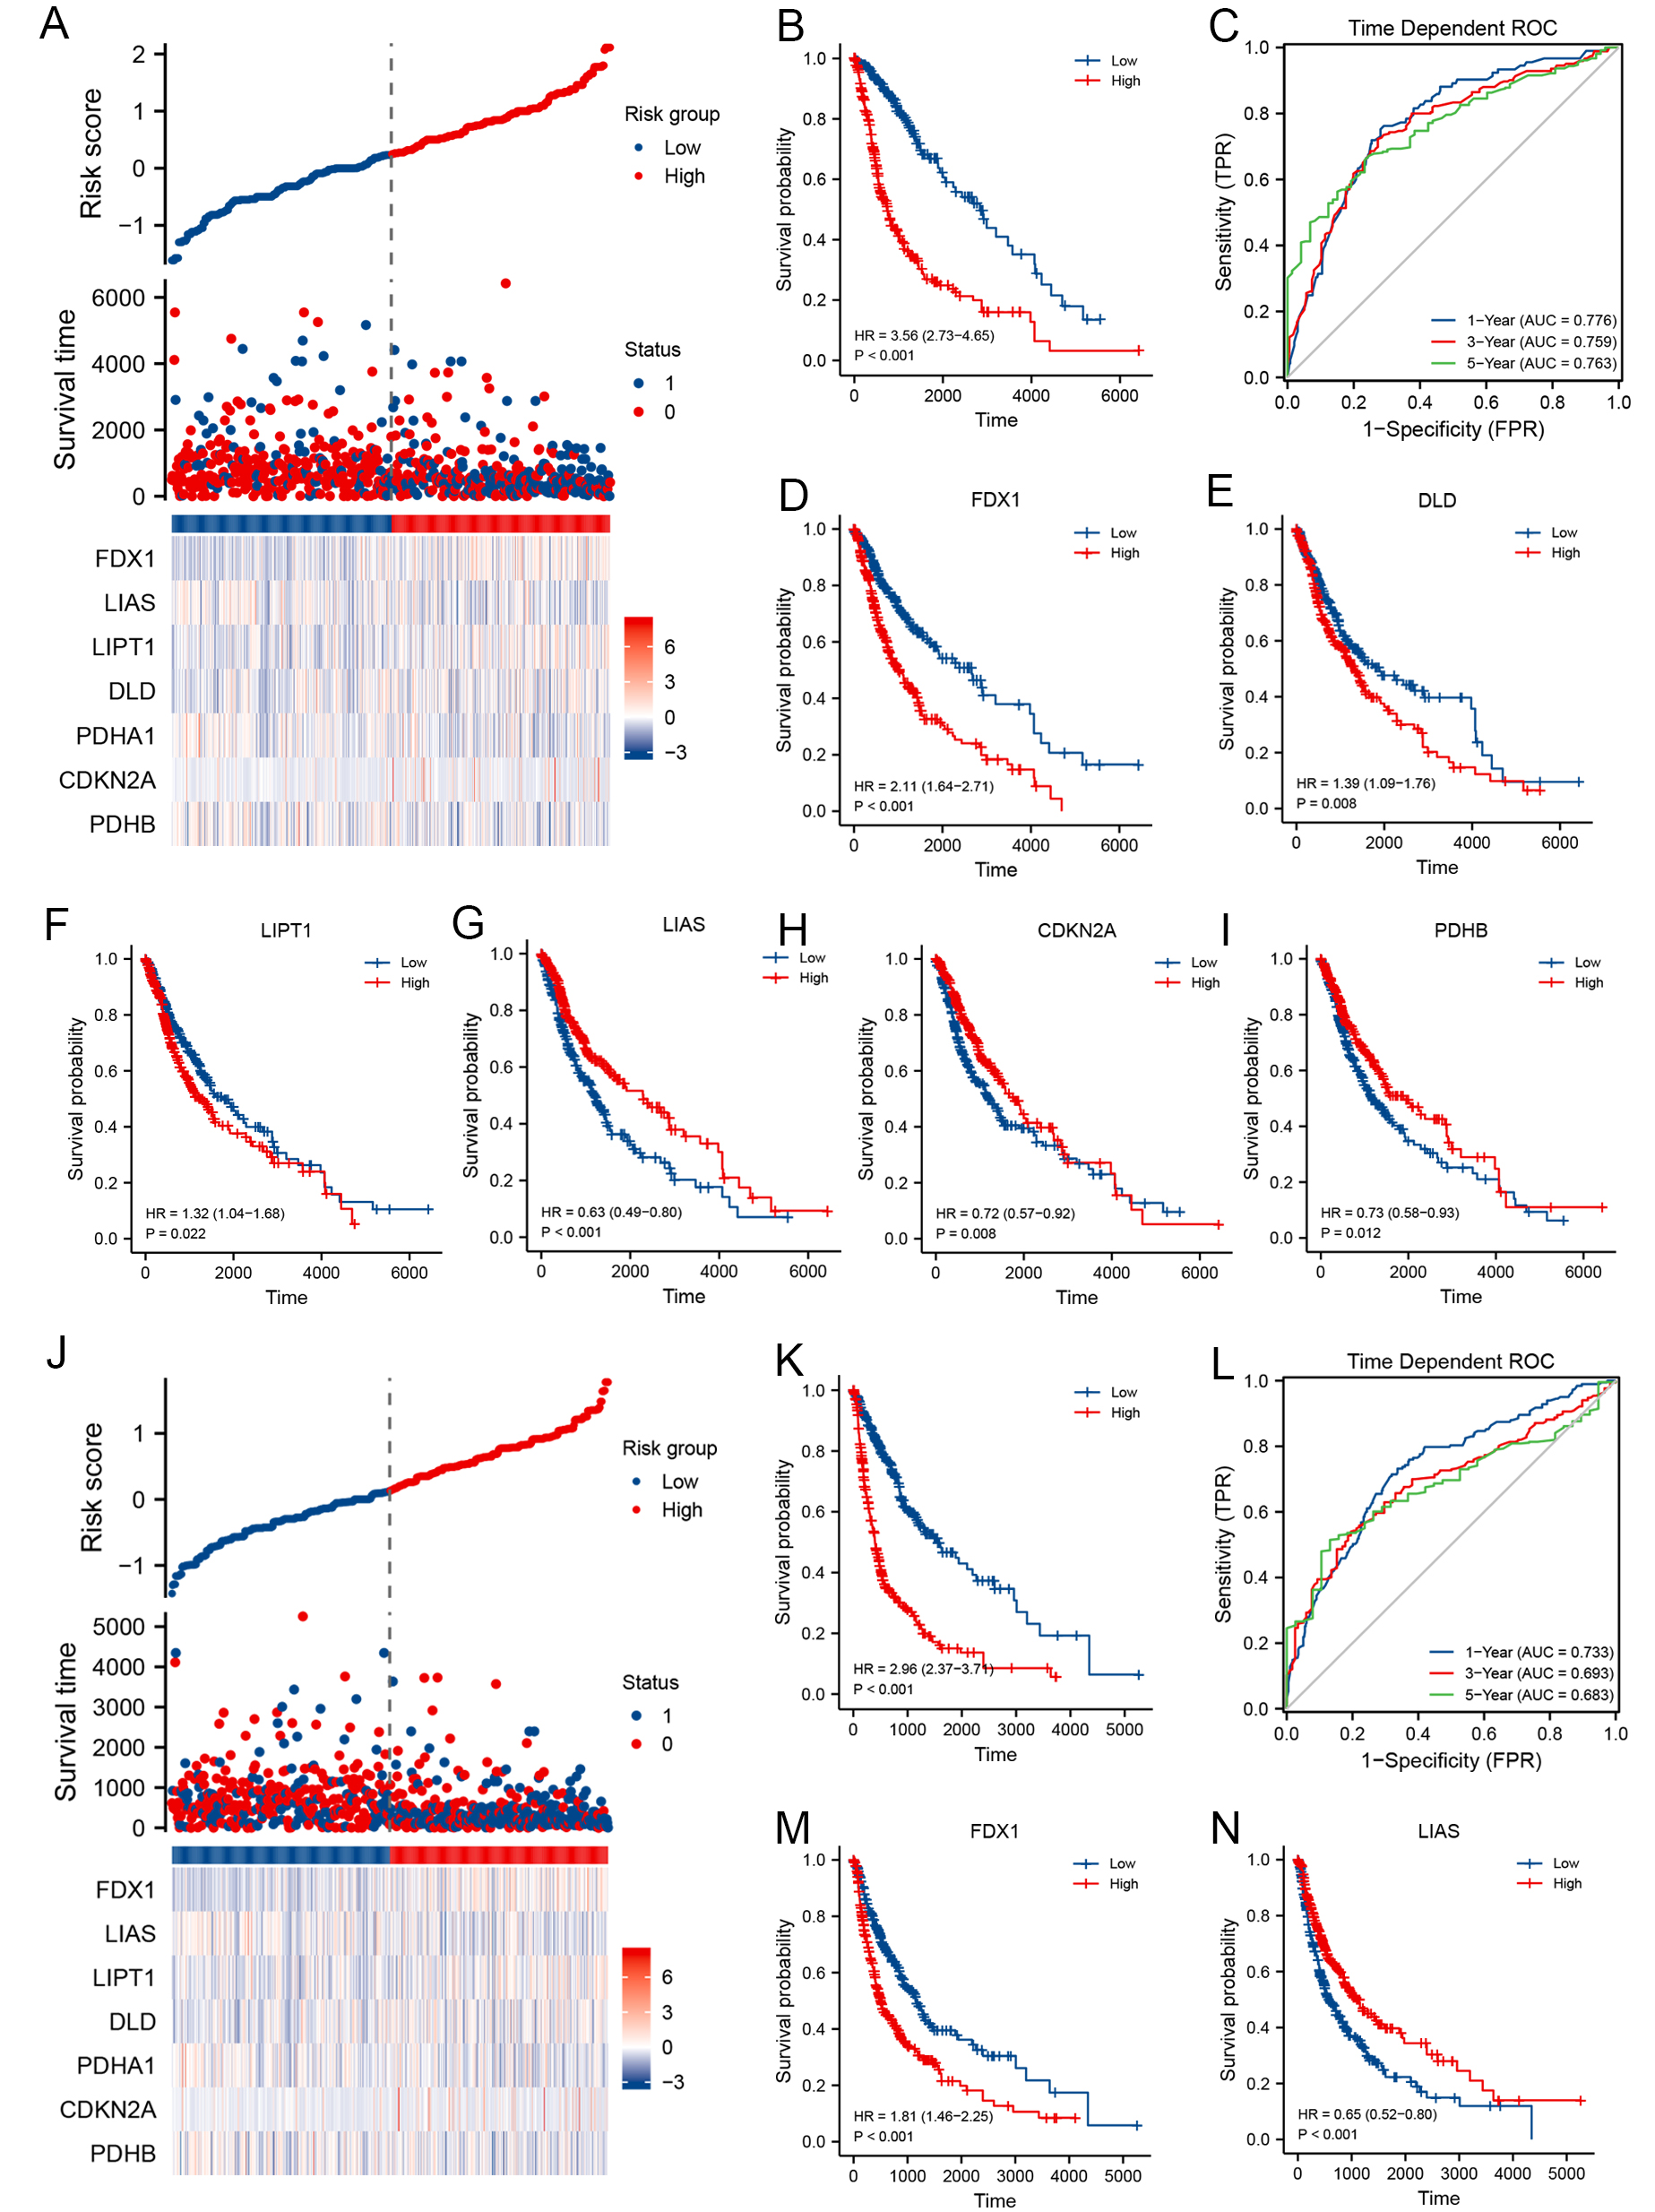
Figure 4. Clinical relevance of CRGs in glioma patients from TCGA. For OS: (A) Distribution of risk scores, survival status, and prognostic CRG expression; (B) Kaplan-Meier survival curve of the CRG signature and OS; (C) ROC curves for 1-, 3-, and 5-year OS prediction. Kaplan-Meier plots for the expression of (D) FDX1, (E) DLD, (F) LIPT1, (G) LIAS, (H) CDKN2A, and (I) PDHB and their association with OS; For PFS: (J) Distribution of risk scores, survival status, and prognostic CRG expression; (K) Kaplan-Meier survival curve of the CRG signature and PFS; (L) ROC curves for 1-, 3-, and 5-year PFS prediction. Kaplan-Meier plots for the expression of (M) FDX1 and (N) LIAS and their association with PFS. CRGs: Cuproptosis-related genes; TCGA: the cancer genome atlas; OS: overall survival; PFS: progression-free survival; ROC: receiver operating characteristic; DLD: dihydrolipoamide dehydrogenase; LIAS: lipoic acid synthetase; PDHB:pyruvate dehydrogenase E1 subunit beta.
Nomogram development and validation of gliomas
We combined the genetic traits of TCGA patients with clinical data to enable the prediction model’s clinical use. A multivariate Cox regression model was used to create a nomogram. OS and PFS data were evaluated through discriminant and calibration analyses [Figure 5A and B]. Statistical significance was set at a threshold of P < 0.05. Gender and the expression levels of LIAS, LIPT1, PDHA1, and PDHB showed 95% confidence intervals (CIs) that were not statistically significant and had no meaningful effect on OS in glioma patients. In contrast, age, WHO grades, FDX1, DLD, and CDKN2A significantly influenced the
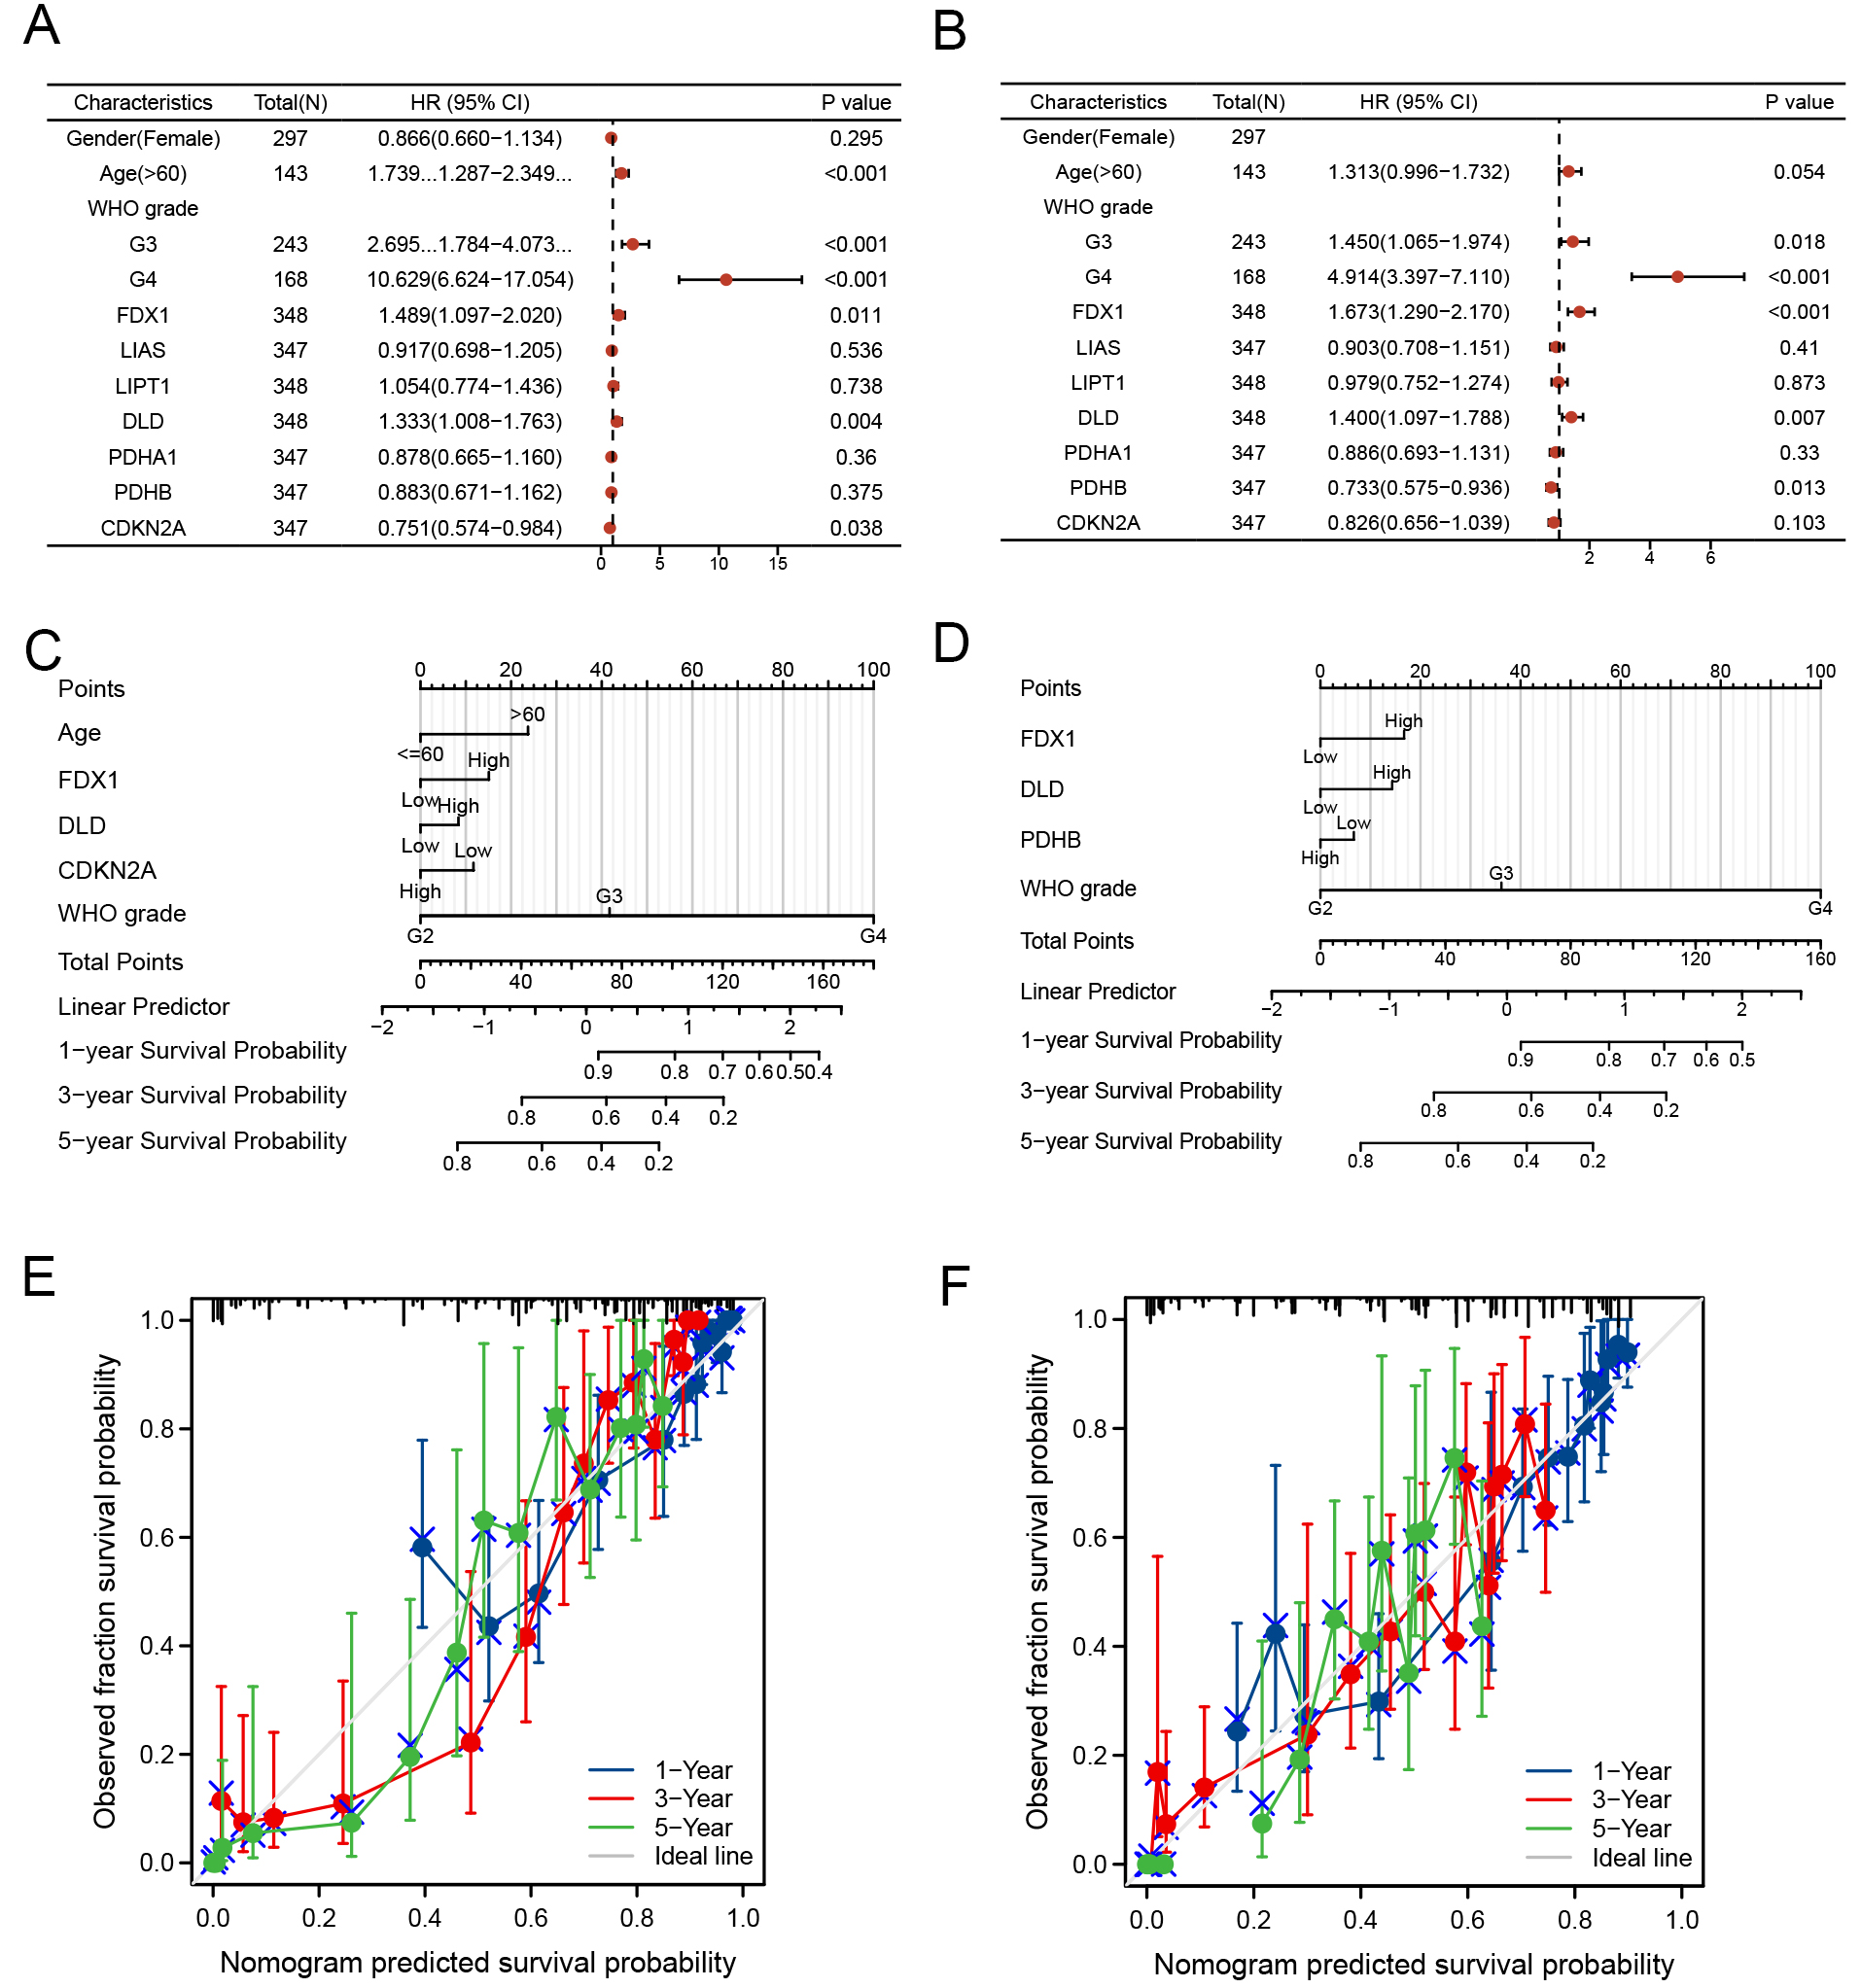
Figure 5. Development and validation of a prognostic nomogram. H azard ratios and P-values from multivariate Cox regression analysis integrating clinical dat. (A) OS and (B) PFS data were evaluated through discriminant and calibration analyses. Develop the 1-, 3-, and 5-year survival probabilities of (C) OS and (D) PFS for glioma patients based on age, WHO grades, FDX1, DLD, and CDKN2A. Nomogram for predicting survival probabilities of (E) OS and (F) PFS separately.
Verification of varied expression levels of FDX1, LIPT1, PDHB, and GLS in GBM
To verify the link between the altered expression of the identified genes and GBM, we analyzed two independently validated GEO datasets (GSE16011 and GSE116520). In GBM tissues, the expression levels of FDX1 and LIPT1 were markedly elevated, whereas PDHB and GLS were markedly downregulated [Figure 6]. These results suggest that FDX1 and LIPT1 may function as oncogenes, while PDHB and GLS likely function as tumor suppressor genes.
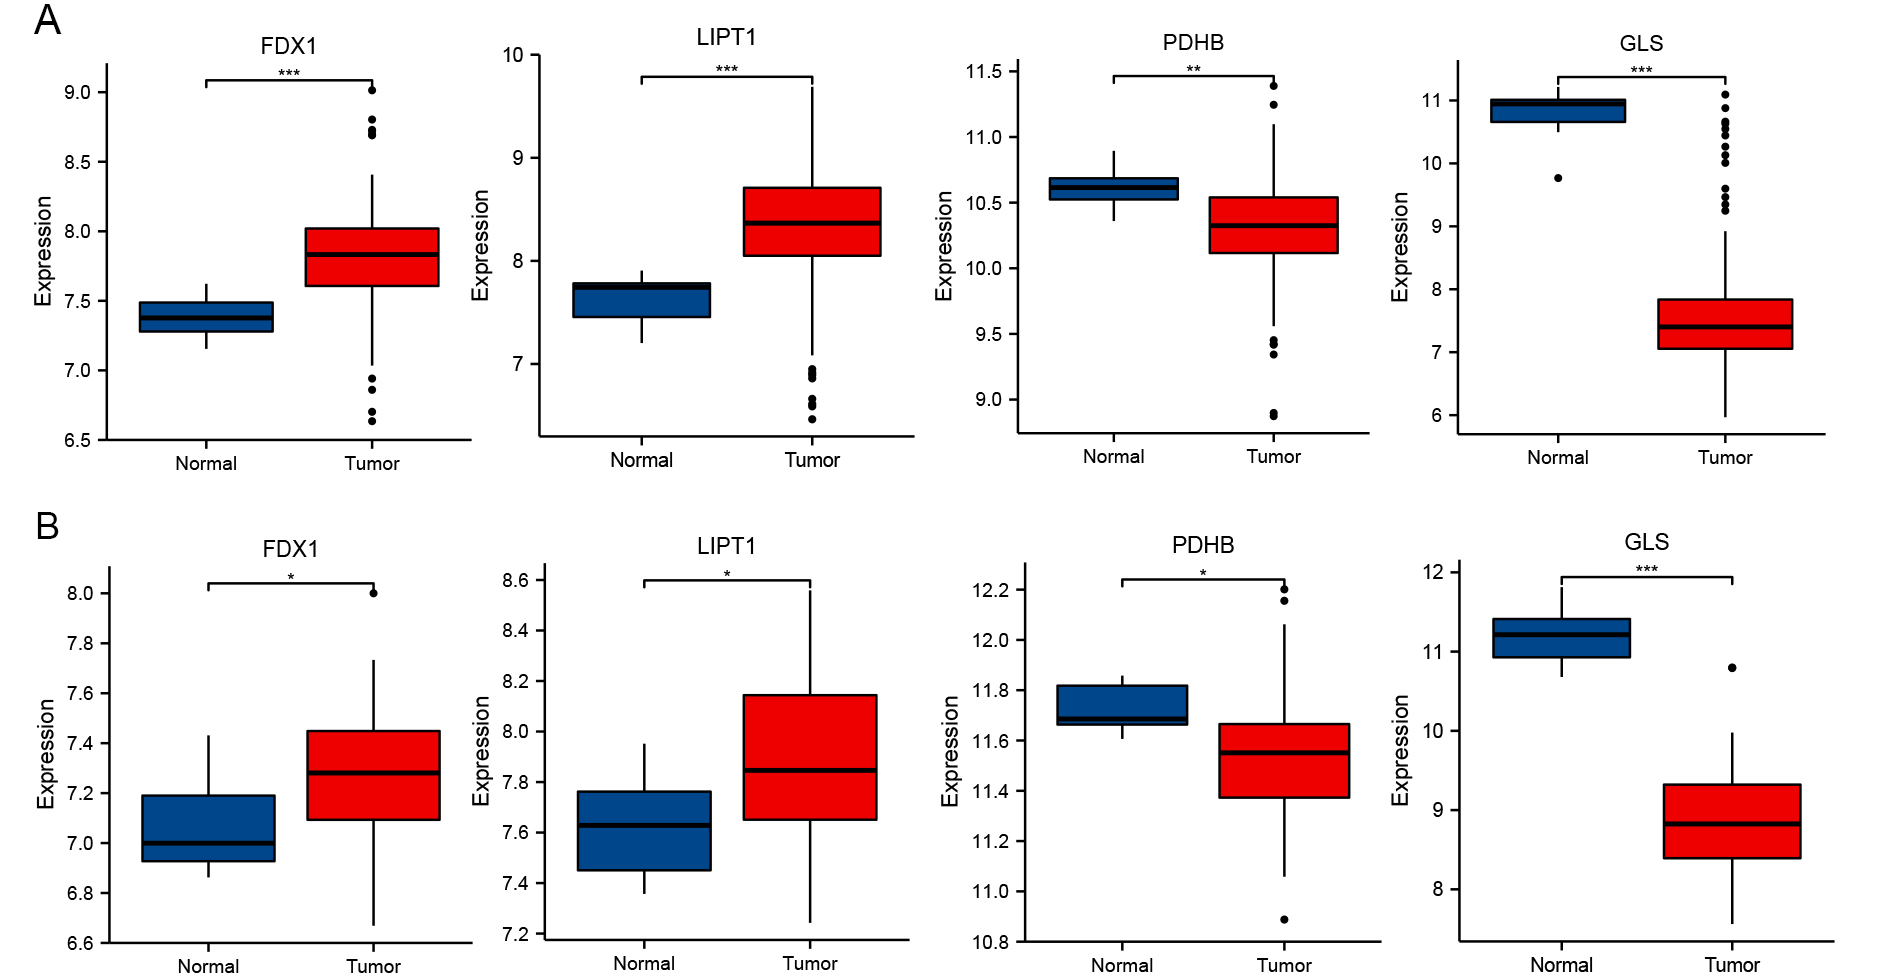
Figure 6. Differential expression analysis and dataset validation. Box plots showing expression of FDX1, LIPT1, PDHB, and GLS in (A) GSE16011 and (B) GSE116520 datasets. *P < 0.05, **P < 0.01, ***P < 0.001.
Correlation between CRG expression and immune cell infiltration in gliomas
The impact of CRGs on immune cell recruitment within the tumor microenvironment and their influence on glioma prognosis remain unclear. Thus, we investigated the connection between immune infiltration in gliomas and FDX1, LIPT1, PDHB, and GLS. Figure 7A illustrates a significant association between FDX1 expression levels and immune infiltration in neutrophils, dendritic cells, and macrophages (P < 0.001, P < 0.001, and P < 0.001). The levels of immunological infiltration of B cells (P < 0.001), CD8+ cells (P < 0.01), macrophages (P < 0.001), neutrophil granulocytes (P < 0.001), dendritic cells (P < 0.001), and macrophage expression levels were positively connected with LIPT1 expression levels [Figure 7B]. As shown in Figure 7C, there was a positive correlation between the levels of PDHB expression and the quantity of CD8+ cells (P < 0.001), macrophages (P < 0.001), and neutrophils (P < 0.001). GLS expression was positively correlated with the number of CD8+ T cells (P < 0.05), macrophages (P < 0.05), and neutrophils (P < 0.001), as shown in Figure 7D. A similar pattern was also observed in low-grade gliomas (LGGs) [Supplementary Figure 2].
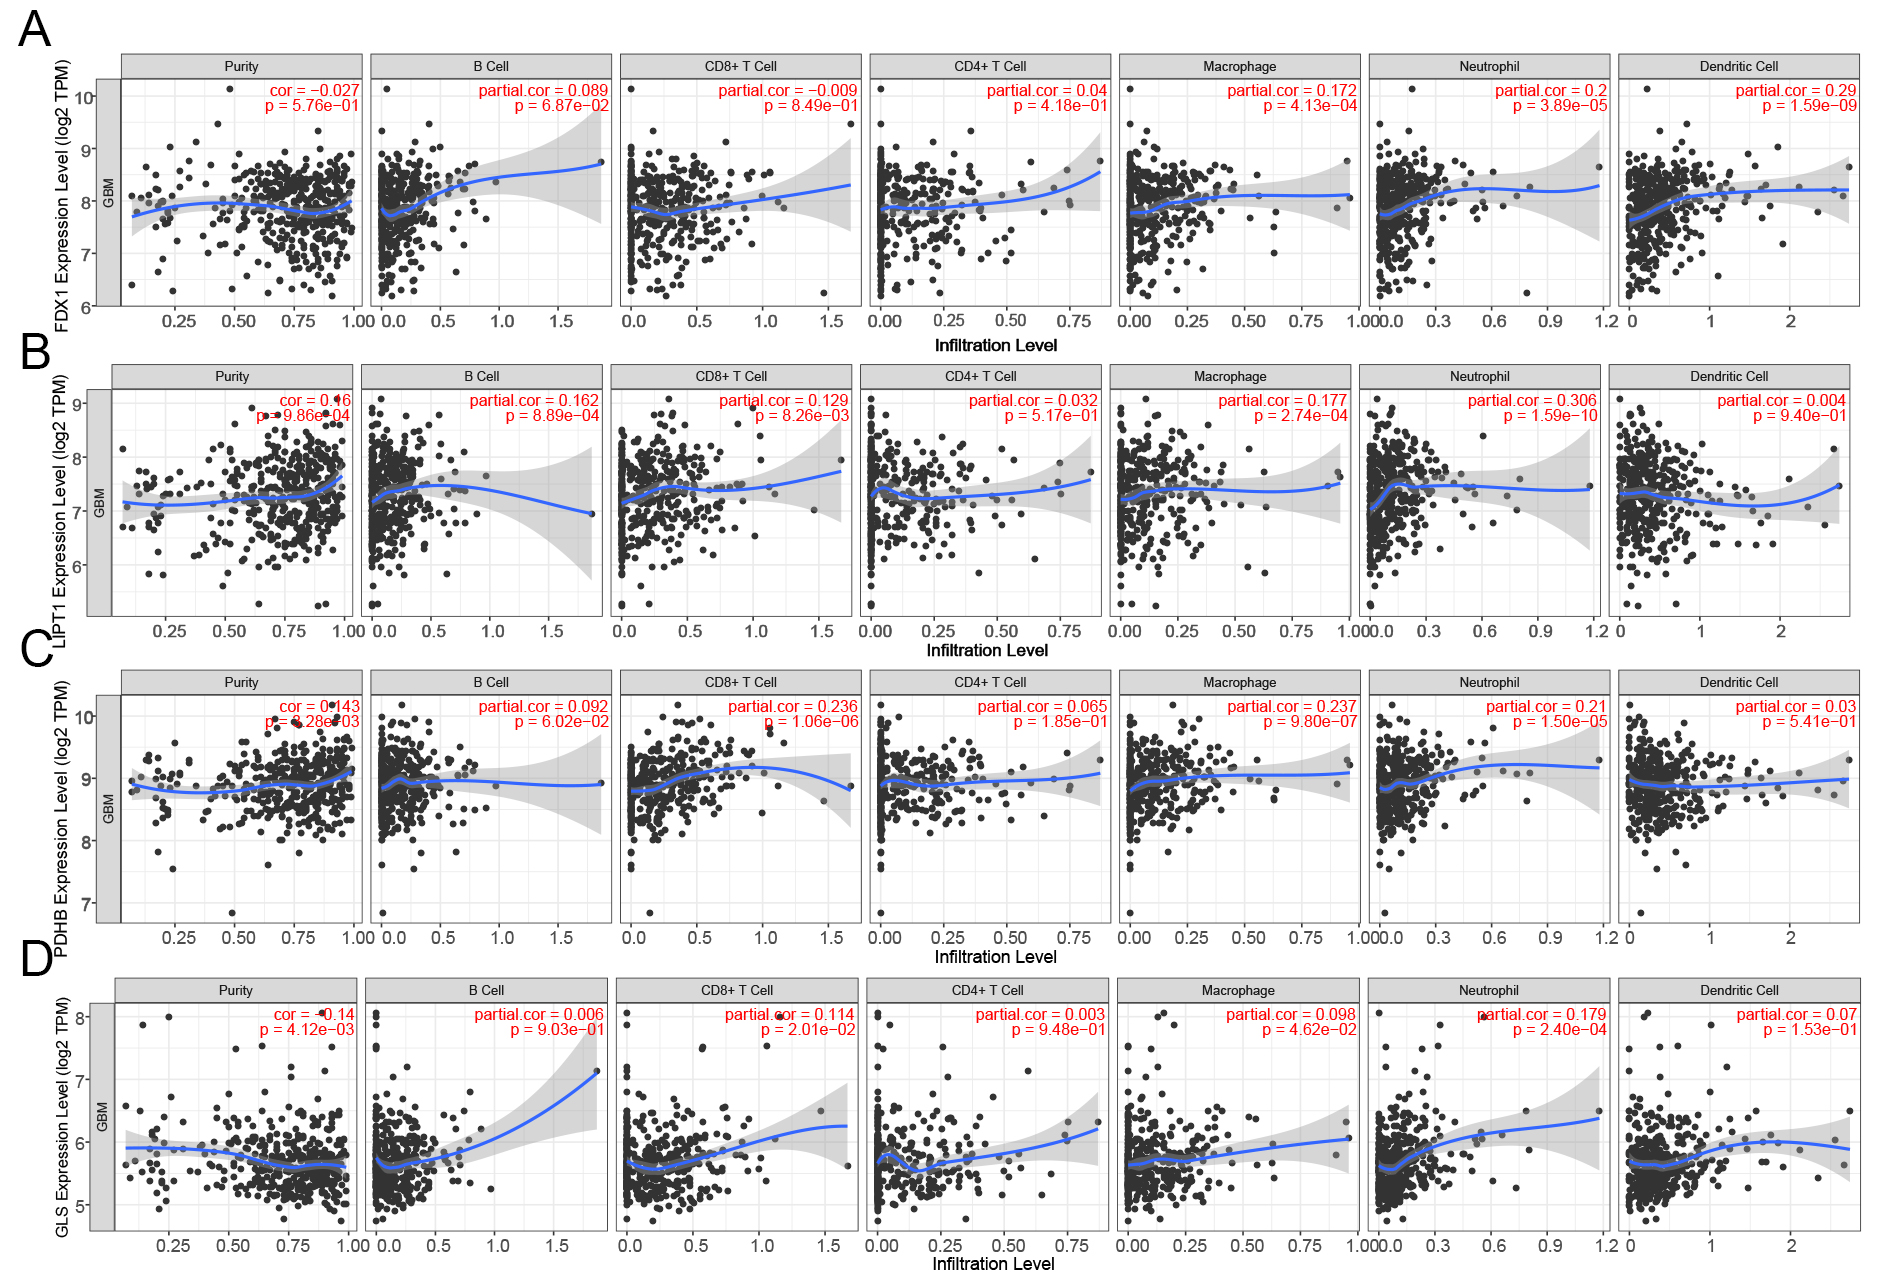
Figure 7. Correlation between CRG expression and immune infiltration in GBM (TIMER database). Correlation between the expression of (A) FDX1, (B) LIPT1, (C) PDHB, and (D) GLS and immune cell infiltration in GBM. GBM: Glioblastoma; CRGs: cuproptosis-related genes; TIMER: tumor immune estimation resource; GLS: glutaminase.
Following a correlation analysis of sixty immunological checkpoints, we selected the top five locations for further investigation. Our research indicates a positive correlation between FDX1 expression and the levels of TLR4 (r = 0.148, P < 0.001), HMGB1 (r = 0.354, P < 0.001), BTN3A1 (r = 0.405, P < 0.001), TNFSF4 (r = 0.395, P
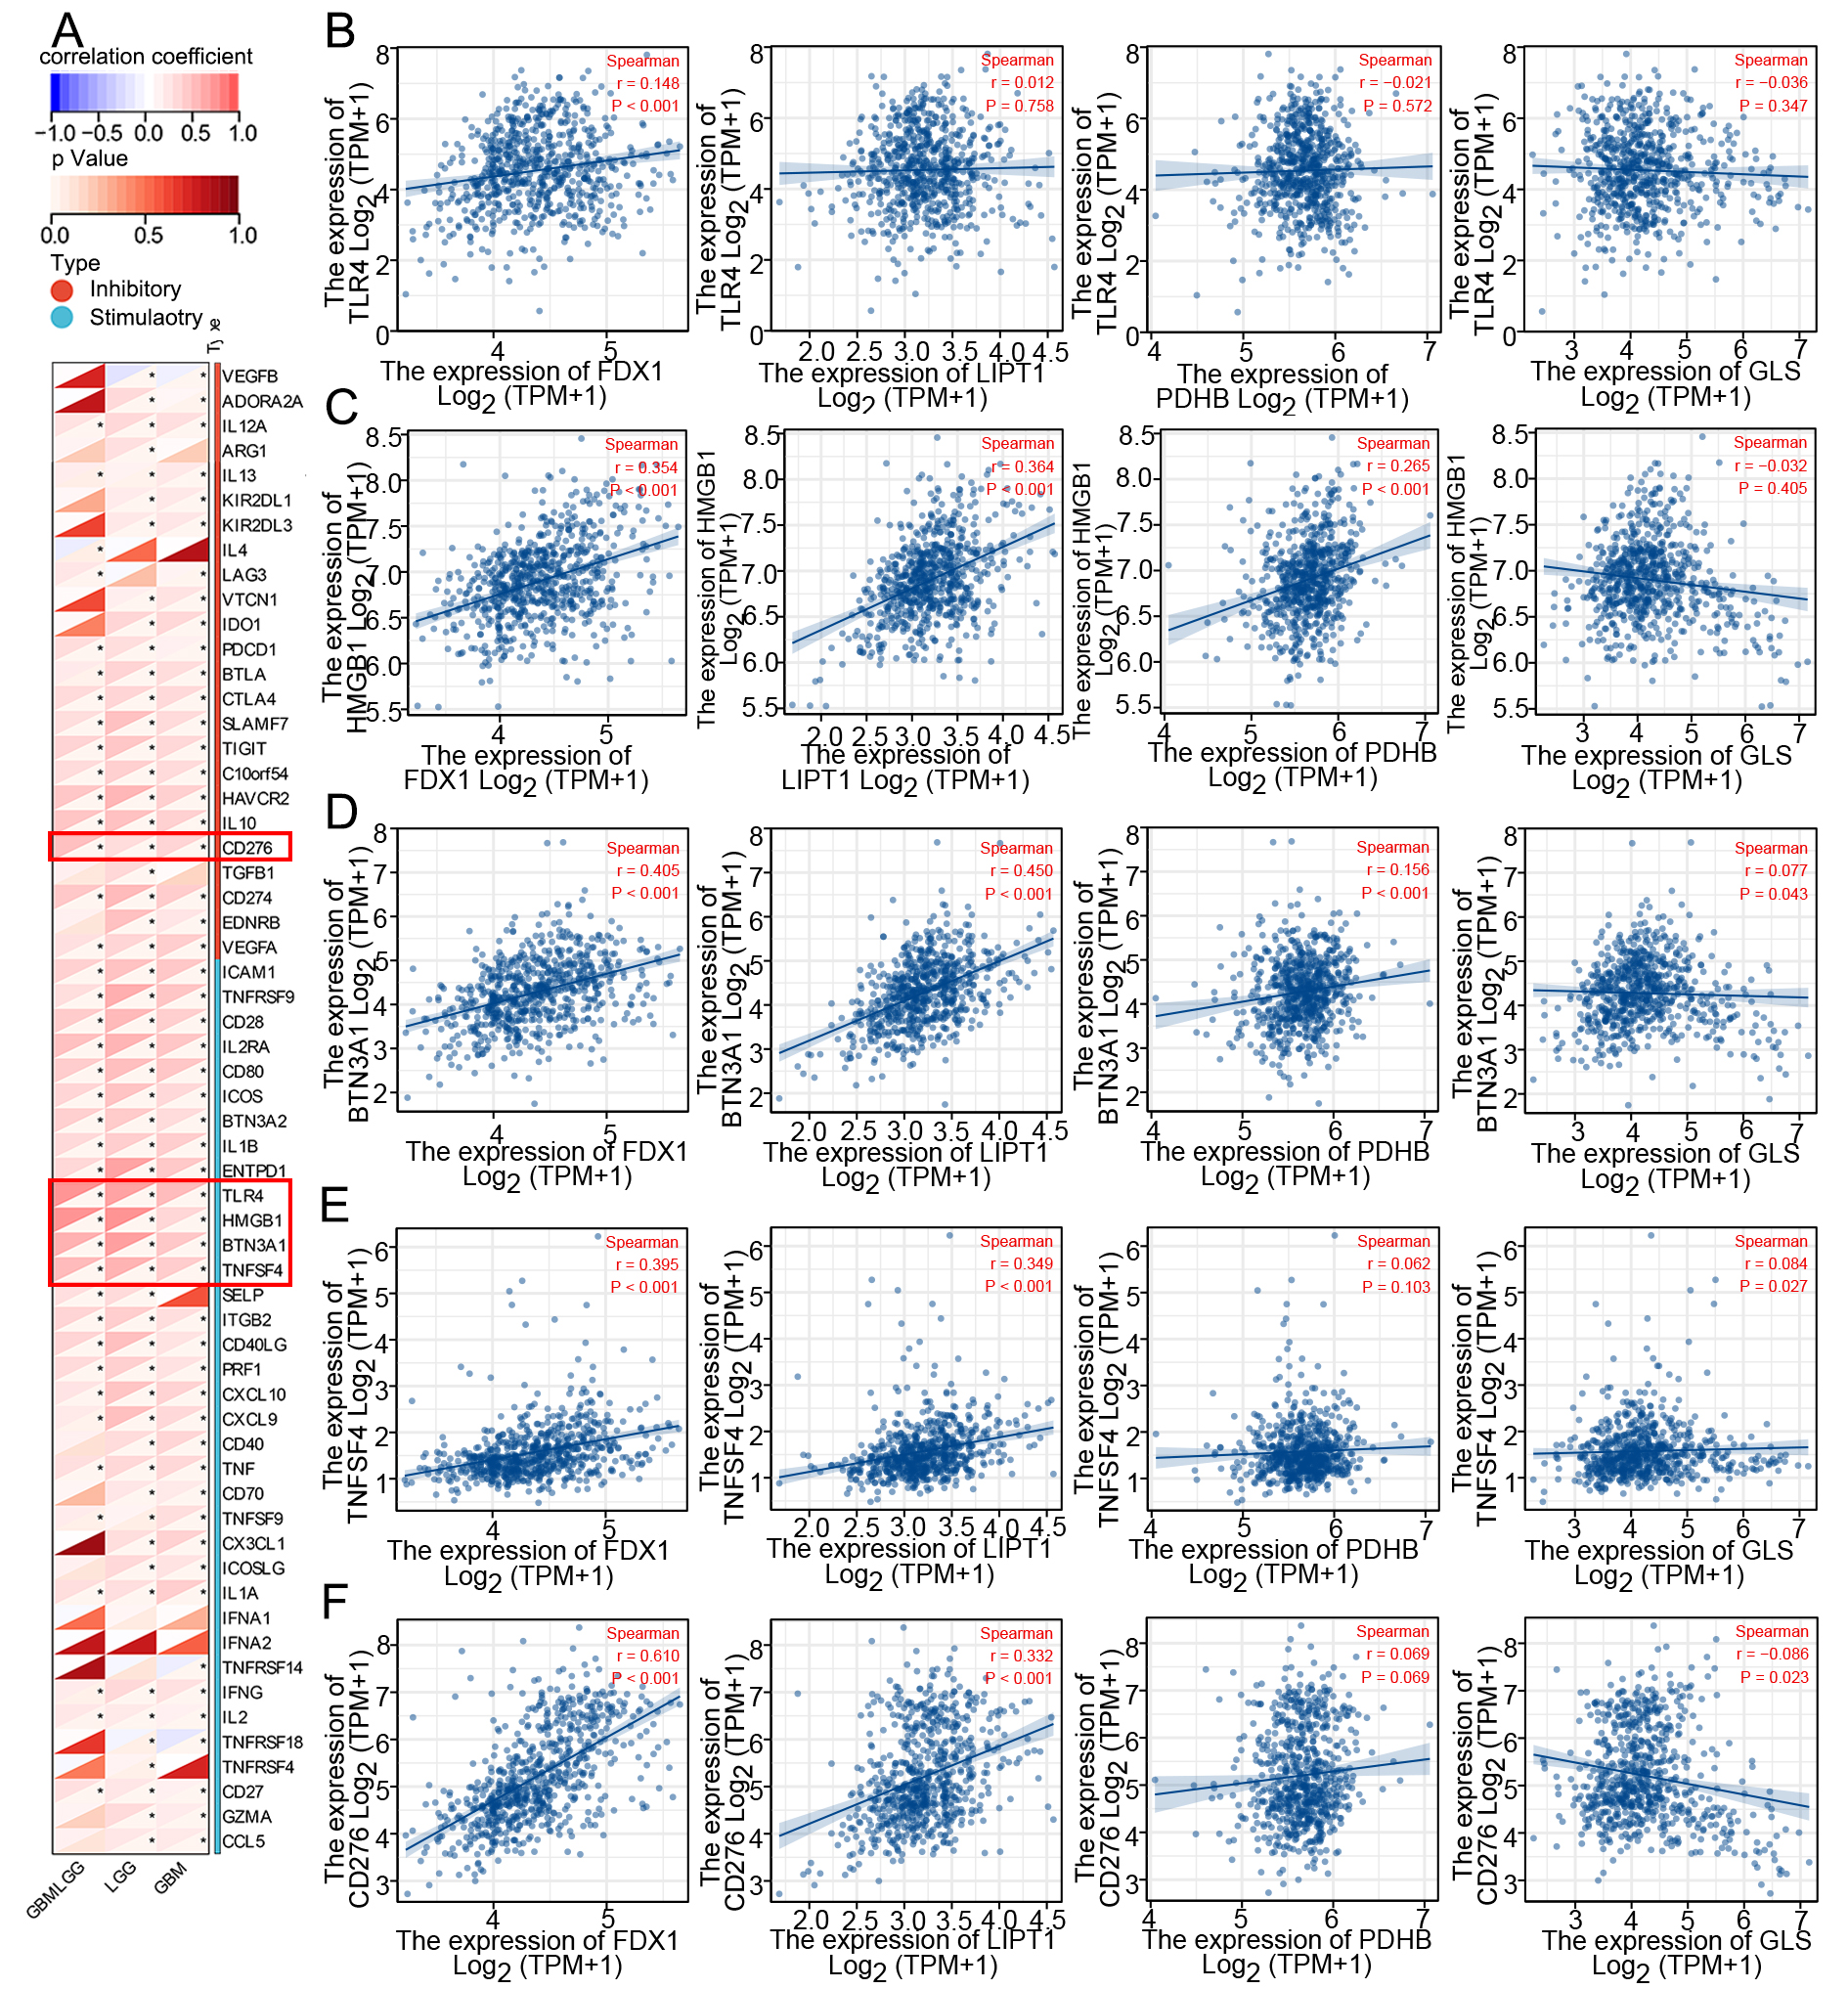
Figure 8. Correlation of CRGs with immune checkpoints in glioma. (A) Correlation between CRGs and immune checkpoint expression; (B-F) Correlation of FDX1, LIPT1, PDHB and GLS with TLR4, HMGB1, BTN3A1, TNFSF4, and CD276 expression in glioma, respectively. CRGs: Cuproptosis-related genes; GLS: glutaminase.
Differential expression of CRGs in different clinical grades and histological stages of gliomas
As illustrated in Figure 9, expression levels of FDX1 and LIPT1 varied significantly across pathologic stages and histological grades of GBM. Both genes exhibited an increasing trend with advancing clinical grade, whereas GLS expression decreased specifically in WHO grade IV tumors. Compared with other histological grades, GBM displayed higher expression of FDX1 and LIPT1. Although not statistically significant, GLS expression was lowest in GBM. These findings revealed a potential correlation between the expression of CRGs and glioma clinical and histological grading.
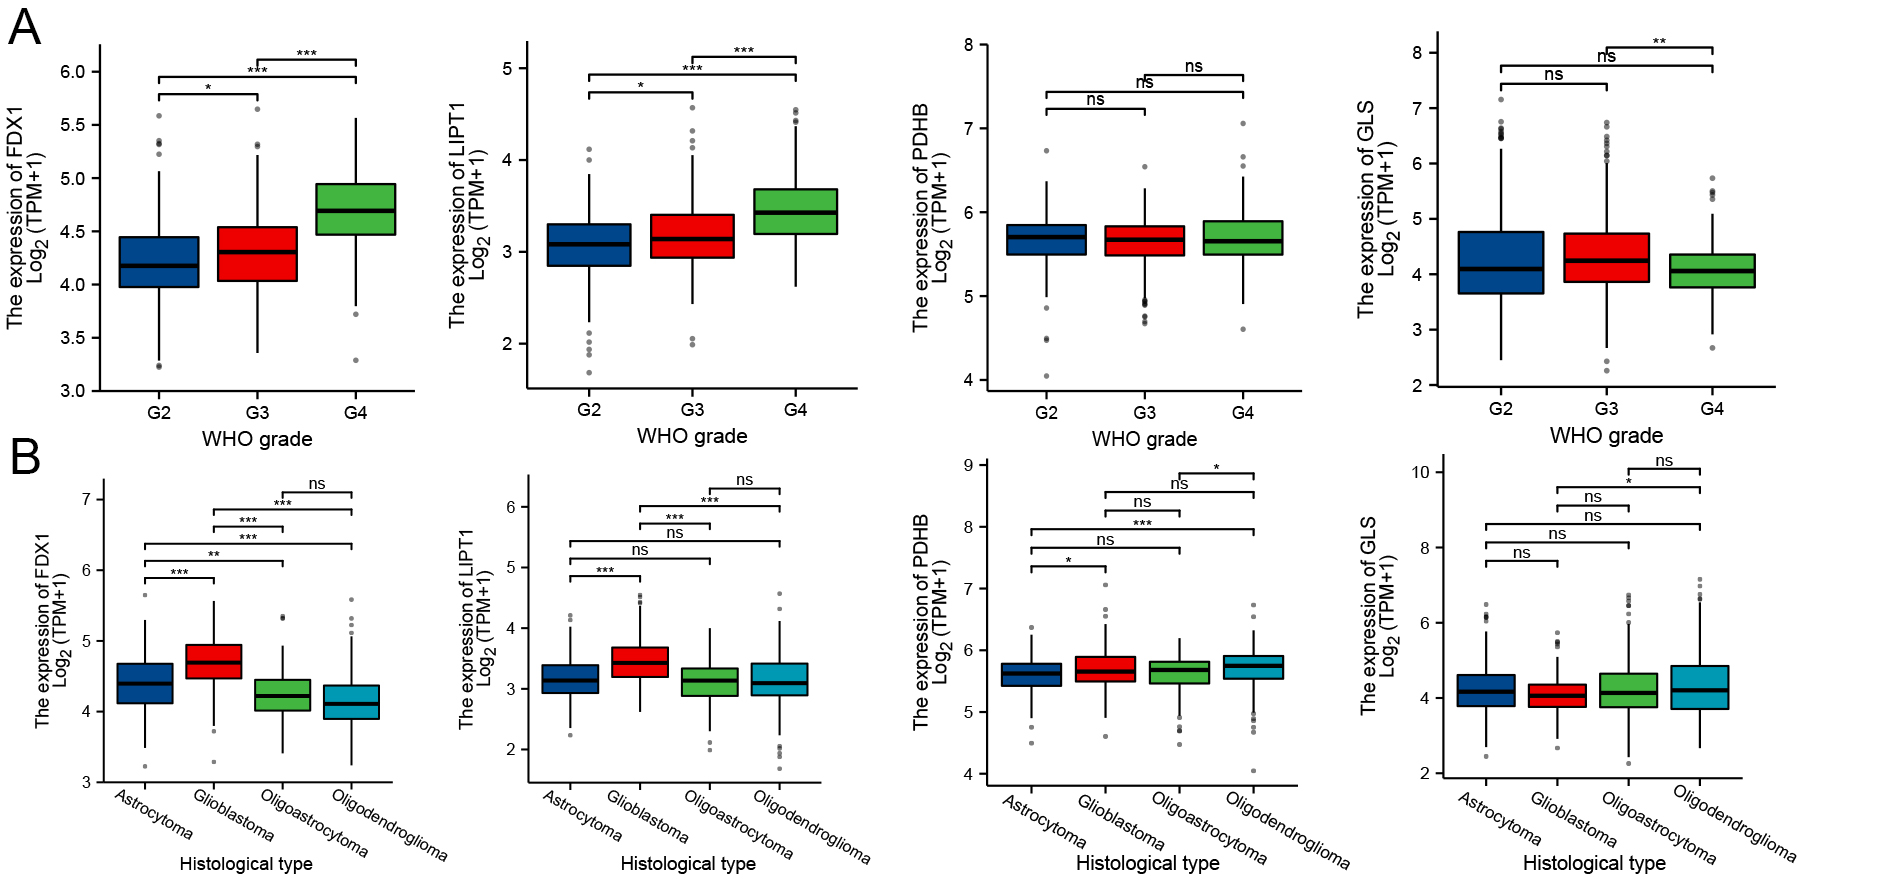
Figure 9. Expression of CRGs across GBM pathological stages and histologic grades (A) Expression of FDX1, LIPT1, PDHB, and GLS at different pathological stages; (B) Expression across histologic grades of GBM. *P < 0.05, **P < 0.01, ***P < 0.001, ns: Not significant; CRGs: Cuproptosis-related genes; GLS: glutaminase; GBM: glioblastoma.
Screening and validation of diagnostic biomarkers among CRGs in gliomas
WGCNA analysis was performed on GEO datasets to identify genes commonly associated with glioma diagnosis. To ensure scale-free network topology (scale-free R2 = 0.86), the optimal soft-thresholding power β was set to 7 [Figure 10A]. Genes with similar expression patterns were grouped into 31 modules with a minimum module size of 30 genes [Figure 10B]. Among these, the green module (ME = -0.66, P < 0.001) showed the strongest positive correlation with glioma [Figure 10C]. From this module, 71 candidate genes were identified as potentially important [Figure 10D]. Integrating WCGNA results with CRGs, we selected a single gene, GLS, as a diagnostic marker for glioma [Figure 10E]. Validation using TCGA and GTEx data indicated an AUC of 0.692 for GLS [Figure 10F]. Thus, GLS (AUC = 0.692) may serve as a supplementary diagnostic biomarker. When combined with factors such as IDH mutation status, CDKN2A/CDKN2B homozygous deletions, and radiomics[46], a multidisciplinary approach could improve the accuracy of glioma diagnosis and prognosis.
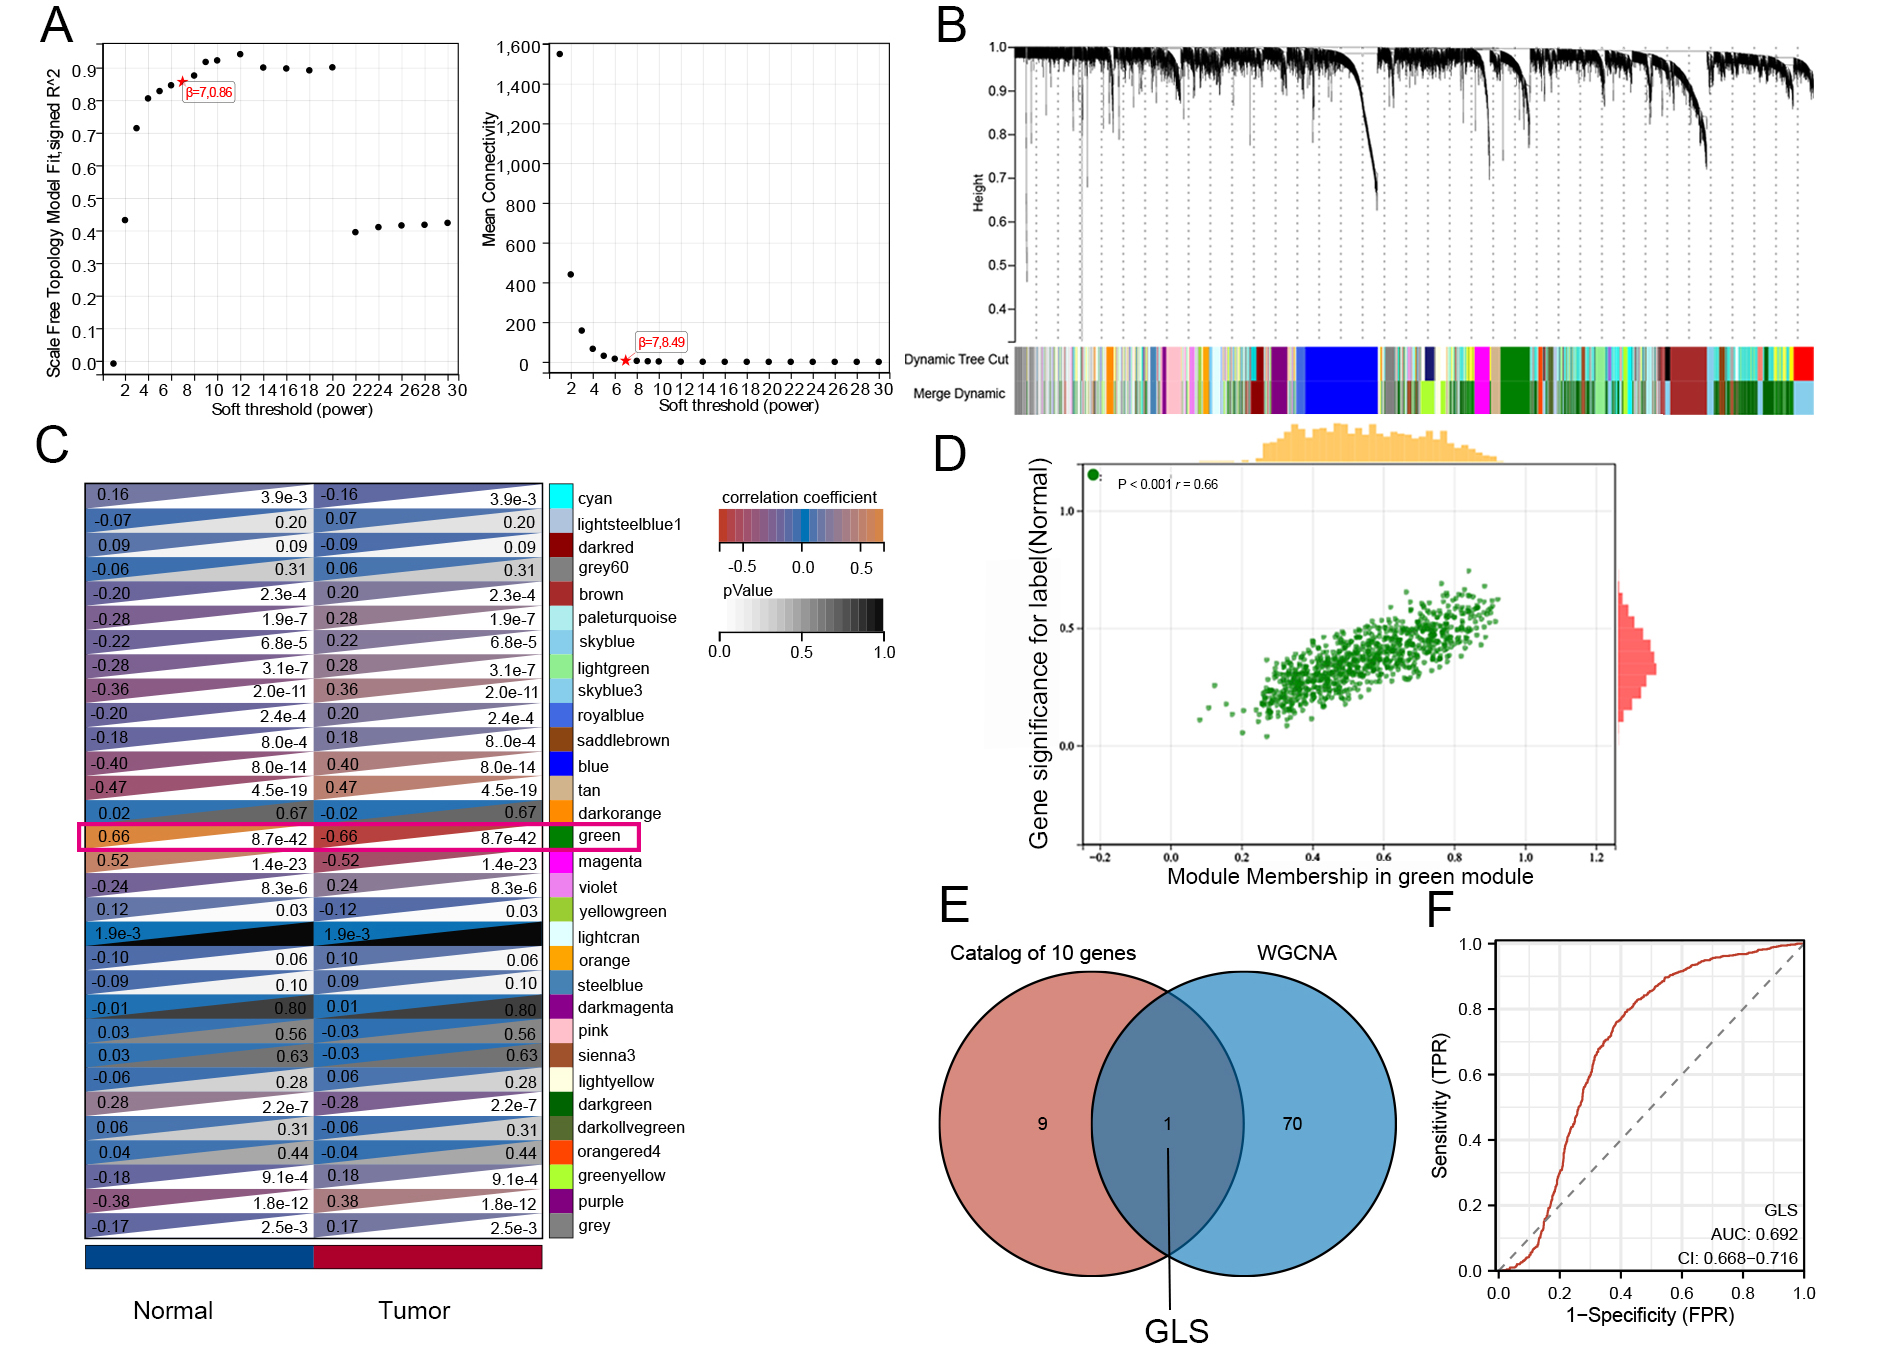
Figure 10. Weighted gene co-expression network analysis (WGCNA). (A) Scale-free topology model fit index versus soft-thresholding power; (B) Cluster dendrogram of genes with modules indicated by different colors; (C) Heatmap of module-trait correlations between clinical features and gene modules; (D) Scatterplot showing correlation between module membership (MM) and gene significance (GS) in the green module; (E) Venn diagram of intersecting genes between diagnostic CRGs and WGCNA modules; (F) ROC curve showing the diagnostic performance of GLS. CRGs: Cuproptosis-related genes; GLS: glutaminase; ROC: receiver operating characteristic.
GLS gene alterations in gliomas and their prognostic implications
Genetic data from multiple glioma patient databases were integrated and analyzed [Figure 11A]. The mutation frequency of GLS was 0.4% across cases. Using log-rank tests and predictive analyses, we found that OS was longer in patients without GLS mutations compared to those with mutations, while DFS was unaffected [Figure 11B and C].
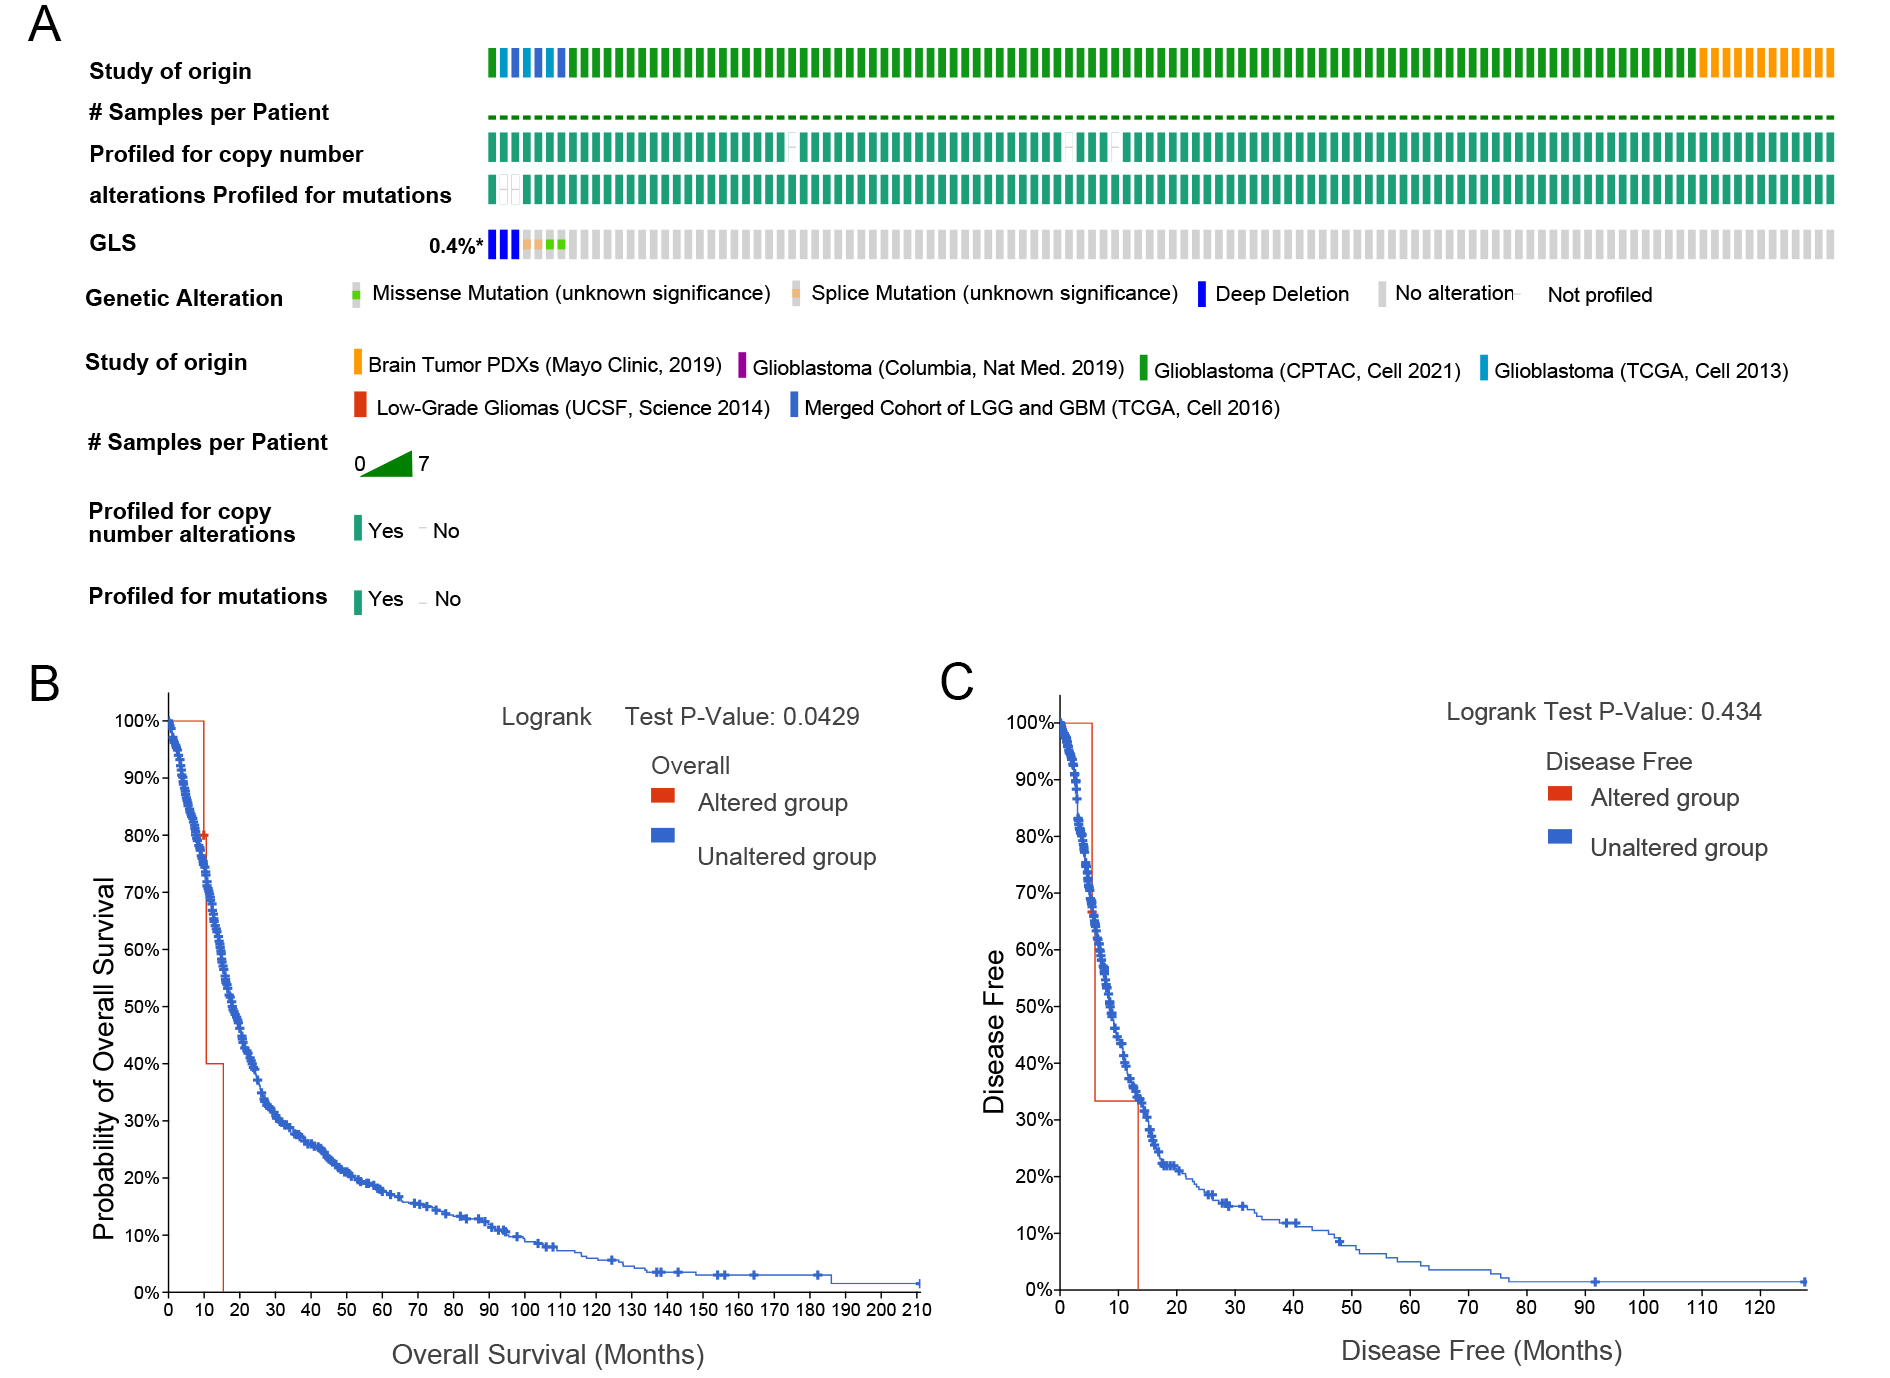
Figure 11. Genetic alterations of GLS in glioma and survival analysis (A) GLS genetic alterations; (B) Association between GLS alterations and overall survival (OS); (C) Association with disease-free survival (DFS). GLS: Glutaminase.
Analysis of GLS expression and immune cell infiltration
Immune cells are critical components of the tumor microenvironment and influence glioma prognosis. Using TIMER database data, we evaluated correlations between GLS expression and immune infiltration in gliomas. According to TCGA data, infiltration scores were calculated for six immune cell types: B cells, CD4+ T cells, CD8+ T cells, neutrophils, macrophages, and dendritic cells. Elevated GLS expression was linked to increased B cell infiltration. Furthermore, higher GLS levels correlated with increased infiltration of CD4+ T cells, CD8+ T cells, neutrophils, and dendritic cells.
Kaplan-Meier analysis revealed that GBM patients with high GLS expression and low macrophage infiltration showed the best OS, as shown by the combined analysis of GLS expression with macrophage and CD4+ T cell infiltration scores [Figure 12A and B]. In LGG patients, the highest OS was observed in those with low GLS expression and low infiltration scores of CD4+ T cells, CD8+ T cells, macrophages, or neutrophils [Figure 12C-F]. Interestingly, in LGG patients, better OS also correlated with low GLS expression combined with high B cell infiltration [Figure 12G], and with high GLS expression combined with low dendritic cell infiltration [Figure 12H].
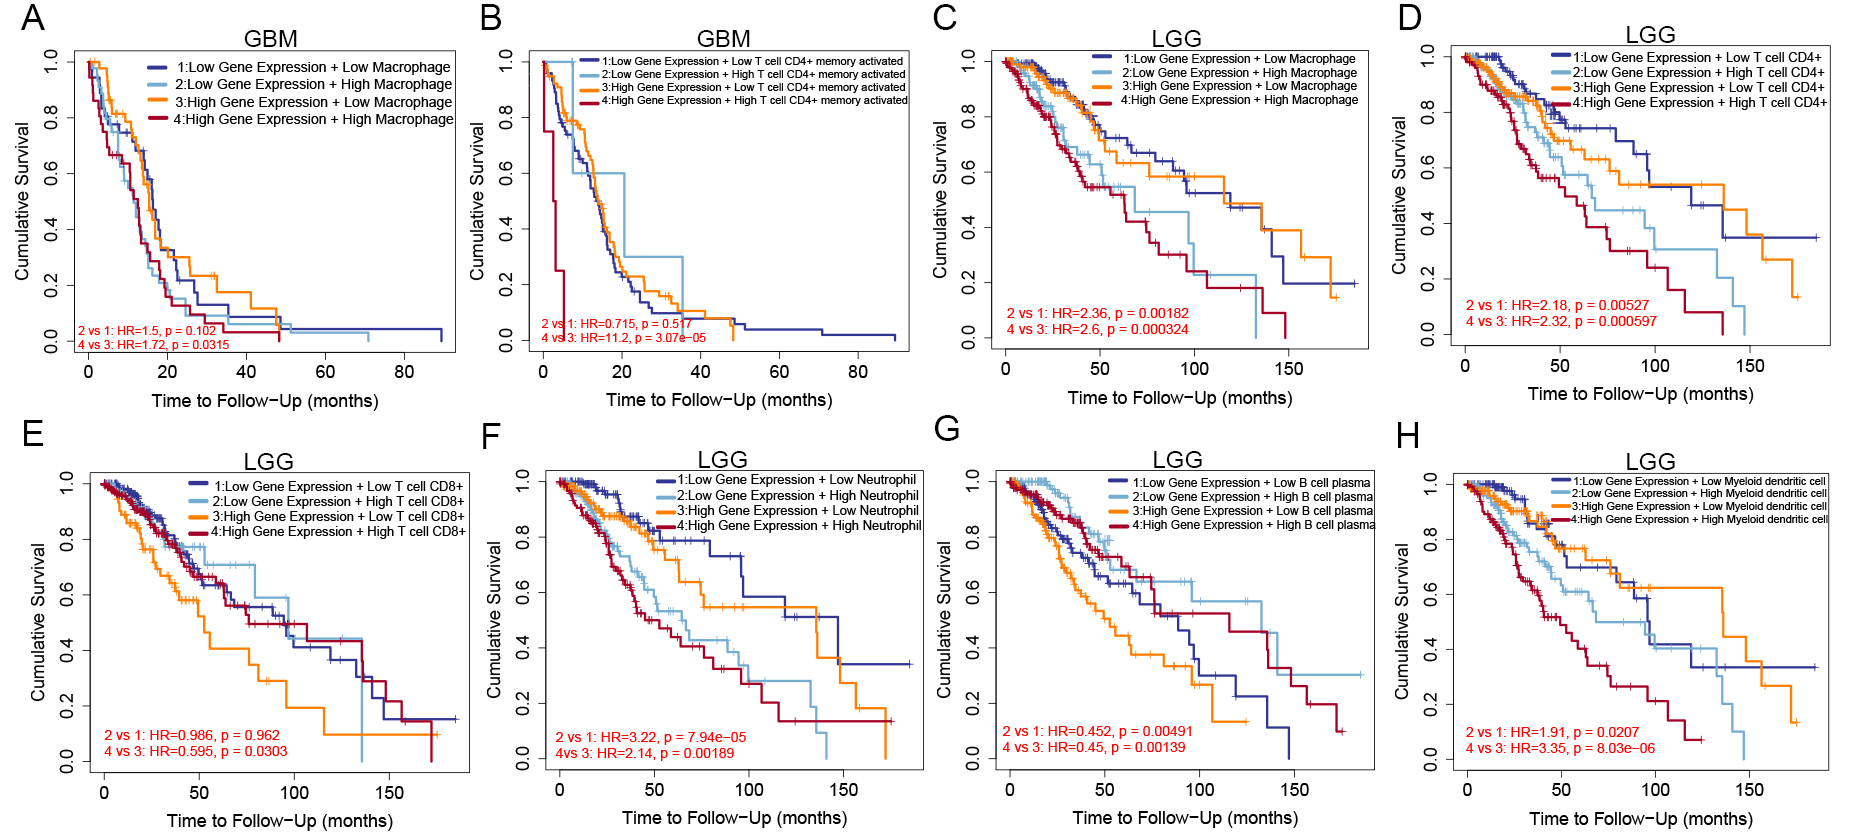
Figure 12. Kaplan-Meier plots of GLS expression and immune cell infiltration scores. In GBM patients: (A) OS based on macrophage score; (B) OS based on CD4+ T cell score; In LGG patients: (C-H) OS based on scores of macrophages, CD4+ T cells, CD8+ T cells, neutrophils, B cells, and dendritic cells. GLS: Glutaminase; GBM: glioblastoma; OS: overall survival; LGG: low-grade glioma.
Functional enrichment analysis of GLS-associated genes
To elucidate the biological role of GLS, GO and KEGG pathway analyses were performed. Key biological processes related to GLS included regulation of ion transport across membranes, synaptic signaling, and chemical synaptic transmission. Cellular components predominantly involved transporter complexes, transmembrane transport structures, and ion channel complexes. Molecular functions mainly encompassed ion channel activity, matrix-specific channel activity, and passive transmembrane transporter protein activity [Figure 13A-C]. KEGG pathway enrichment linked GLS primarily with neuroactive ligand-receptor interaction pathways [Figure 13D].
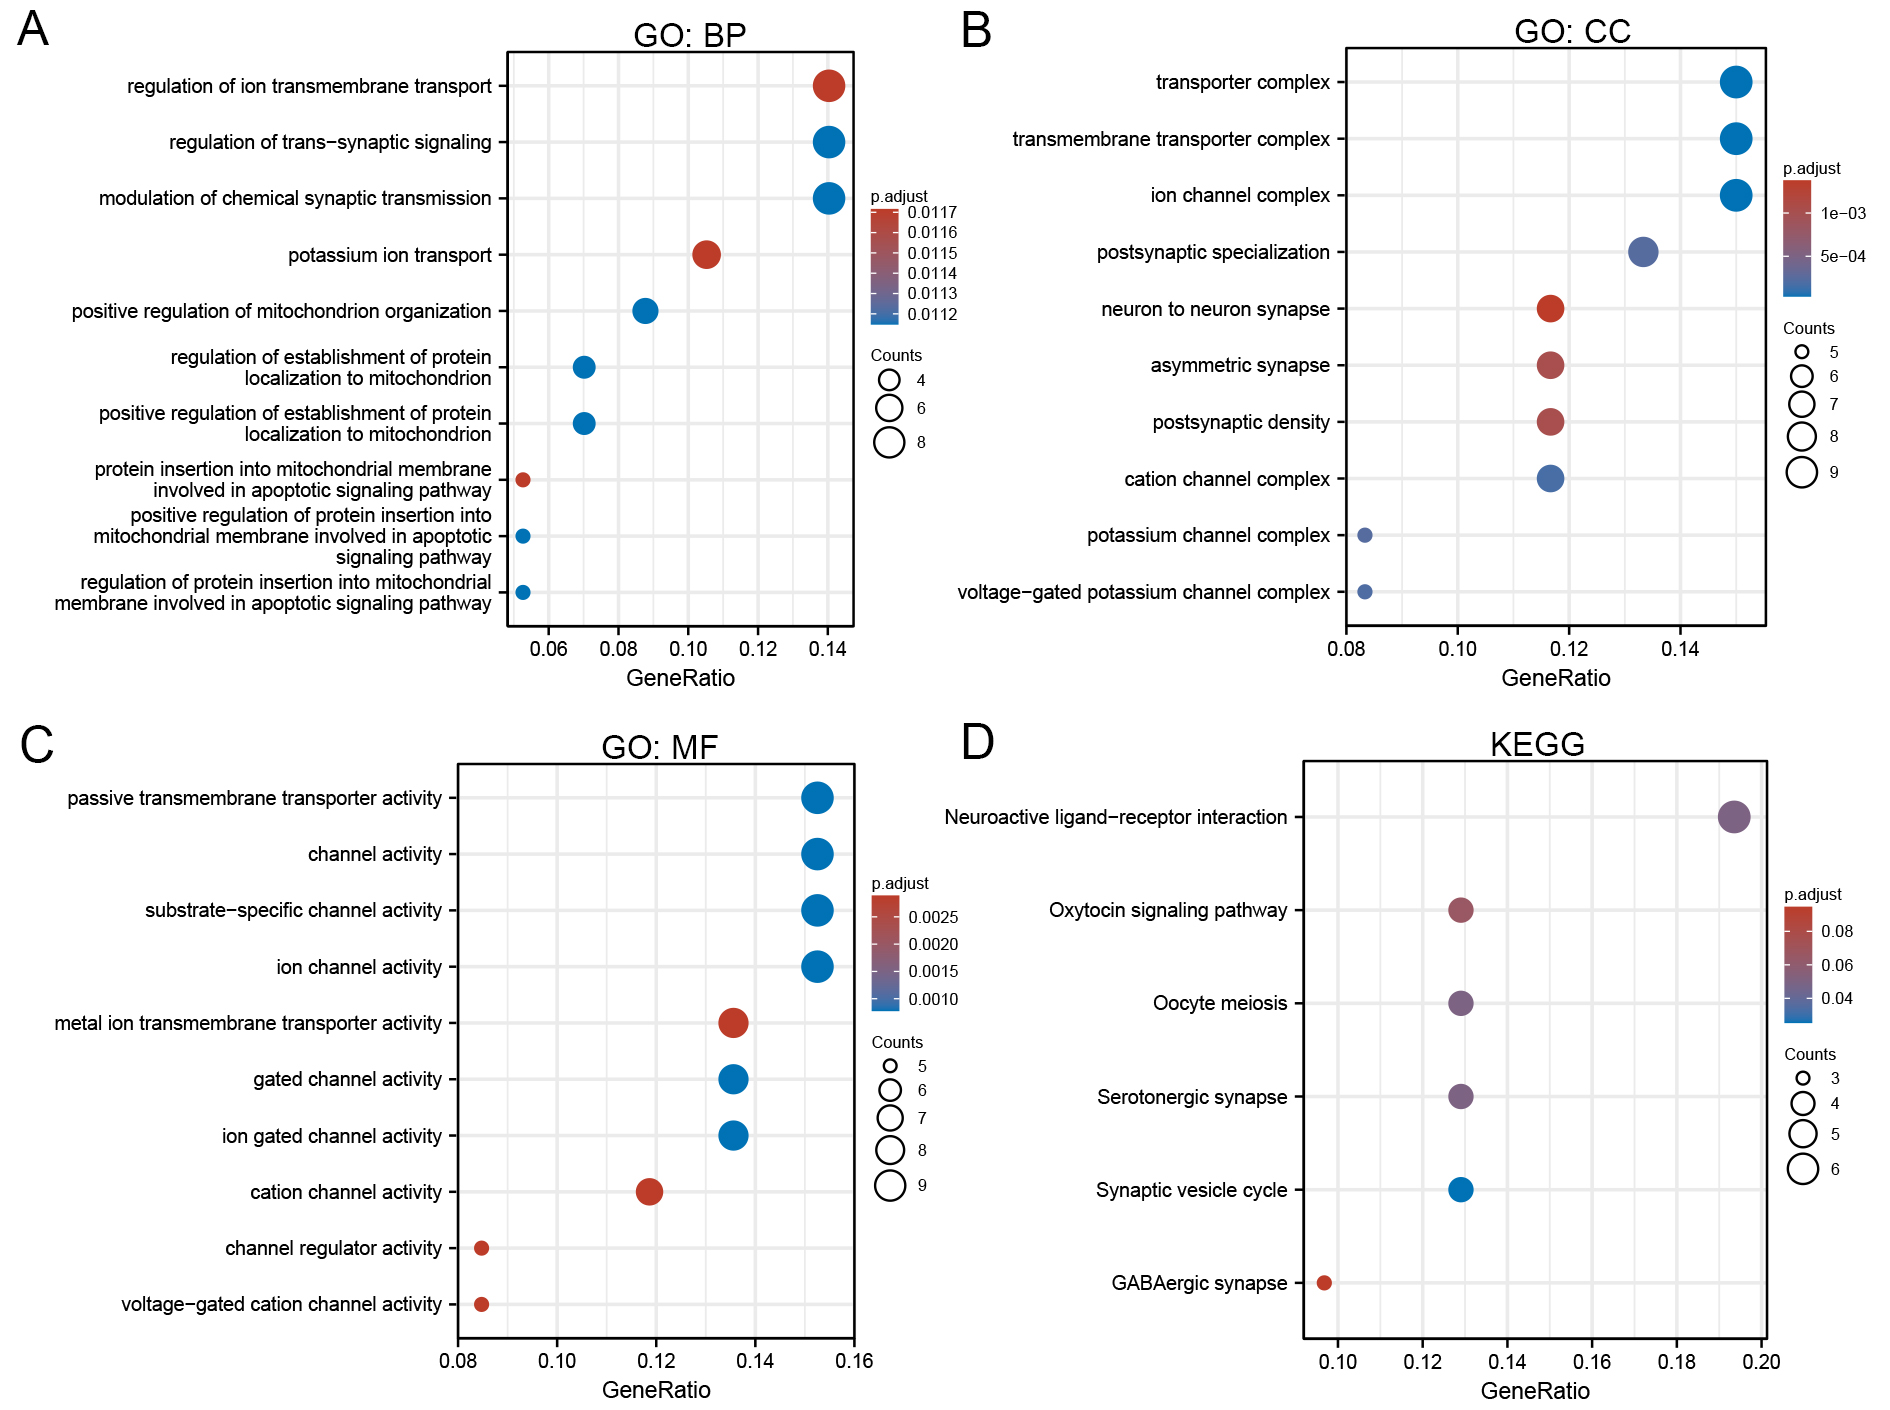
Figure 13. Functional enrichment analysis of GLS-associated genes. (A-C) GO enrichment analysis; (D) KEGG pathway enrichment. BP: Biological process; CC: cellular component; MF: molecular function; GLS: glutaminase; KEGG: kyoto encyclopedia of genes and genomes.
Reduced GLS expression in glioblastoma tissues
To validate our findings, GLS expression was examined in glioblastoma and normal tissues. Immunohistochemical data from the HPA database showed decreased GLS protein levels in glioblastoma tissues compared to normal controls [Figure 14A and B]. Additionally, qRT-PCR results [Figure 14C] confirmed reduced GLS expression in tumor tissues, consistent with our bioinformatics analysis.
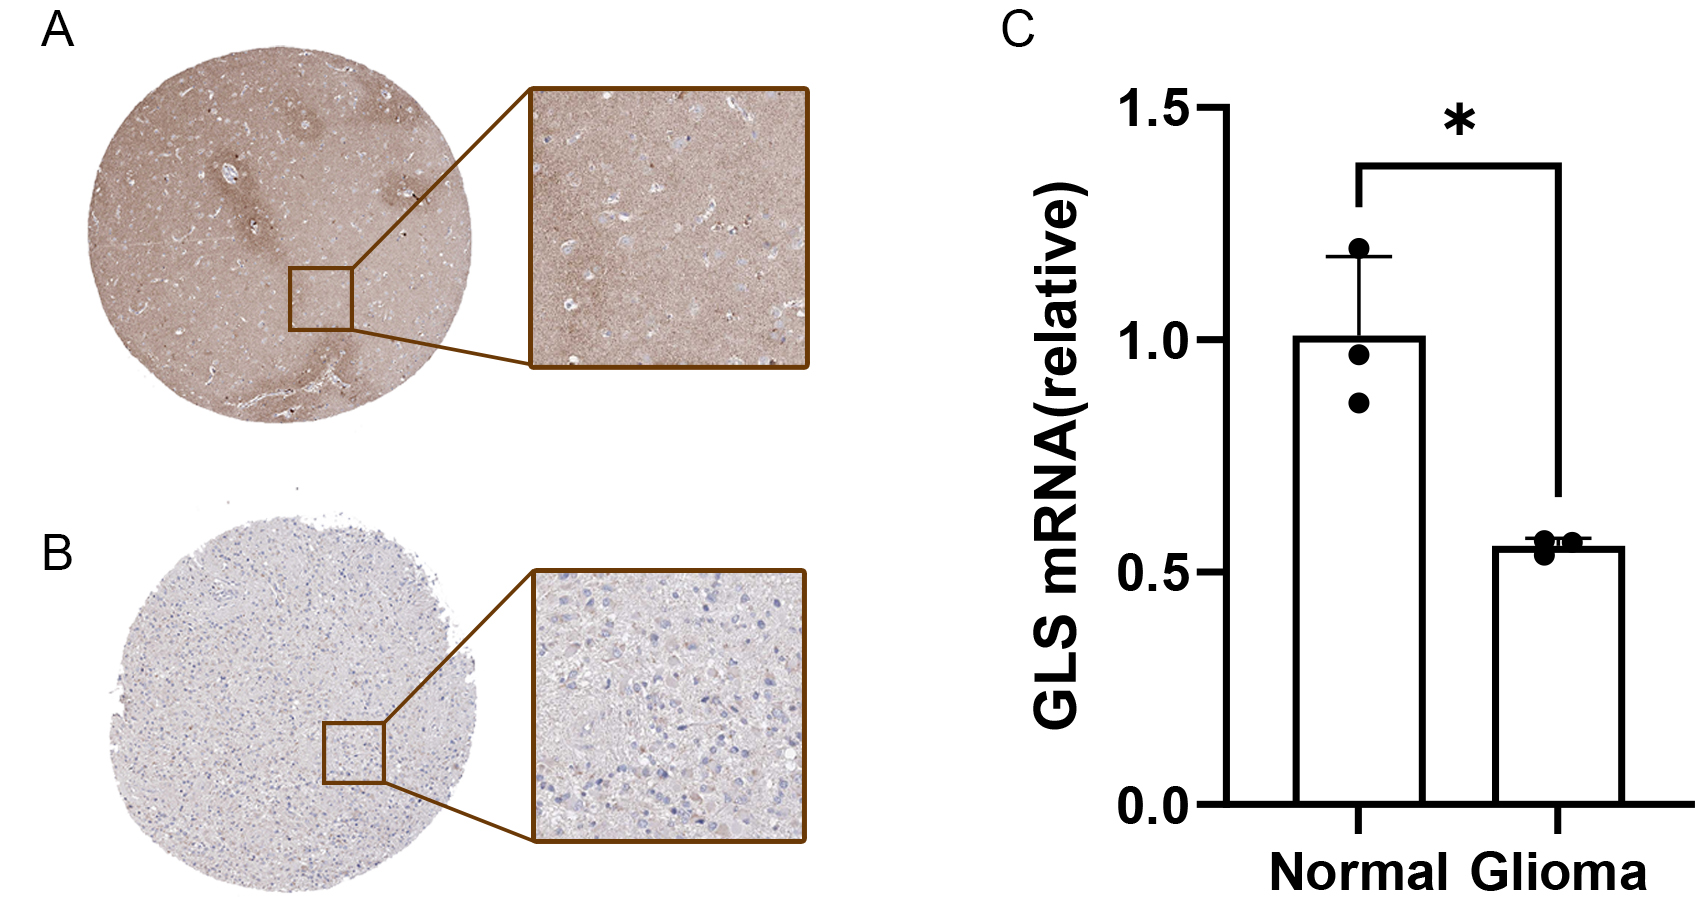
Figure 14. Expression of GLS in glioblastoma tissues. (A) Immunohistochemical analysis of GLS in normal tissues and (B) glioma tissues from the HPA database; (C) qRT-PCR validation of GLS expression in normal vs. glioma tissues. *P < 0.05. GLS: Glutaminase; HPA: human protein atlas.
DISCUSSION
This study explored the expression patterns of ten CRGs in gliomas and investigated their potential prognostic implications. Additionally, we developed a novel prognostic score specifically related to cuproptosis. Using WGCNA, we further investigated the underlying mechanisms of CRGs, their association with immune infiltration, and the potential prognostic significance of GLS as a diagnostic biomarker in gliomas.
Initially, we assessed the differential expression of the ten CRGs between normal and glioma tissues to construct a predictive model for gliomas based on CRG expression. Our analysis revealed that only GLS showed reduced expression in tumor tissues. Consistent with this, GLS was identified as a key gene through WGCNA. These findings support the involvement of CRGs in GBM. GLS plays a central role in the tricarboxylic acid cycle, facilitating intracellular energy production and biosynthesis essential for tumor cell growth and metastasis[47,48]. As the rate-limiting enzyme, GLS mainly catalyzes the hydrolysis of glutamine to glutamate[49]. Glutamate functions as a key neurotransmitter and a hallmark metabolite in tumorigenesis, contributing to synaptic communication[50]. However, the precise mechanisms of this metabolic reprogramming by cancer cells to meet the bioenergetic and biosynthetic demands of uncontrolled proliferation remain unclear[49]. Targeting tumor metabolism is crucial for effective tumor immunity and therapy.
The tumor metabolic microenvironment significantly influences cancer progression, metastasis, and invasion[51]. Previous research has shown that the NF-kB signaling pathway regulates GLS expression in response to i Brucella abortus, inducing a macrophage phenotype switch from proinflammatory M1 to
CD276, a member of the B7 superfamily identified in 2001, inhibits T cell activation and contributes to immune tolerance[54,55]. High glutamate levels in the tumor microenvironment have been shown to suppress T cell function[56], while blocking glutamine metabolism can enhance CD8+ T cell antitumor activity[57]. We hypothesize that CD276-mediated inhibition of T cell activation is linked to intracellular glutamine accumulation, consistent with the observed inverse correlation between GLS and CD276 in GBM. Concurrently, qPCR data confirmed reduced GLS expression in GBM compared to healthy brain tissue. These results indicate that high CD276 expression predicts GBM malignancy and highlight its critical role in disease progression.
Measurement of serum GLS activity or related metabolites such as glutamate may aid in cancer diagnosis and monitoring treatment efficacy. Designing GLS-targeted radioactive probes could facilitate in vivo localization of metabolically active tumor regions using imaging modalities such as positron emission tomography-computed tomography (PET-CT).
This study has limitations. First, the majority of data were derived from public databases such as TCGA and GEO, which, despite their richness, are subject to biases and heterogeneity due to variations in sample preparation, composition, platforms, and experimental designs[58]. Second, while our findings support the potential of GLS as a glioma biomarker, larger datasets with comprehensive clinical prognostic information are needed to validate these results robustly. Third, although we identified a possible link between immune modulation and CRGs in gliomas, further research is required to fully elucidate the complex immune interactions involved. Comprehensive clinical sample analysis is necessary to understand how CRGs influence tumor immunity. In conclusion, despite these limitations, our data underscore the importance of CRGs in glioma biology. Future studies will aim to reduce bias by expanding sample collection, optimizing stratified sampling strategies, and conducting multicenter collaborative research to increase data diversity and sample size. Integration of multi-omics approaches, including transcriptomics and proteomics, will further clarify the molecular mechanisms underlying GLS gene alterations.
CONCLUSIONS
This study provides a comprehensive analysis of the relationship between CRGs and molecular alterations in gliomas. Our findings highlight the significant role of CRGs in predicting glioma prognosis. The prognostic risk score derived from CRG expression profiles demonstrated strong predictive power and correlated with immune infiltration levels and GLS expression in glioma patients. These insights may guide the development of therapeutic strategies targeting cuproptosis-related pathways for glioma prevention and treatment. This research advances our understanding of CRGs in glioma and paves the way for novel therapeutic approaches. Based on these findings, priority should be given to investigating tyrosine diterpenoid derivatives for inducing glioma cell apoptosis via GLS[10], as well as exploring the role of GLS overexpression in suppressing glioma metabolic activity[11]. Future work will concentrate on collaboration with pharmaceutical companies to develop isomer-selective compounds and small-molecule agonists targeting GLS.
DECLARATIONS
Authors’ contributions
Conceptualization, writing-review and editing: Zhu J, Wu J
Methodology, software: Zhu J
Validation: Wu J, Yu Z, Zhu J
Formal analysis: Gu Y, Zhai W
Investigation: Gu Y, Sun L
Data curation: Shen X
Writing-original draft preparation: Zhu J, Shen X, Gu Y
Visualization, project administration: Wu J
Supervision, resources, funding acquisition: Yu Z
All authors have read and agreed to the published version of the manuscript.
Availability of data and materials
The datasets supporting the conclusions of this article are available in the GEO and TCGA databases.
Financial support and sponsorship
This work was supported by the Medical and Health Science and Technology Innovation Project of the Suzhou Health Commission [grant number: SKY2022002], and the Special Funds for Science and Technology Programs of Jiangsu Provincial Department of Science and Technology [grant number: BE2023712].
Conflicts of interest
All authors declared that there are no conflicts of interest.
Ethics approval and consent to participate
This is a bioinformatics study. The Ethics Committee of First Affiliated Hospital of Soochow University has confirmed that no ethical approval is required.
Consent for publication
Not applicable.
Copyright
© The Author(s) 2025.
Supplementary Materials
REFERENCES
1. Zhang B, Xie L, Liu J, Liu A, He M. Construction and validation of a cuproptosis-related prognostic model for glioblastoma. Front Immunol. 2023;14:1082974.
2. Samioti SE, Benos LT, Sarris IE. Effect of fractal-shaped outer boundary of glioblastoma multiforme on drug delivery. Comput Methods Programs Biomed. 2019;178:191-9.
3. Polivka J Jr, Polivka J, Holubec L, et al. Advances in experimental targeted therapy and immunotherapy for patients with glioblastoma multiforme. Anticancer Res. 2017;37:21-33.
5. Garcia CR, Slone SA, Dolecek TA, Huang B, Neltner JH, Villano JL. Primary central nervous system tumor treatment and survival in the United States, 2004-2015. J Neurooncol. 2019;144:179-91.
6. Zhao YY, Chen SH, Hao Z, Zhu HX, Xing ZL, Li MH. A nomogram for predicting individual prognosis of patients with low-grade glioma. World Neurosurg. 2019;130:e605-12.
7. Kiran M, Chatrath A, Tang X, Keenan DM, Dutta A. A prognostic signature for lower grade gliomas based on expression of long non-coding RNAs. Mol Neurobiol. 2019;56:4786-98.
8. Razzak M. Genetics: new molecular classification of gastric adenocarcinoma proposed by The Cancer Genome Atlas. Nat Rev Clin Oncol. 2014;11:499.
9. Deng S, Li Y, Yi G, et al. Overexpression of COX7A2 is associated with a good prognosis in patients with glioma. J Neurooncol. 2018;136:41-50.
10. Sonkin D, Thomas A, Teicher BA. Cancer treatments: past, present, and future. Cancer Genet. 2024;286-287:18-24.
11. Li SR, Bu LL, Cai L. Cuproptosis: lipoylated TCA cycle proteins-mediated novel cell death pathway. Signal Transduct Target Ther. 2022;7:158.
12. Tsvetkov P, Coy S, Petrova B, et al. Copper induces cell death by targeting lipoylated TCA cycle proteins. Science. 2022;375:1254-61.
13. Wang W, Li S, Huang Y, Guo J, Sun L, Sun G. Comprehensive analysis of the potential biological significance of cuproptosis-related gene LIPT2 in pan-cancer prognosis and immunotherapy. Sci Rep. 2023;13:22910.
14. Kim BE, Nevitt T, Thiele DJ. Mechanisms for copper acquisition, distribution and regulation. Nat Chem Biol. 2008;4:176-85.
15. Rae TD, Schmidt PJ, Pufahl RA, Culotta VC, O’Halloran TV. Undetectable intracellular free copper: the requirement of a copper chaperone for superoxide dismutase. Science. 1999;284:805-8.
16. Denoyer D, Masaldan S, La Fontaine S, Cater MA. Targeting copper in cancer therapy: ‘copper that cancer’. Metallomics. 2015;7:1459-76.
17. Trammell R, Rajabimoghadam K, Garcia-Bosch I. Copper-promoted functionalization of organic molecules: from biologically relevant Cu/O2 model systems to organometallic transformations. Chem Rev. 2019;119:2954-3031.
18. Tang D, Chen X, Kroemer G. Cuproptosis: a copper-triggered modality of mitochondrial cell death. Cell Res. 2022;32:417-8.
19. Wang C, Zhou Y. Cuproptosis-related gene subtypes predict prognosis in patients with head and neck squamous cell carcinoma. J Otolaryngol Head Neck Surg. 2023;52:58.
20. Shi B, Zhang W, Wang T, Cui Z. The therapeutic and prognostic role of cuproptosis-related genes in triple negative breast cancer. BMC Bioinformatics. 2023;24:223.
21. Wang S, Xing N, Meng X, Xiang L, Zhang Y. Comprehensive bioinformatics analysis to identify a novel cuproptosis-related prognostic signature and its ceRNA regulatory axis and candidate traditional Chinese medicine active ingredients in lung adenocarcinoma. Front Pharmacol. 2022;13:971867.
22. Long S, Wang Y, Chen Y, Fang T, Yao Y, Fu K. Pan-cancer analysis of cuproptosis regulation patterns and identification of mTOR-target responder in clear cell renal cell carcinoma. Biol Direct. 2022;17:28.
23. Liu JY, Liu LP, Li Z, Luo YW, Liang F. The role of cuproptosis-related gene in the classification and prognosis of melanoma. Front Immunol. 2022;13:986214.
24. Zhou Z, Zhou Y, Liu D, Yang Q, Tang M, Liu W. Prognostic and immune correlation evaluation of a novel cuproptosis-related genes signature in hepatocellular carcinoma. Front Pharmacol. 2022;13:1074123.
25. Liu H, Tang T. Pan-cancer genetic analysis of cuproptosis and copper metabolism-related gene set. Front Oncol. 2022;12:952290.
27. Gene expression omnibus.Available from: https://www.ncbi.nlm.nih.gov/geo/ [Last accessed on 8 Aug 2025].
28. Frankish A, Diekhans M, Ferreira AM, et al. GENCODE reference annotation for the human and mouse genomes. Nucleic Acids Res. 2019;47:D766-73.
29. Goldman MJ, Craft B, Hastie M, et al. Visualizing and interpreting cancer genomics data via the Xena platform. Nat Biotechnol. 2020;38:675-8.
30. Cibulskis K, Lawrence MS, Carter SL, et al. Sensitive detection of somatic point mutations in impure and heterogeneous cancer samples. Nat Biotechnol. 2013;31:213-9.
31. Mayakonda A, Lin DC, Assenov Y, Plass C, Koeffler HP. Maftools: efficient and comprehensive analysis of somatic variants in cancer. Genome Res. 2018;28:1747-56.
32. Mermel CH, Schumacher SE, Hill B, Meyerson ML, Beroukhim R, Getz G. GISTIC2.0 facilitates sensitive and confident localization of the targets of focal somatic copy-number alteration in human cancers. Genome Biol. 2011;12:R41.
33. Gravendeel LA, Kouwenhoven MC, Gevaert O, et al. Intrinsic gene expression profiles of gliomas are a better predictor of survival than histology. Cancer Res. 2009;69:9065-72.
34. Kruthika BS, Jain R, Arivazhagan A, et al. Transcriptome profiling reveals PDZ binding kinase as a novel biomarker in peritumoral brain zone of glioblastoma. J Neurooncol. 2019;141:315-25.
36. Yu G, Wang LG, Han Y, He QY. clusterProfiler: an R package for comparing biological themes among gene clusters. OMICS. 2012;16:284-7.
37. Zhang R, Chen C, Dong X, et al. Independent validation of early-stage non-small cell lung cancer prognostic scores incorporating epigenetic and transcriptional biomarkers with gene-gene interactions and main effects. Chest. 2020;158:808-19.
38. Saldana DF, Feng Y. SIS: an R package for sure independence screening in ultrahigh-dimensional statistical models. J Stat Soft. 2018;83:1-25.
39. Heagerty PJ, Zheng Y. Survival model predictive accuracy and ROC curves. Biometrics. 2005;61:92-105.
40. Li T, Fan J, Wang B, et al. TIMER: a web server for comprehensive analysis of tumor-infiltrating immune cells. Cancer Res. 2017;77:e108-10.
41. Wang Q, Zhang J, Tu H, et al. Soluble immune checkpoint-related proteins as predictors of tumor recurrence, survival, and T cell phenotypes in clear cell renal cell carcinoma patients. J Immunother Cancer. 2019;7:334.
42. Langfelder P, Horvath S. WGCNA: an R package for weighted correlation network analysis. BMC Bioinformatics. 2008;9:559.
43. Gao J, Aksoy BA, Dogrusoz U, et al. Integrative analysis of complex cancer genomics and clinical profiles using the cBioPortal. Sci Signal. 2013;6:pl1.
44. Cerami E, Gao J, Dogrusoz U, et al. The cBio cancer genomics portal: an open platform for exploring multidimensional cancer genomics data. Cancer Discov. 2012;2:401-4.
45. Lánczky A, Nagy Á, Bottai G, et al. miRpower: a web-tool to validate survival-associated miRNAs utilizing expression data from 2178 breast cancer patients. Breast Cancer Res Treat. 2016;160:439-46.
47. Cluntun AA, Lukey MJ, Cerione RA, Locasale JW. Glutamine metabolism in cancer: understanding the heterogeneity. Trends Cancer. 2017;3:169-80.
48. Restall IJ, Cseh O, Richards LM, Pugh TJ, Luchman HA, Weiss S. Brain tumor stem cell dependence on glutaminase reveals a metabolic vulnerability through the amino acid deprivation response pathway. Cancer Res. 2020;80:5478-90.
49. Huang Q, Lian C, Dong Y, et al. SNAP25 inhibits glioma progression by regulating synapse plasticity via GLS-mediated glutaminolysis. Front Oncol. 2021;11:698835.
50. Rosati A, Poliani PL, Todeschini A, et al. Glutamine synthetase expression as a valuable marker of epilepsy and longer survival in newly diagnosed glioblastoma multiforme. Neuro Oncol. 2013;15:618-25.
51. Li X, Sun T, Jiang C. Intelligent delivery systems in tumor metabolism regulation: exploring the path ahead. Adv Mater. 2024;36:e2309582.
52. Zhao T, Zhang Z, Li Y, et al. Brucella abortus modulates macrophage polarization and inflammatory response by targeting glutaminases through the NF-κB signaling pathway. Front Immunol. 2023;14:1180837.
53. Köhler N, Ruess DA, Kesselring R, Zeiser R. The role of immune checkpoint molecules for relapse after allogeneic hematopoietic cell transplantation. Front Immunol. 2021;12:634435.
54. Lee YH, Martin-Orozco N, Zheng P, et al. Inhibition of the B7-H3 immune checkpoint limits tumor growth by enhancing cytotoxic lymphocyte function. Cell Res. 2017;27:1034-45.
55. Picarda E, Ohaegbulam KC, Zang X. Molecular pathways: targeting B7-H3 (CD276) for HUMAN CANCER IMMUNOTHerapy. Clin Cancer Res. 2016;22:3425-31.
56. Dröge W, Eck HP, Betzler M, Näher H. Elevated plasma glutamate levels in colorectal carcinoma patients and in patients with acquired immunodeficiency syndrome (AIDS). Immunobiology. 1987;174:473-9.
57. Nabe S, Yamada T, Suzuki J, et al. Reinforce the antitumor activity of CD8+ T cells via glutamine restriction. Cancer Sci. 2018;109:3737-50.
Cite This Article
How to Cite
Download Citation
Export Citation File:
Type of Import
Tips on Downloading Citation
Citation Manager File Format
Type of Import
Direct Import: When the Direct Import option is selected (the default state), a dialogue box will give you the option to Save or Open the downloaded citation data. Choosing Open will either launch your citation manager or give you a choice of applications with which to use the metadata. The Save option saves the file locally for later use.
Indirect Import: When the Indirect Import option is selected, the metadata is displayed and may be copied and pasted as needed.
About This Article
Copyright

Data & Comments
Data
0


Comments
Comments must be written in English. Spam, offensive content, impersonation, and private information will not be permitted. If any comment is reported and identified as inappropriate content by OAE staff, the comment will be removed without notice. If you have any queries or need any help, please contact us at [email protected].