


fig2
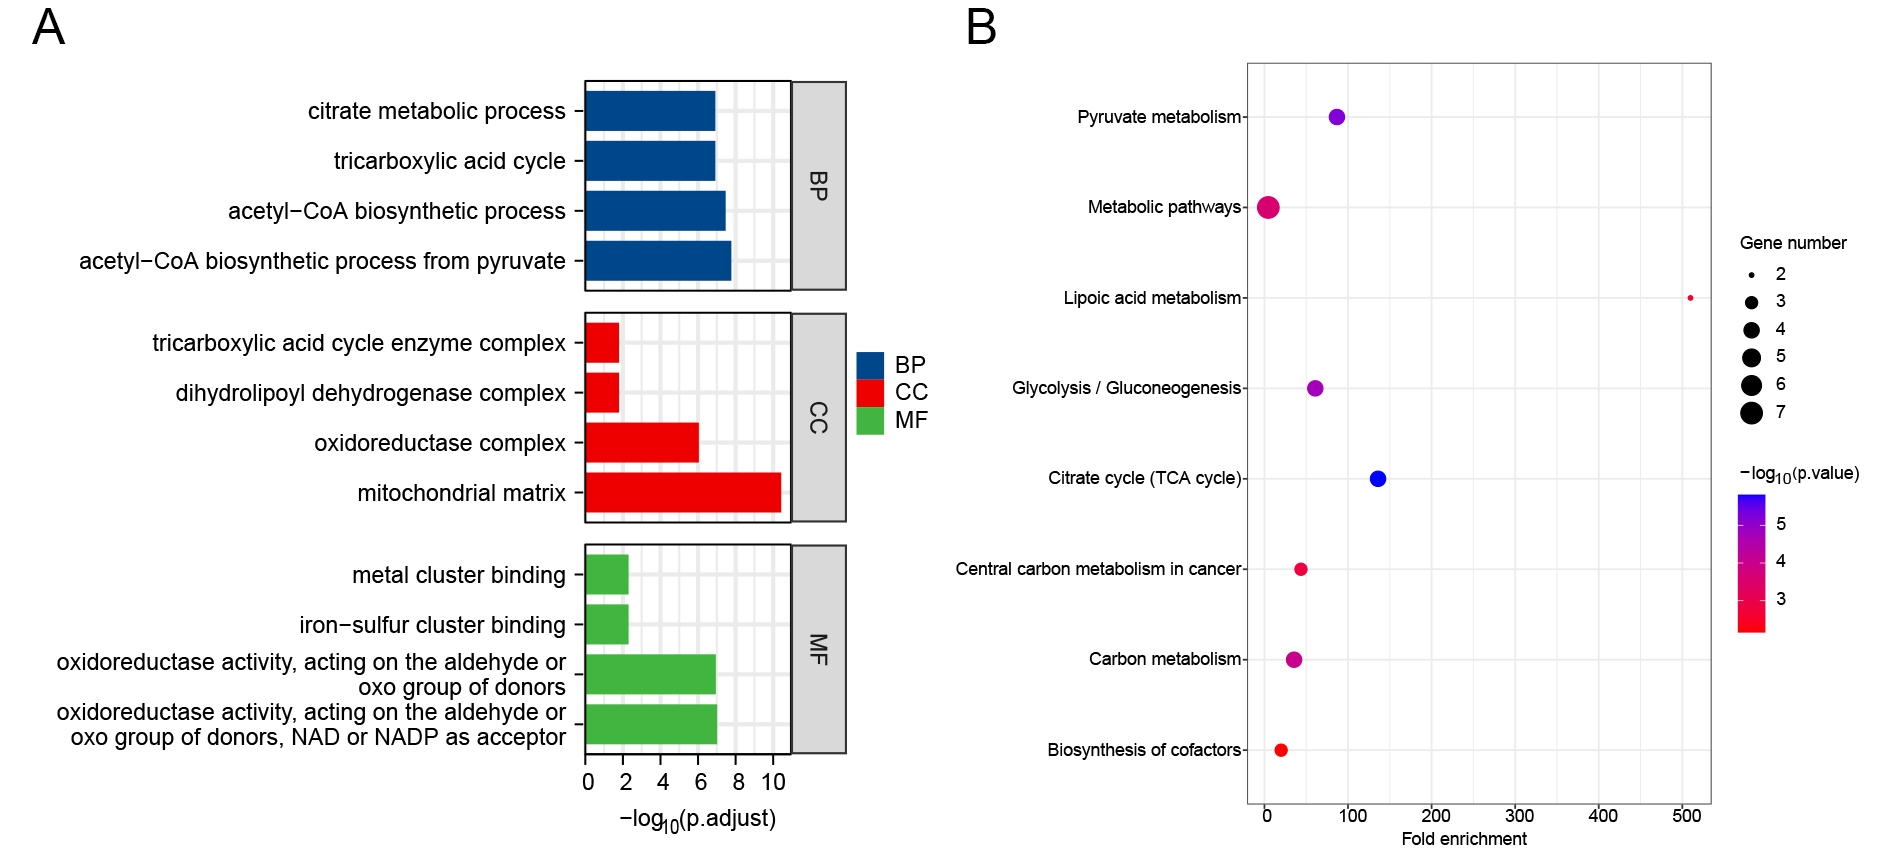
Figure 2. Functional enrichment analysis of CRGs. (A) GO enrichment analysis; (B) KEGG pathway enrichment. Circle size represents the number of enriched genes. BP: Biological process; CC: cellular component; MF: molecular function; CRGs: cuproptosis-related genes; GO: gene ontology; KEGG: kyoto encyclopedia of genes and genomes.


