


fig5
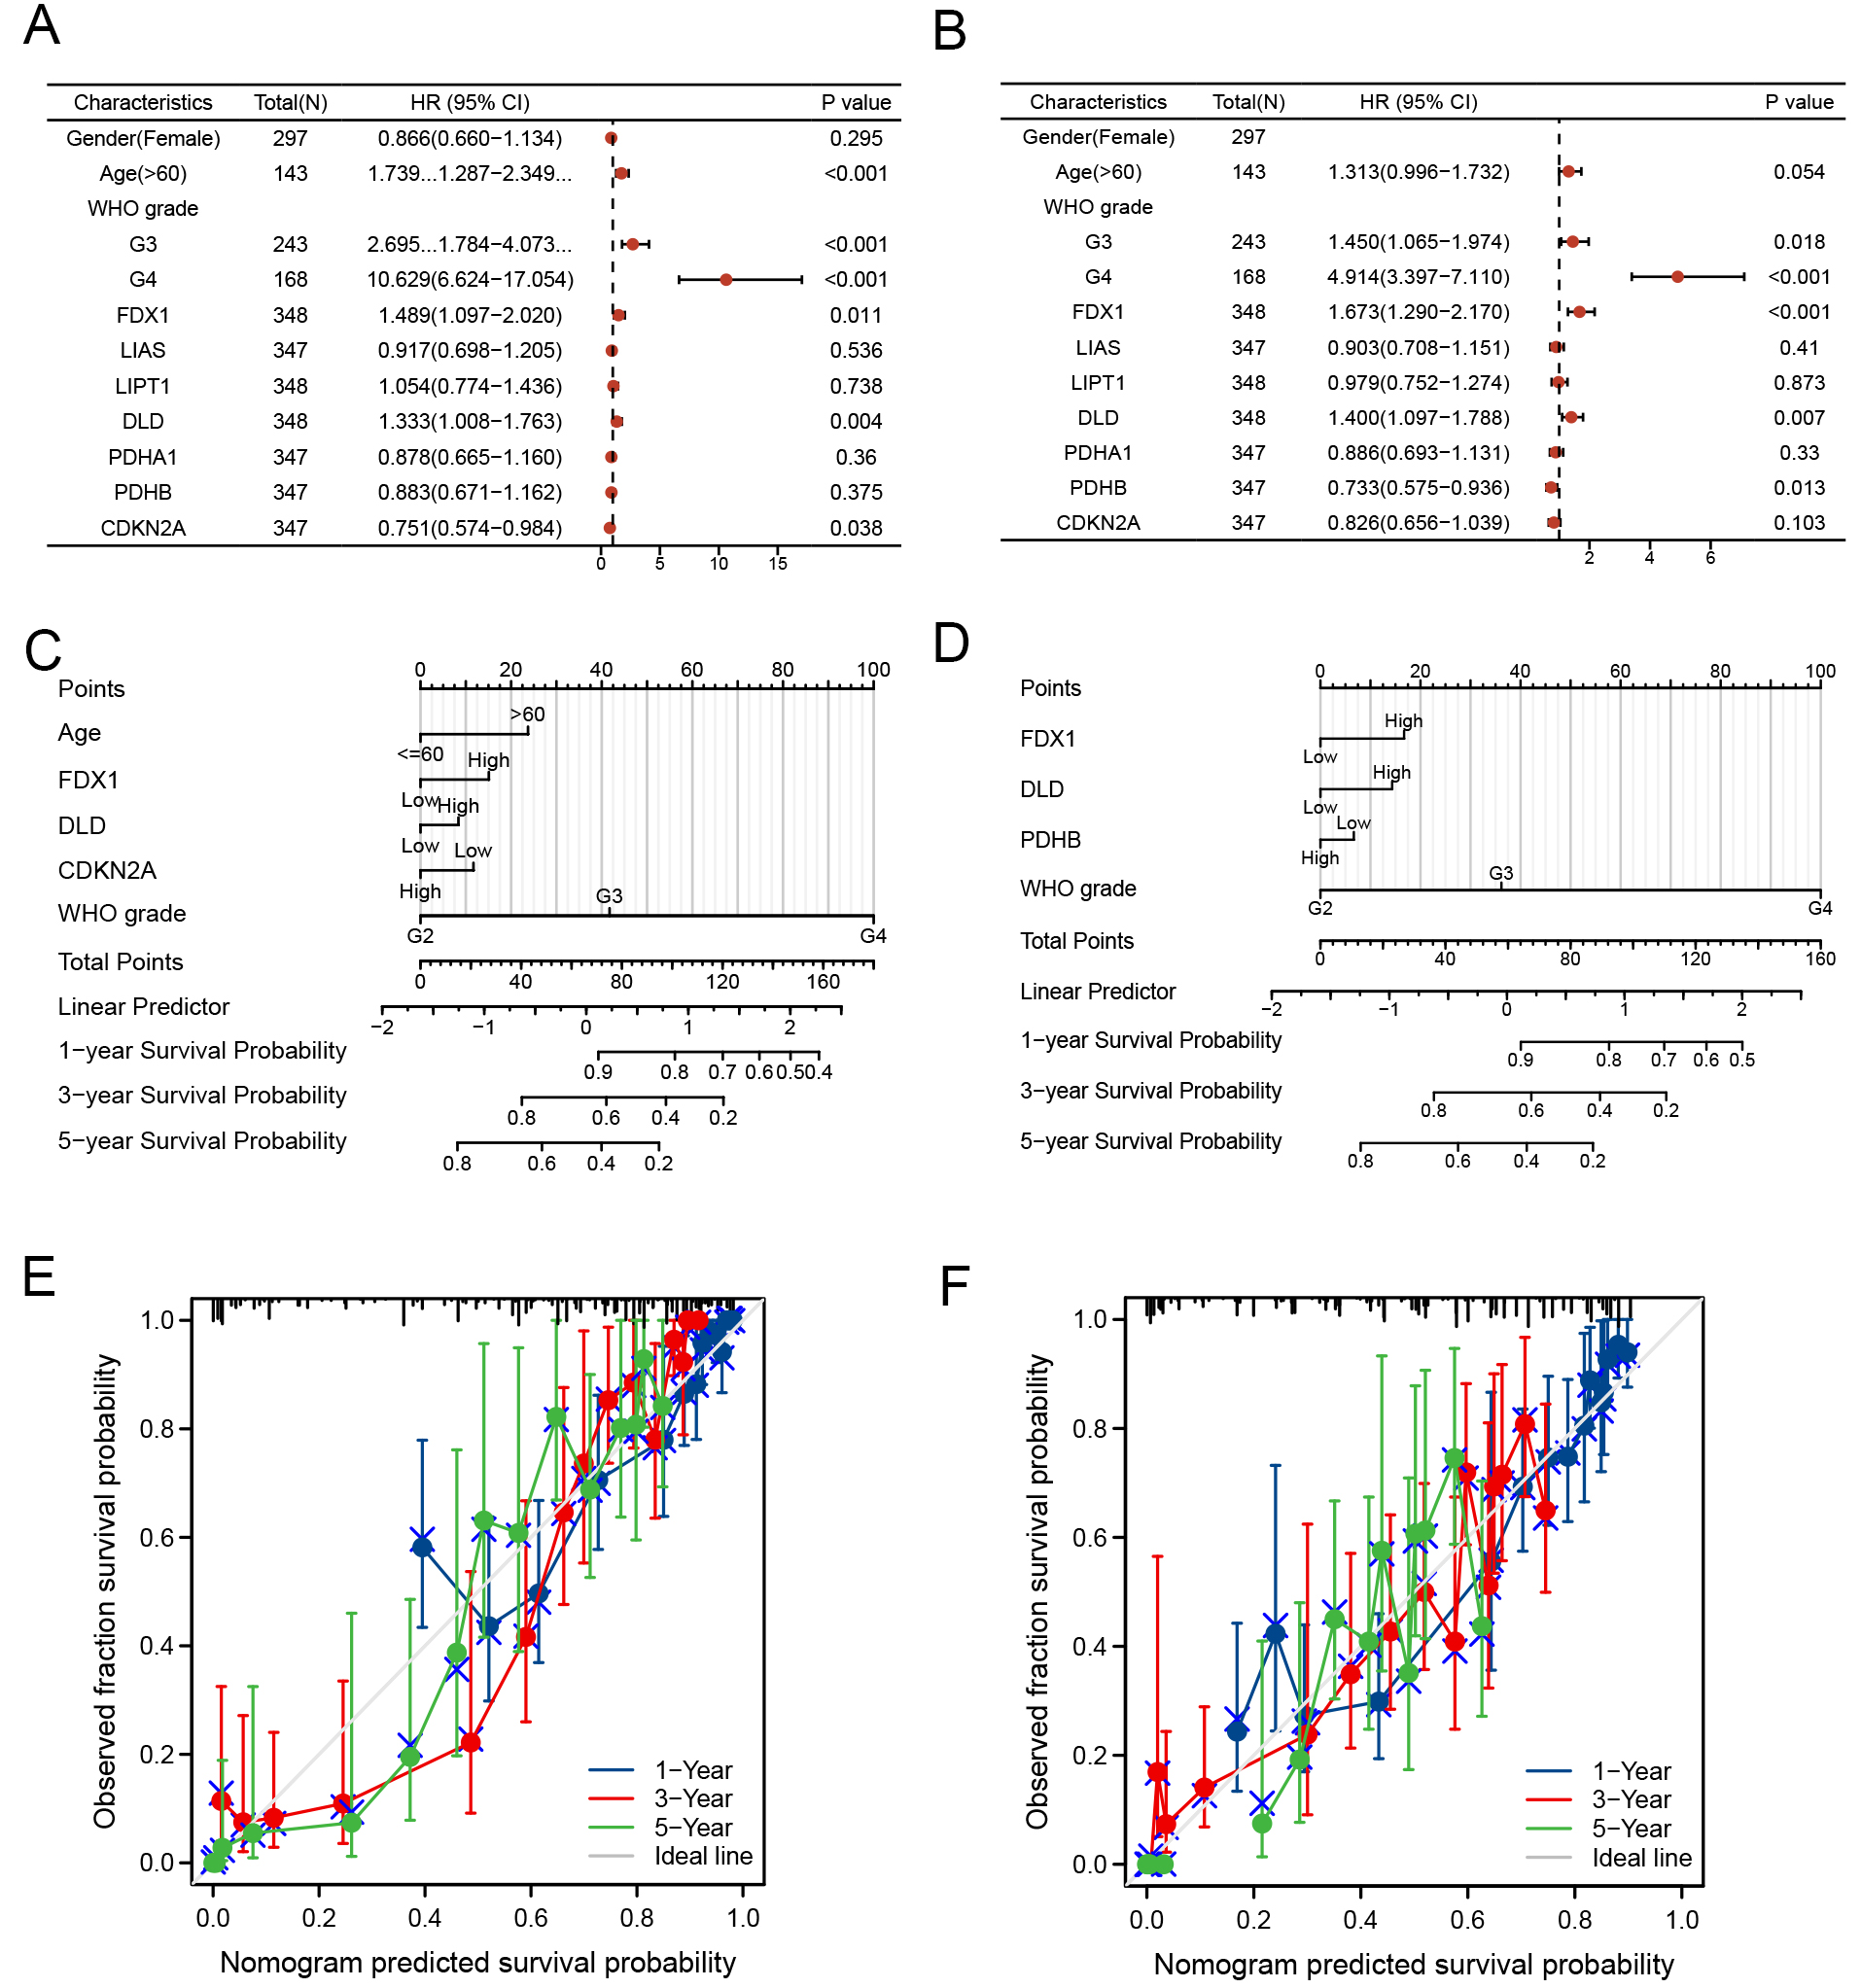
Figure 5. Development and validation of a prognostic nomogram. H azard ratios and P-values from multivariate Cox regression analysis integrating clinical dat. (A) OS and (B) PFS data were evaluated through discriminant and calibration analyses. Develop the 1-, 3-, and 5-year survival probabilities of (C) OS and (D) PFS for glioma patients based on age, WHO grades, FDX1, DLD, and CDKN2A. Nomogram for predicting survival probabilities of (E) OS and (F) PFS separately.


