


fig1
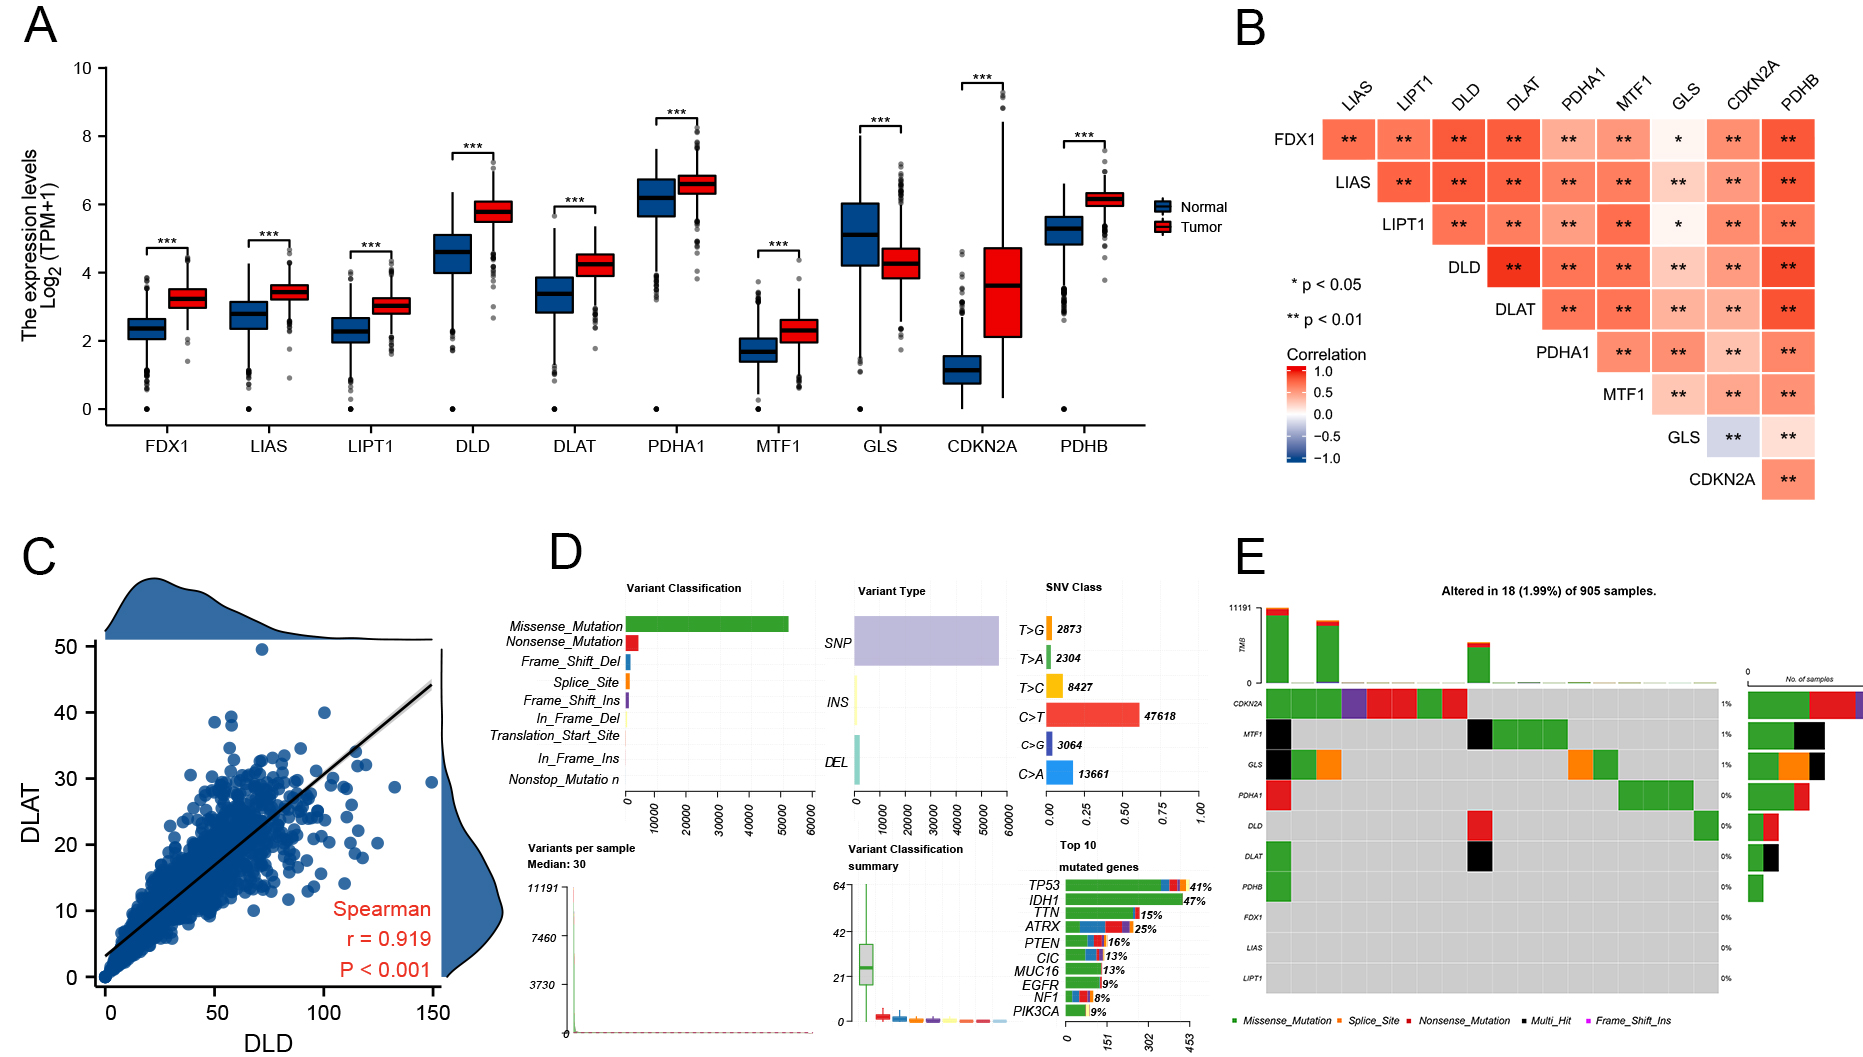
Figure 1. Expression and gene alterations of CRGs in glioma. (A) Expression levels of 10 CRGs in glioma and normal tissues (tumor: red, normal: blue); (B) Correlation among CRG expression levels; (C) Correlation between DLD and DLAT; (D and E) CNV profiles, mutation frequencies, and classification of CRGs in glioma. *P < 0.05, **P < 0.01, ***P < 0.001. CRGs: Cuproptosis-related genes; CNV: copy number variation; DLD: dihydrolipoamide dehydrogenase.


