


fig4
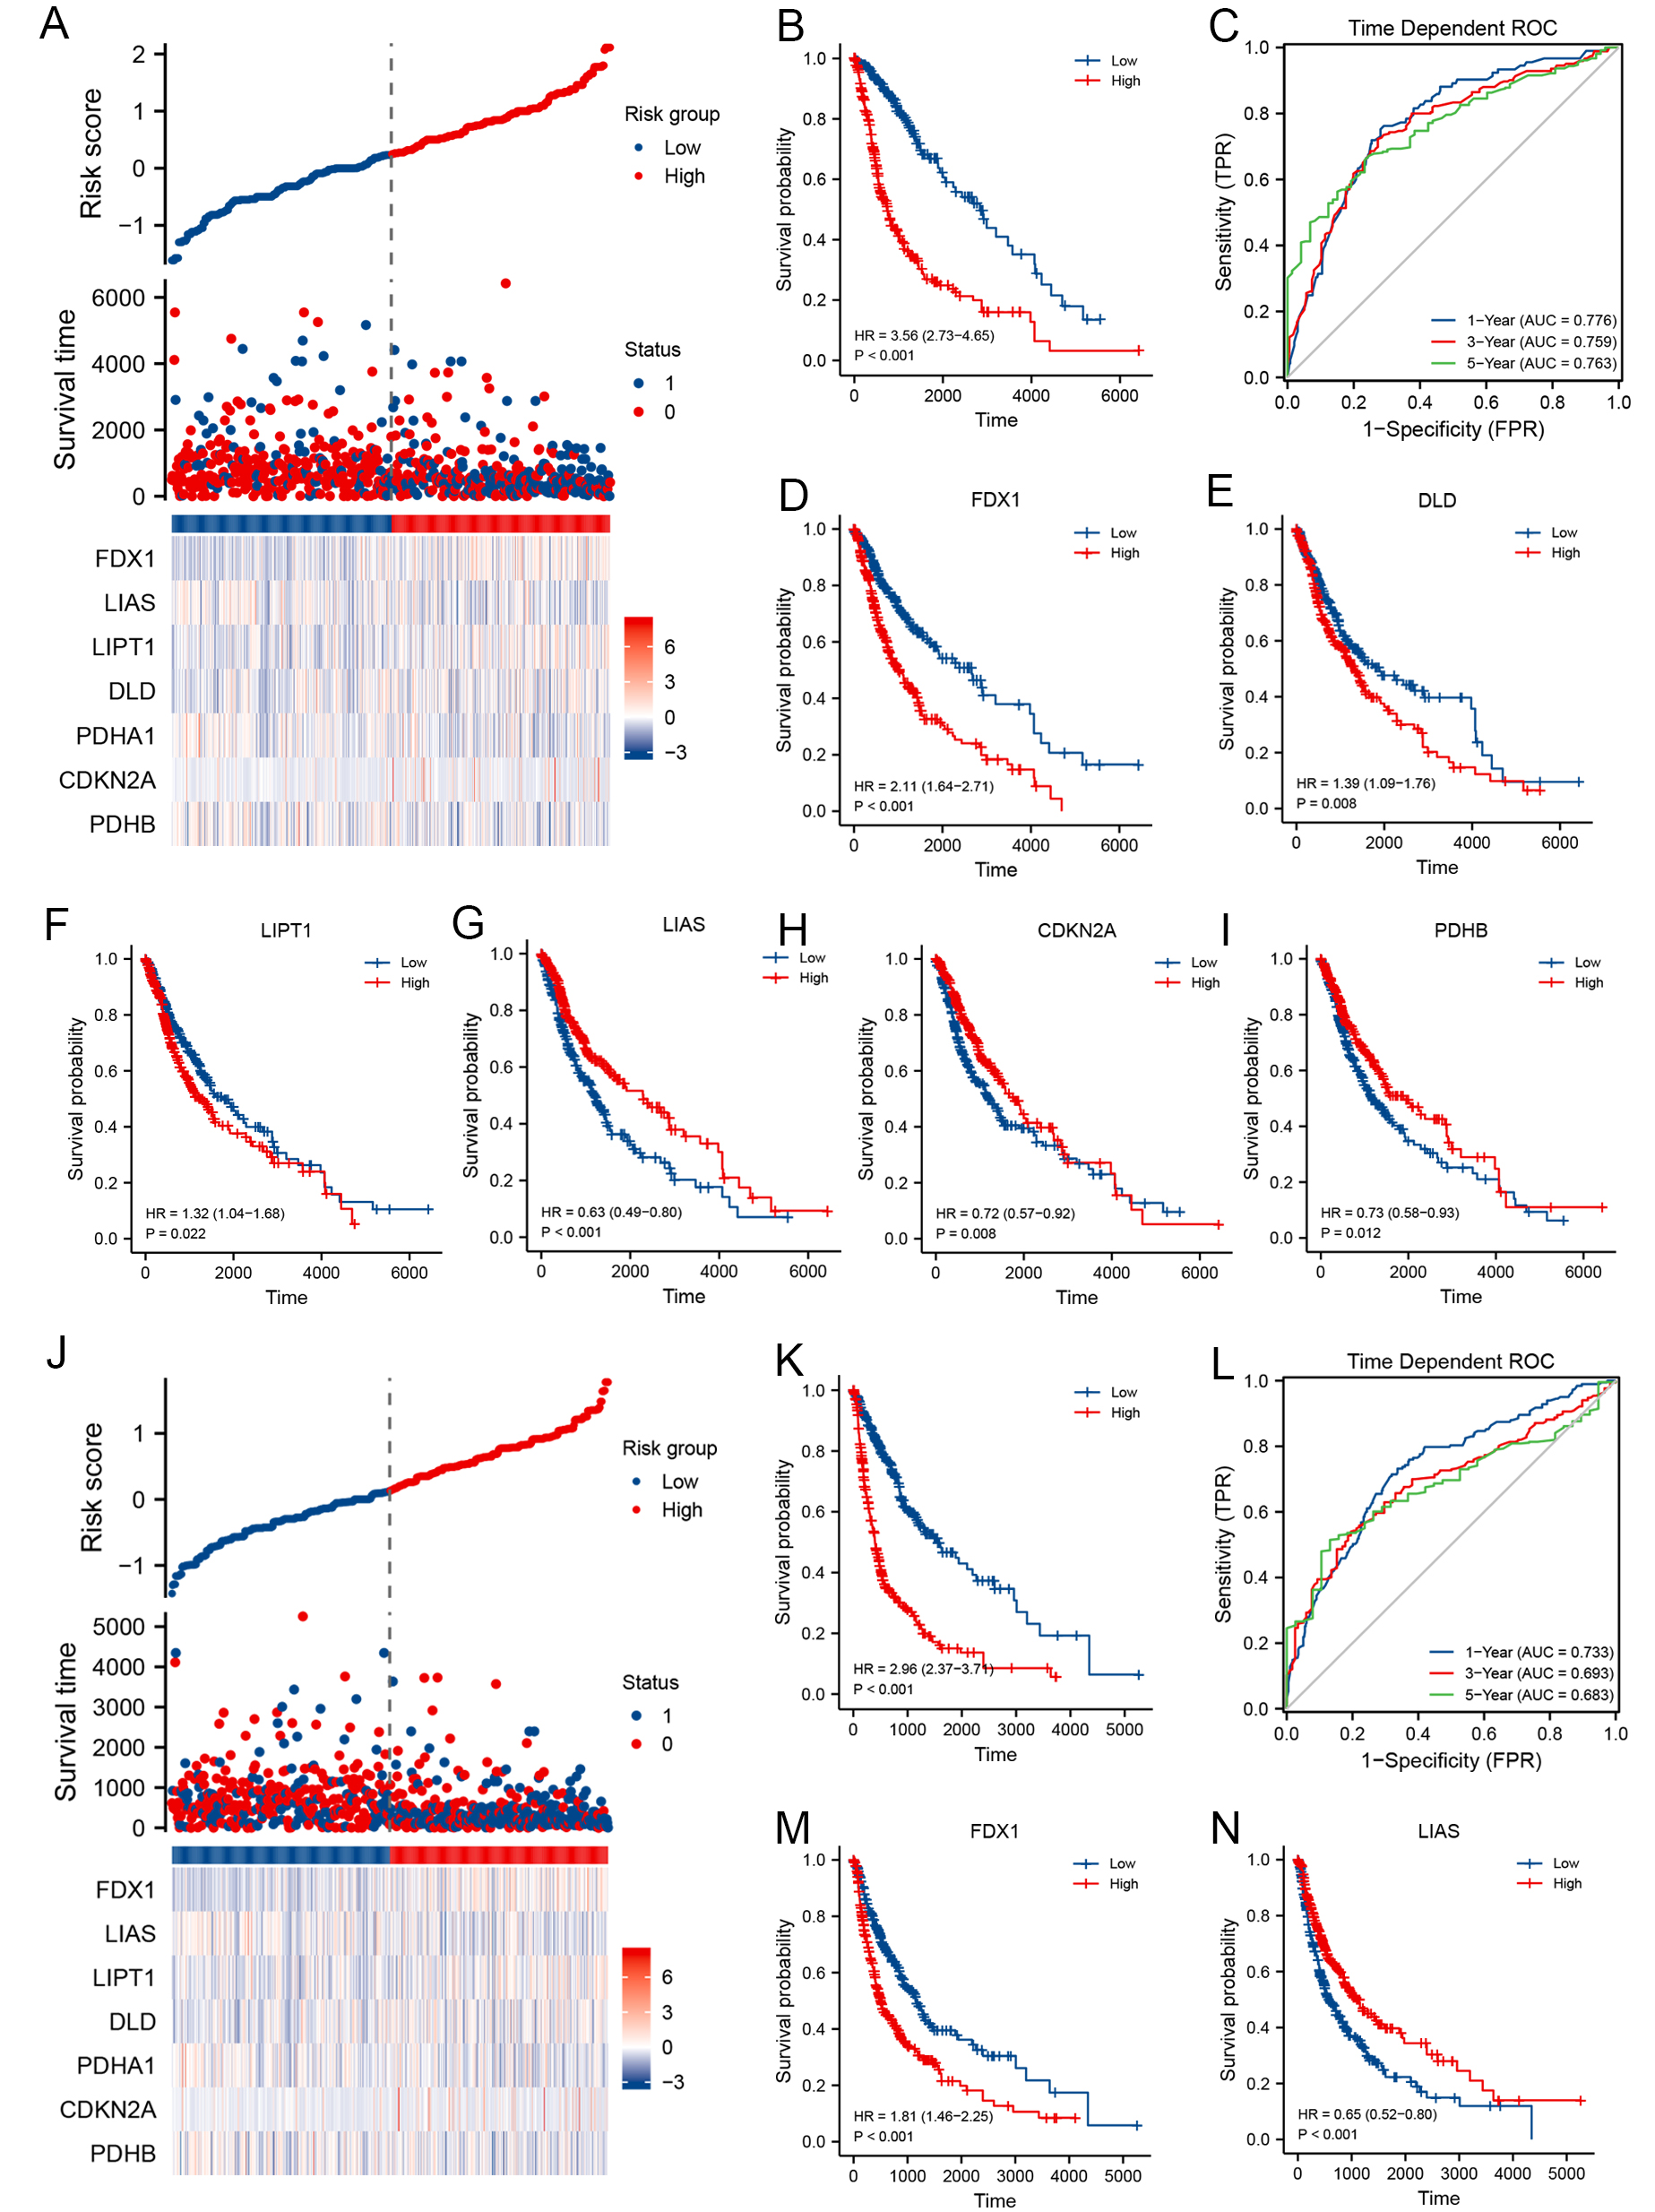
Figure 4. Clinical relevance of CRGs in glioma patients from TCGA. For OS: (A) Distribution of risk scores, survival status, and prognostic CRG expression; (B) Kaplan-Meier survival curve of the CRG signature and OS; (C) ROC curves for 1-, 3-, and 5-year OS prediction. Kaplan-Meier plots for the expression of (D) FDX1, (E) DLD, (F) LIPT1, (G) LIAS, (H) CDKN2A, and (I) PDHB and their association with OS; For PFS: (J) Distribution of risk scores, survival status, and prognostic CRG expression; (K) Kaplan-Meier survival curve of the CRG signature and PFS; (L) ROC curves for 1-, 3-, and 5-year PFS prediction. Kaplan-Meier plots for the expression of (M) FDX1 and (N) LIAS and their association with PFS. CRGs: Cuproptosis-related genes; TCGA: the cancer genome atlas; OS: overall survival; PFS: progression-free survival; ROC: receiver operating characteristic; DLD: dihydrolipoamide dehydrogenase; LIAS: lipoic acid synthetase; PDHB:pyruvate dehydrogenase E1 subunit beta.


