


fig6
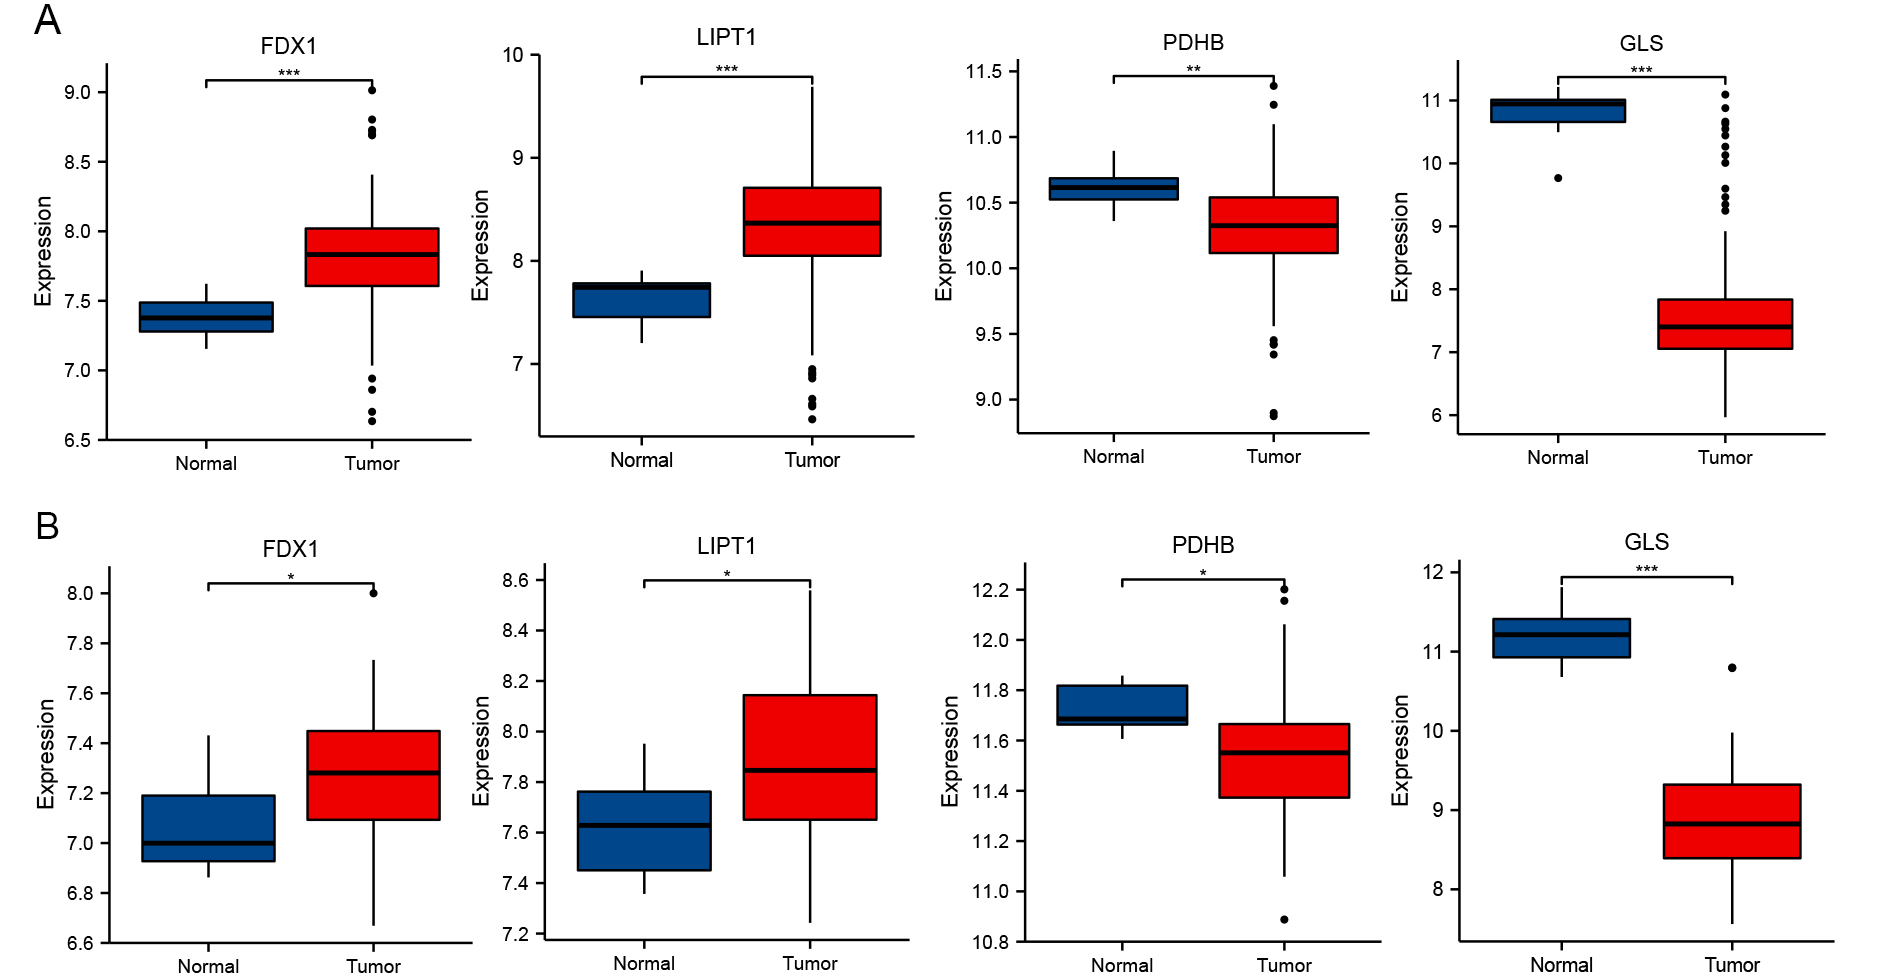
Figure 6. Differential expression analysis and dataset validation. Box plots showing expression of FDX1, LIPT1, PDHB, and GLS in (A) GSE16011 and (B) GSE116520 datasets. *P < 0.05, **P < 0.01, ***P < 0.001.
Figure 6. Differential expression analysis and dataset validation. Box plots showing expression of FDX1, LIPT1, PDHB, and GLS in (A) GSE16011 and (B) GSE116520 datasets. *P < 0.05, **P < 0.01, ***P < 0.001.


All published articles are preserved here permanently:
https://www.portico.org/publishers/oae/

