


fig10
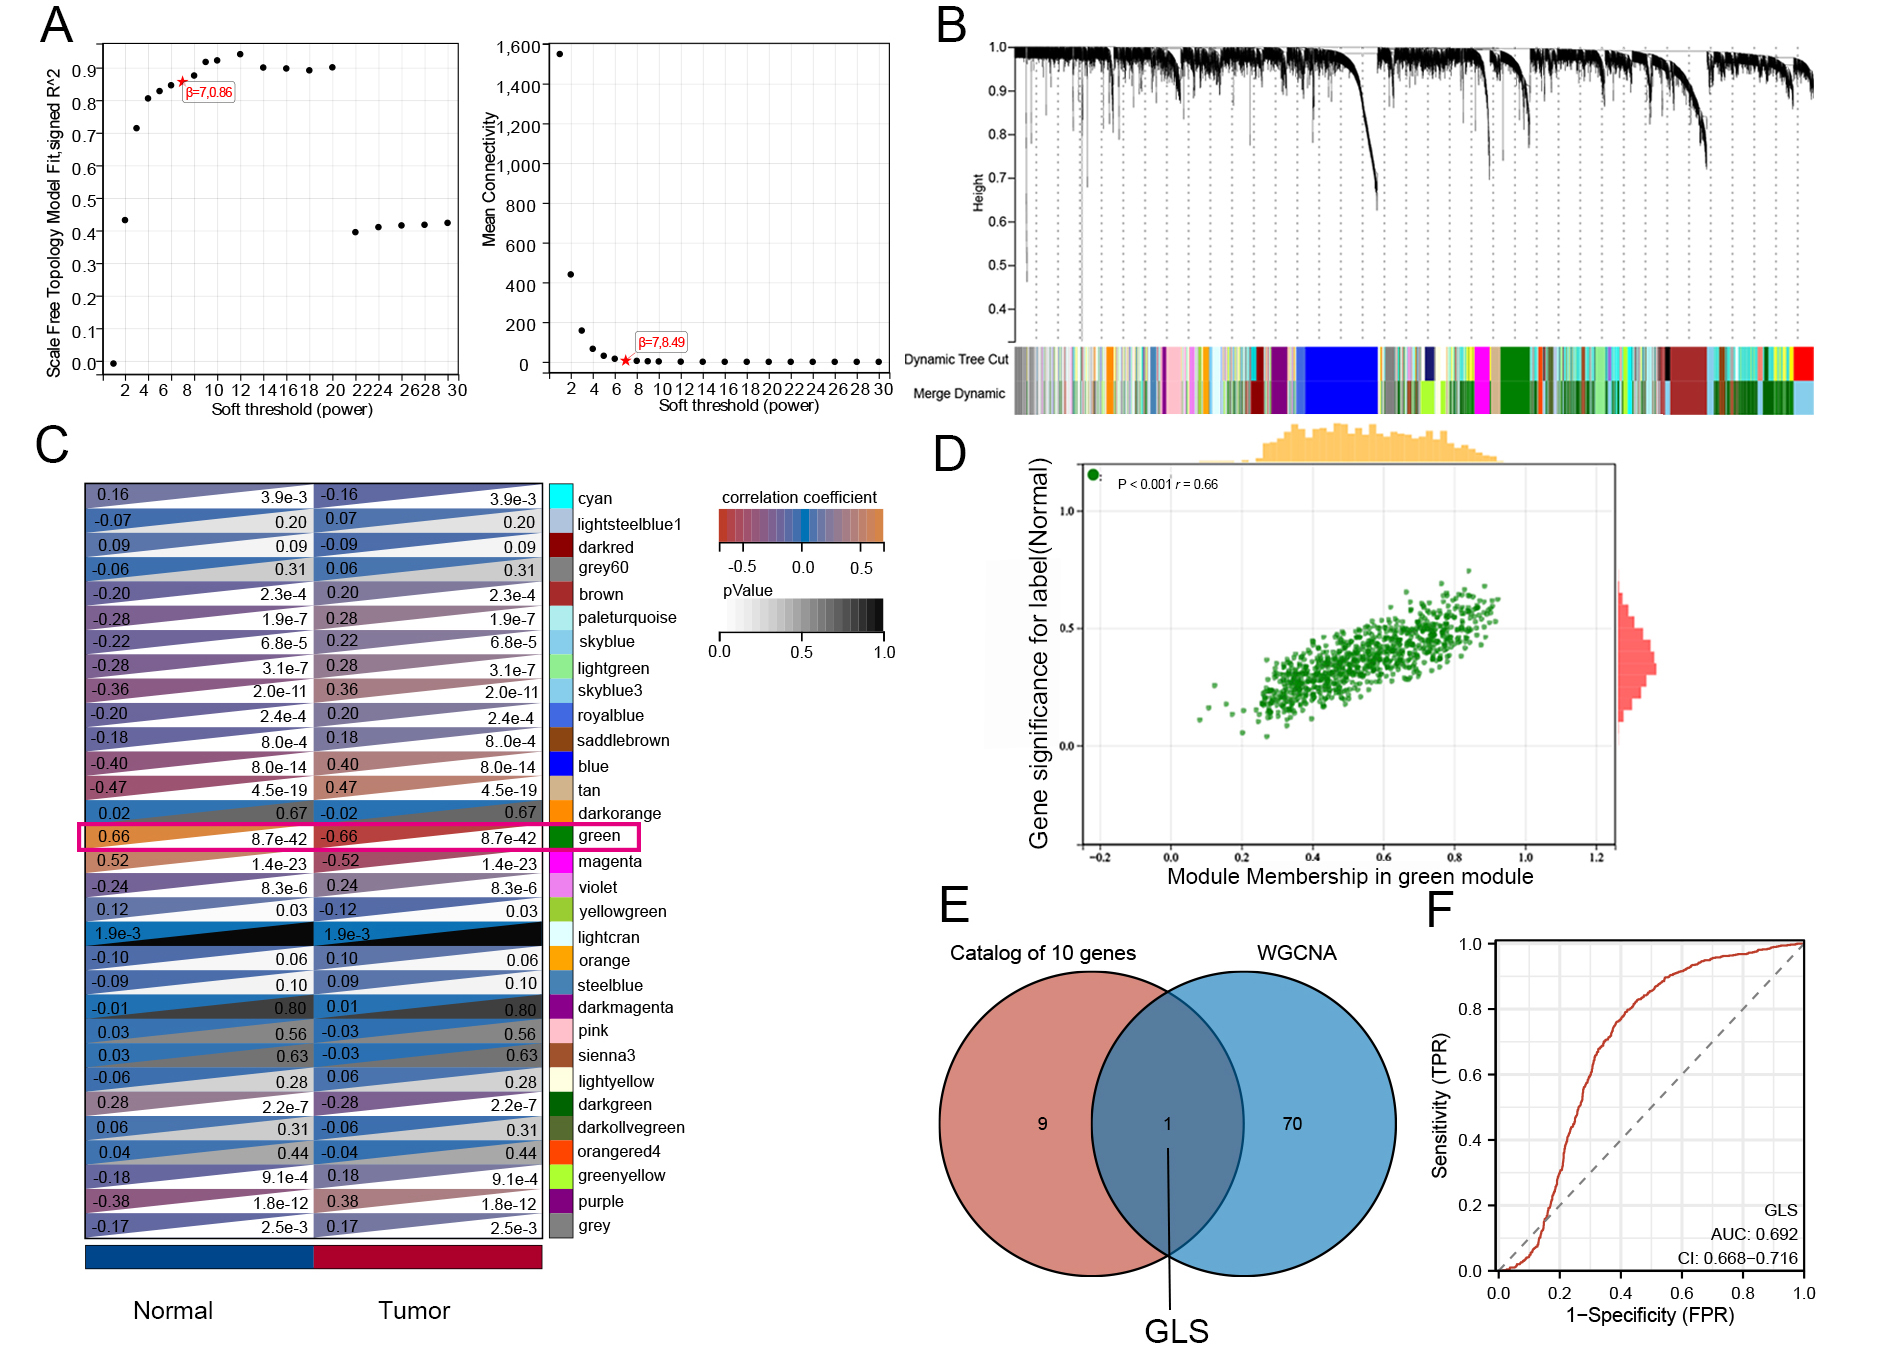
Figure 10. Weighted gene co-expression network analysis (WGCNA). (A) Scale-free topology model fit index versus soft-thresholding power; (B) Cluster dendrogram of genes with modules indicated by different colors; (C) Heatmap of module-trait correlations between clinical features and gene modules; (D) Scatterplot showing correlation between module membership (MM) and gene significance (GS) in the green module; (E) Venn diagram of intersecting genes between diagnostic CRGs and WGCNA modules; (F) ROC curve showing the diagnostic performance of GLS. CRGs: Cuproptosis-related genes; GLS: glutaminase; ROC: receiver operating characteristic.


