

Engineering a keloid-like fibrotic skin-on-a-chip for drug evaluation
 0
Graphical Abstract
Abstract
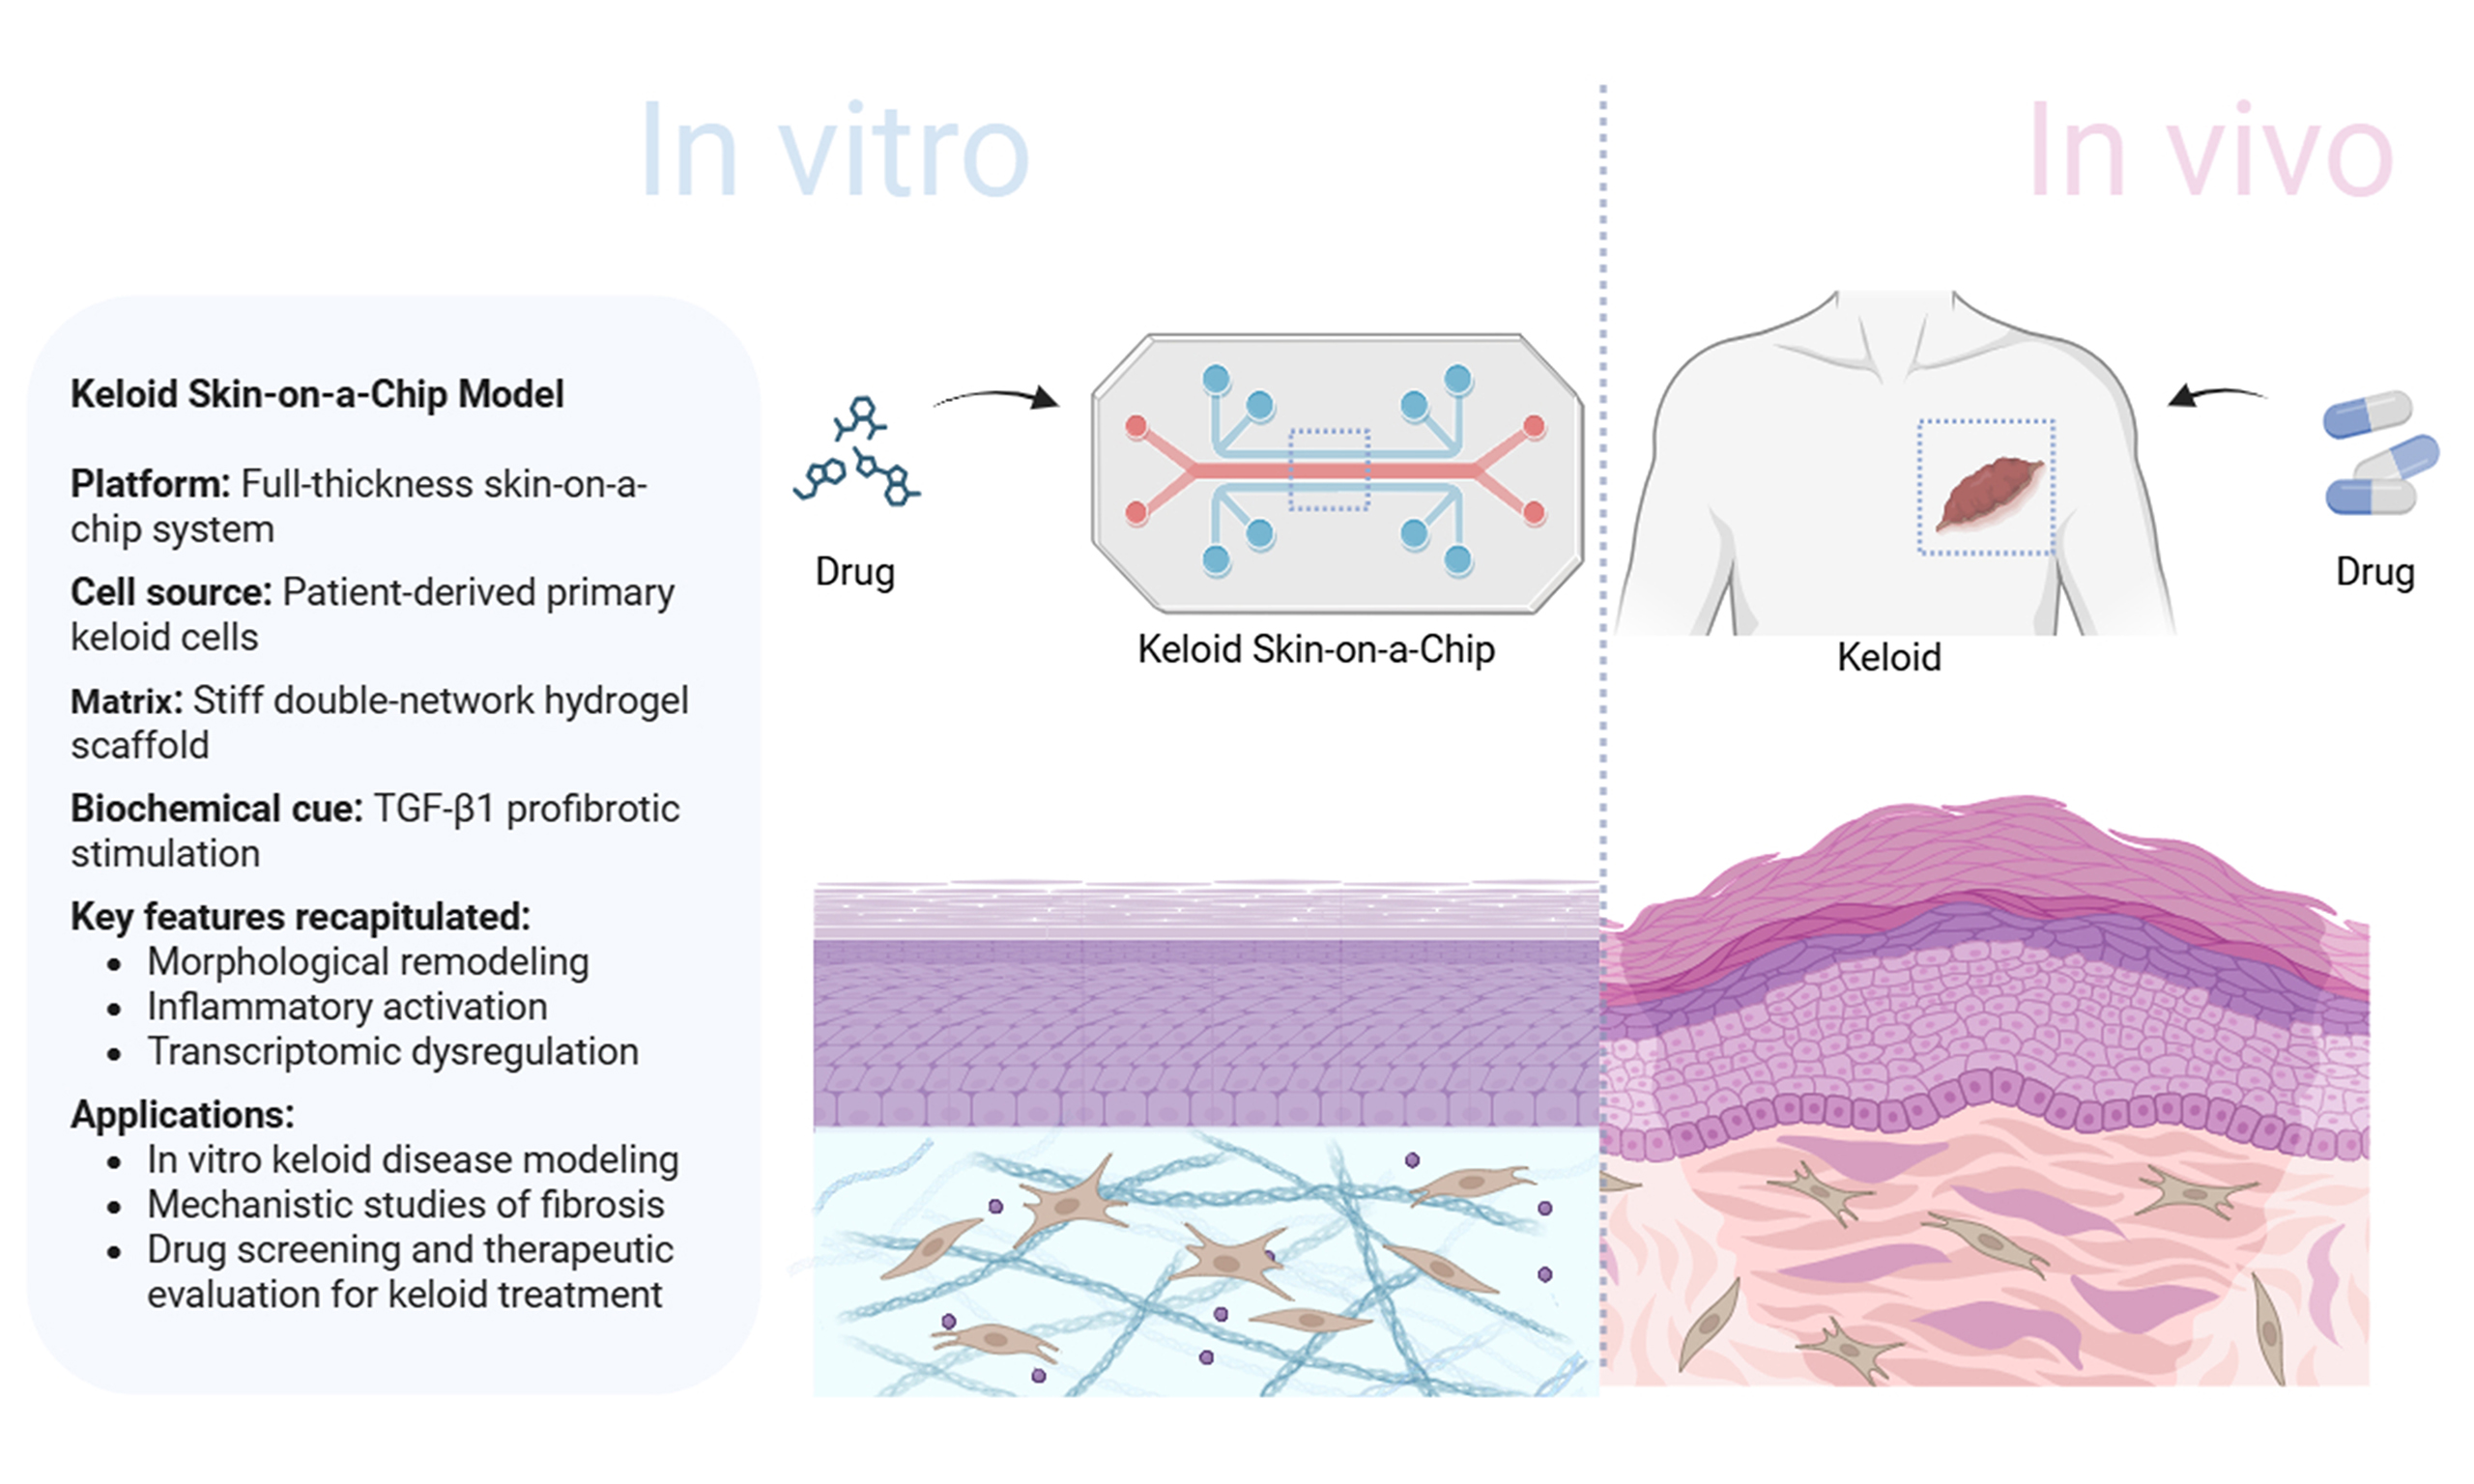
Keloids are pathological scars characterized by abnormal fibroblast activation and excessive extracellular matrix (ECM) deposition during wound healing, resulting in persistent fibrotic remodeling. Effective in vitro models with both biomimicry and reproducibility remain lacking. Here, we established a membrane-based microfluidic skin-on-chip (SoC) platform supporting a three-dimensional full-thickness skin model. By integrating patient-derived keloid fibroblasts, tunable ECM stiffness, and transforming growth factor-beta 1 (TGF-β1) stimulation, we developed a keloid-like fibrotic SoC model. The platform incorporated a high-stiffness hydrogel matrix to mimic the pathological mechanical properties associated with keloid fibrosis. The engineered model reproduced several key keloid-associated fibrotic characteristics, including increased collagen deposition, enhanced α-smooth muscle actin expression, elevated type I/III collagen ratio, and fibrosis-related transcriptional changes. Drug evaluation further demonstrated that nintedanib and 5-fluorouracil attenuated fibrosis-related phenotypes and reduced profibrotic gene expression. In summary, we present an engineered keloid-like fibrotic SoC platform that integrates pathological mechanical and biochemical cues, providing an engineered platform for investigating keloid-associated fibrotic remodeling and evaluating potential antifibrotic interventions.
Keywords


 Download PDF
INTRODUCTION
Pathological scars represent aberrant tissue responses characterized by excessive proliferation or abnormal repair during wound healing. Elucidating their formation mechanisms is of great significance for understanding the regulatory principles of wound repair. Keloids, the most extreme form of pathological scarring, are defined by persistent growth beyond the original wound boundary and exhibit tumor-like invasive biological behavior. Within keloid tissue, fibroblasts display hyperproliferation and markedly elevated collagen synthesis compared with normal dermal fibroblasts, leading to disorganized collagen fiber deposition and the formation of hard nodular or plaque-like structures[1]. Such pathological alterations not only cause severe cosmetic disfigurement but are often accompanied by pain, pruritus, and other local discomforts, profoundly affecting patients’ quality of life and psychological well-being. The pathogenesis of keloids is highly complex, involving aberrant fibroblast activation, dysregulation of cytokine networks [e.g., hyperactivation of the transforming growth factor-beta (TGF-β)/Smad signaling pathway], and disturbances in the immune microenvironment[2-4]. Current therapeutic strategies remain inconsistent, are associated with high recurrence rates, and lack effective interventions. Therefore, in-depth investigation of the cellular composition and molecular mechanisms of keloids is urgently required to provide key theoretical support for targeted regulation of impaired wound repair.
A major bottleneck in both fundamental research and drug development for wound healing lies in the lack of effective pathological scar models. As shown in Supplementary Table 1, existing keloid research models include patient-derived tissue samples, animal models, and in vitro cell-based systems of varying complexity. In in vivo studies, histopathological sections and single-cell sequencing of patient samples can faithfully reflect keloid characteristics, such as excessive collagen deposition, aberrant fibroblast activation, and altered cytokine expression[5,6]. Animal models, including nude mice, rats, rabbits, and pigs, have been employed to mimic keloid formation through surgical intervention, pharmacological induction, or pathological tissue transplantation. However, interspecies differences in skin structure and physiology result in fundamental discrepancies in wound healing and scar formation compared with humans, thereby limiting their translational value[7,8]. In vitro models primarily rely on patient-derived cell cultures, including monocultures of keloid fibroblasts or keratinocytes, as well as co-culture systems in both 2D and more sophisticated 3D formats. For instance, fibroblast cultures derived from keloid tissue exhibit key pathological features such as elevated collagen synthesis, enhanced extracellular matrix (ECM) deposition, an increased type I/III collagen ratio, and reduced procollagen degradation[9]. Lim et al. employed a transwell co-culture system to demonstrate that keratinocytes can promote keloid fibroblast proliferation via paracrine signaling[10]. Moreover, 3D engineered dermal models have been constructed using fibroblasts embedded within scaffolds composed of type I collagen, polyethylene glycol diacrylate, Matrigel, or Matriderm, recapitulating tissue-like architecture. When keratinocytes are added to such dermal constructs, full-thickness 3D keloid models comprising both dermis and epidermis can be established[11,12]. Alternatively, spheroid-based models generated from homogenized keloid tissue preserve the cellular composition but lack organized tissue structure[13,14].
In recent years, the development of organ-on-chip technology has greatly advanced the fidelity of in vitro 3D organotypic models. Microfluidic platforms allow simulation of tissue-specific fluidic dynamics, thereby reproducing physiological and pathological features at the organ level with high fidelity[15,16]. Skin-on-chip (SoC) systems, as functional 3D microfluidic skin models, have been successfully applied to disease modeling and drug testing[17,18], such as atopic dermatitis[19], herpes simplex virus (HSV) infection[20], and others. However, their application to keloid modeling remains considerably limited. Keloids represent an aberrant fibroproliferative wound healing response strongly associated with skin fibrosis. While fibroblasts are the primary effectors in this process, other cell types such as dermal endothelial cells, epidermal keratinocytes, subcutaneous adipocytes, macrophages and so on also contribute to keloid pathogenesis. Furthermore, in the construction strategy of fibrotic chip models, key fibrotic features such as ECM deposition and remodeling, inflammatory microenvironment, mechanical stimulation, and dysregulated vascularization have also been prioritized as essential design parameters[21]. Accordingly, attempts have been made to recapitulate skin fibrotic phenotypes using microfluidic chip platforms. By seeding fibroblasts within chitosan–collagen hydrogels and exposing them to TGF-β stimulation, the models exhibited characteristic fibrotic features and enabled high-throughput screening of anti-scarring compounds[22]. With respect to cellular crosstalk, non-contact fibroblast–macrophage coculture SoCs have been employed to study macrophage contributions to wound healing[23]. More advanced models incorporating fibroblasts, endothelial cells, and macrophages under tumor necrosis factor-alpha (TNF-α) stimulation have recapitulated the inflammatory wound microenvironment for anti-inflammatory evaluation[24]. In another study, co-integration of fibroblasts, endothelial cells, and keratinocytes under TGF-β stimulation with physiological perfusion pressure successfully reproduced key pathological features of systemic sclerosis-associated fibrosis[25]. However, these systems remain limited to multicellular coculture under fluidic conditions without recapitulating organized 3D tissue architecture. To overcome these constraints, a vascularized SoC model integrating organ-on-chip and 3D printing technologies has been reported, featuring robust barrier function and enabling laser-induced wound healing studies[26]. Separately, an edgeless SoC platform built around 3D-printed scaffolds mimics the continuous geometry of human skin and recreates near-physiological mechanical equilibrium in vitro[27]. Collectively, these studies underscore the promise of biomimetic SoC platforms for wound healing and scar research. Nevertheless, to the best of our knowledge, no SoC simultaneously integrates pathological matrix mechanics, organized full-thickness skin architecture, and patient-derived keloid cells within a dynamically cultured platform, which remains a key challenge in developing more pathologically relevant keloid models.
In this study, we developed a full-thickness SoC model using a membrane-based microfluidic device, which recapitulates dermal and epidermal structures with epidermal stratification and differentiation. To mimic the pathological microenvironment of keloids, we engineered a disease-specific SoC model by incorporating stiffened hydrogel matrices to simulate the aberrant ECM mechanics and by applying TGF-β1 stimulation to induce fibroblast differentiation. This platform also integrated patient keloid primary cells and dynamic microfluidic culture, reproduced selected keloid-associated fibrotic features and was subsequently employed for drug testing. As a proof of concept, we evaluated the effects of the antifibrotic agent nintedanib and the clinically used keloid therapy 5-fluorouracil (5-FU) at both phenotypic and transcriptional levels. The results demonstrate that our model provides a platform for studying keloid-associated fibrotic remodeling and proof-of-concept therapeutic evaluation.
EXPERIMENTAL
Fabrication of soft and stiff cell-scaffold composite hydrogels
Sodium alginate (SA, Cat# 9005-38-3), trehalose (Cat# 90210), and lithium phenyl-2,4,6-trimethylbenzoylphosphinate (LAP, Cat# 900889) were purchased from Sigma-Aldrich. The synthesis of gelatin methacryloyl (GelMA) is the same as reported before[28]. First, LAP (1 wt%) was dissolved in phosphate buffer [1× phosphate-buffered saline (PBS), Solarbio, Cat# P1020] and stirred at 50 °C for 30 min. For every 1 mL progenitor solution of soft hydrogel, 0.05 g GelMA (65% ± 0.4% substitution degree) and 0.005 g SA were added. For every 1 mL progenitor solution of hard hydrogel, 0.05 g GelMA, 0.005 g SA, and 0.01 g trehalose were added. Then, the progenitor solution was filtered with a 0.22 μm pore size filter and mixed with keloid fibroblast cells. Finally, the progenitor solution with keloid fibroblast cells was added into the Transwell insert (Corning, Cat# 3470) and exposed to 365 nm ultraviolet (UV) light for 30 s before being transferred into 24-well plates with Dulbecco’s Modified Eagle Medium (DMEM; Gibco, Cat# 11965) containing 200 mg·L-1 Calcium chloride medium to complete the dual-network gelation for 30 min and start the co-culture process.
Microstructure characterization of hydrogel
The mechanically tunable hydrogels were first immersed in liquid nitrogen for 5 min before being subjected to freeze-drying treatment at -80 °C for 72 h. Their microstructure was then characterized by scanning electron microscopy (SEM; Quanta FEG 250, FEI, Netherlands) at an acceleration voltage of 5 kV.
Mechanical characterization of keloid tissue and hydrogel
For the nominal stress-stretch curves, all hydrogel specimens are made into 4 mm wide, 2 mm thick, and
Cell viability and live/dead assay
Fibroblast viability on days 1, 4, 8, and 27 was assessed using the Alamar Blue (Invitrogen, Cat# DAL1025) and Live/Dead Cell Imaging Kit (Invitrogen, Cat# R37601).
Alamar Blue was added aseptically at 10% of the medium volume, and samples were incubated for 4 h in a CO2 incubator (Thermo Fisher Scientific, Heracell 240i, USA). Absorbance was measured at 570 and 600 nm, and cell viability (CV) was calculated using:
where E1 and E2 are the molar extinction coefficients of oxidized Alamar Blue at 570 nm and 600 nm, A1 and A2 are the sample absorbance at 570 and 600 nm, and B1 and B2 are the absorbance of the control at the respective wavelengths.
As for the live/dead assay, samples were incubated with the staining solution [Calcein AM/iodide:DMEM/10% fetal bovine serum (FBS) = 1:1] for 15 min, followed by three washes with PBS. Fluorescence imaging was performed using an inverted microscope (IX-83, Olympus, Japan) with excitation/emission wavelengths of 488/515 nm for live (green) cells and 570/602 nm for dead (red) cells. At least three technical replicates were prepared in accordance with the cell viability assay.
Tissue sample acquisition and skin primary cell culture
Written informed consent was obtained from all participants prior to surgical specimen collection. Human skin tissue collection and primary cell isolation were approved by the Institutional Review Board of Plastic Surgery Hospital, Chinese Academy of Medical Sciences and Peking Union Medical College under Approval No. 120 (2023). The subsequent keloid organ-on-a-chip study was approved under Approval No. 183 (2025). All procedures were conducted in accordance with the Declaration of Helsinki.
Keloid tissue and normal control skin specimens were obtained from one donor per condition at the Plastic Surgery Hospital. Detailed donor characteristics and tissue sources are provided in Supplementary Table 2.
Subcutaneous layers were mechanically removed, and primary skin cells were isolated as previously described[29,30]. Keratinocytes were dissociated via 0.25% (w·v-1) trypsin (Gibco, Cat# 25200056) digestion at
Construction of full-thickness skin models and growth factor induction
In the SoC, full-thickness skin models were established using primary dermal cells derived from both normal and keloid tissues. The dermal layer was constructed by embedding fibroblasts in a dual-network hydrogel matrix. After 4 days of submerged culture, keratinocyte suspension was seeded onto the stabilized dermal equivalent. The bilayer constructs were maintained in proliferation medium for 2 days before being raised to the air-liquid interface (ALI) to initiate epidermal differentiation. The models were maintained at the ALI until Day 17 to allow epidermal stratification and cornification.
For growth factor stimulation, mature full-thickness models were randomly allocated into four groups, each receiving treatment as follows: (1) TGF-β1-treated group: 10 ng·mL-1 recombinant human TGF-β1 (R&D Systems, Cat# 7754-BH); (2) Control group: Vehicle control; (3) Nintedanib treatment group: 10 ng·mL-1 TGF-β + 5.4 μg·mL-1 nintedanib (Selleck, Cat# S1010); (4) 5-FU treatment group: 10 ng·mL-1 TGF-β +
Histological, immunohistochemical, and immunofluorescence analysis
The collected 3D skin equivalents, keloid, and normal skin tissue samples were fixed in 4% paraformaldehyde (Biosharp, Cat# BL539A) and then embedded in paraffin for hematoxylin and eosin (H&E) staining, Masson’s staining, immunohistochemistry (IHC), and immunofluorescence (IF) staining. At least three technical replicates were prepared for each group. H&E (Beyotime, Cat# C0105S) and Masson’s staining (Beyotime, Cat# C0189S) were performed according to standard histological protocols. The bright-field images were captured for general analysis of morphological architecture, and histological features were measured with Caseviewer software (2.4.0.119028).
For IHC and IF, samples were incubated overnight at 4 °C with primary antibodies, including anti-α-SMA (anti-α-smooth muscle actin; 1:200, Abcam, Cat# ab7817), anti-pro-COL I (1:600, Sigma-Aldrich, Cat# Mab1912), anti-COL III (1:200, Abcam, Cat# ab7778), anti-keratin 14 (CK14, 1:200, Abcam, Cat# ab7800), anti-keratin 10 (CK10, 1:200, Abcam, Cat# ab76318), anti-vimentin (1:200, Invitrogen, Cat# 14-9897-82), anti-filaggrin (1:200, Abcam, Cat# ab178435) and anti-Ki67 (1:200, Abcam, Cat# ab16667), followed by incubation with the secondary antibody (Alexa Fluor 488 Goat Anti-Rabbit/Mouse IgG H&L Cat# ab150077/ab150117 and Alexa Fluor 546 Goat Anti-Rabbit/Mouse IgG H&L, Abcam, Cat# ab6939/ab97035) at room temperature for 1 h. IHC sections were visualized with 3,3'-diaminobenzidine (DAB) peroxidase substrate (Servicebio, Cat# G1212) and counterstained with hematoxylin (Servicebio, Cat# G1004). Where indicated, nuclei were counterstained with 4′,6-diamidino-2-phenylindole (DAPI; Thermo Fisher Scientific, Cat# D1306). Fluorescence images were captured using an Annoramic MIDI Digital Slide Scanner (3DHISTECH, Hungary) and analyzed using ImageJ software (1.54d). Image acquisition and quantification were performed under standardized conditions to minimize technical variability. All fluorescence images were captured using identical exposure parameters. For quantitative analysis, ImageJ software was applied with uniform threshold and background subtraction settings across all samples.
The pro-Col I/Col III ratio was calculated as the integrated density of pro-Col I divided by that of Col III within the corresponding analyzed region and was used as a semiquantitative parameter rather than an absolute molar or mass ratio.
Enzyme-linked immunosorbent assay
After stimulating the mature full-thickness skin model with TGF-β, the samples were further cultured for
Sequencing and analysis
Tissue constructs were snap-frozen in liquid nitrogen for RNA sequencing. Total RNA was extracted from full-thickness skin models (three independent experiments were performed for each group) using the Quick-RNA MicroPrep Kit (Zymo Research, Cat# R1050) according to the manufacturer’s protocol. For RNA-seq analysis of the engineered models, control and keloid models were generated using cells from one normal control donor and one keloid patient, respectively, with three independently prepared model samples analyzed for each condition. RNA quantity and quality were evaluated using a Qubit 4.0 Fluorometer (Invitrogen, USA) and an Agilent 2100 Bioanalyzer (Agilent Technologies, USA), respectively. RNA-seq libraries were constructed with the VAHTS Stranded mRNA-seq Library Prep Kit for Illumina (Vazyme Biotech, Cat# NR601) and sequenced on the NovaSeq 6000 platform (Illumina, USA), producing 150 base pair paired-end reads. Sequence reads from the full-thickness skin models underwent quality control and trimming with Fastp (v0.23.2). The trimmed reads were aligned to the human reference genome GRCh38 (GENCODE Release 47, GRCh38.p14) using HISAT2 (v2.2.1). Gene expression levels were quantified by counting reads per gene with StringTie (v2.2.1). Differential expression analysis was conducted using the DEGseq (1.58.0) R package. For comparison with human keloid tissues, publicly available RNA-seq data from normal skin and keloid tissues were retrieved from the Gene Expression Omnibus (GEO) database under accession number GSE237752 and used as an external reference. Differential expression analysis of RNA-seq data was performed using DESeq2 (1.44.0). Gene expression differences were modeled based on the negative binomial distribution implemented in DESeq2 (1.44.0). Multiple testing correction was performed using the Benjamini–Hochberg method to control the false discovery rate (FDR). Genes with an adjusted P-value (padj) < 0.05 and an absolute log2 fold change (|log2FC|) ≥ 1 were considered significantly differentially expressed genes (DEGs). Following the identification of DEGs, pathway enrichment analysis was carried out using the Kyoto Encyclopedia of Genes and Genomes (KEGG) database to pinpoint relevant signaling pathways. Additionally, Gene Ontology (GO) enrichment analysis was performed to classify DEGs into biological processes (BPs), cellular components (CCs), and molecular functions (MFs). All genes were ranked based on their differential expression statistics, and Gene Set Enrichment Analysis (GSEA) was conducted using gene sets from the Molecular Signatures Database (MSigDB).
Statistical analysis
Given the exploratory nature of this study and the practical constraints of fabricating full-thickness SoC models, a sample size of at least three replicates was predetermined for each condition. Intergroup differences were evaluated by Student’s t-test (two groups) or one-way analysis of variance (ANOVA; three or more groups) with Tukey’s multiple comparisons test. All data are presented as mean ± standard deviation (SD). All statistical analyses were performed using GraphPad Prism 9.5 software with a 95% confidence interval. The specific type of replicate (technical replicate, biological replicate, or independent experiment) for each dataset is indicated in the corresponding figure legend and Methods section. Statistical significance was set at P < 0.05.
RESULTS AND DISCUSSION
Construction and dynamic culture of a full-thickness SoC platform for modeling keloid-like fibrotic features
The experimental procedure is illustrated in Figure 1A. Primary skin samples were obtained from surgical tissues with informed consent. After enzymatic digestion and processing, normal human keratinocytes and dermal fibroblasts, as well as keratinocytes and fibroblasts derived from keloid tissues, were isolated and cultured separately. After expansion in monolayer culture, these cells were incorporated into dermal gel matrices to reconstruct the dermal equivalents. Notably, keloid-derived fibroblasts were mixed with a stiffer hydrogel to mimic the fibrotic microenvironment of keloid tissue and reconstruct a pathological dermal layer. Following 4 days of dermal layer formation and stabilization, keratinocytes were seeded on top to form the epidermal layer. After 2 days of submerged culture to allow cell attachment and proliferation, the constructs were exposed to the air–liquid interface to induce epidermal differentiation and stratification (as shown in Figure 1B).
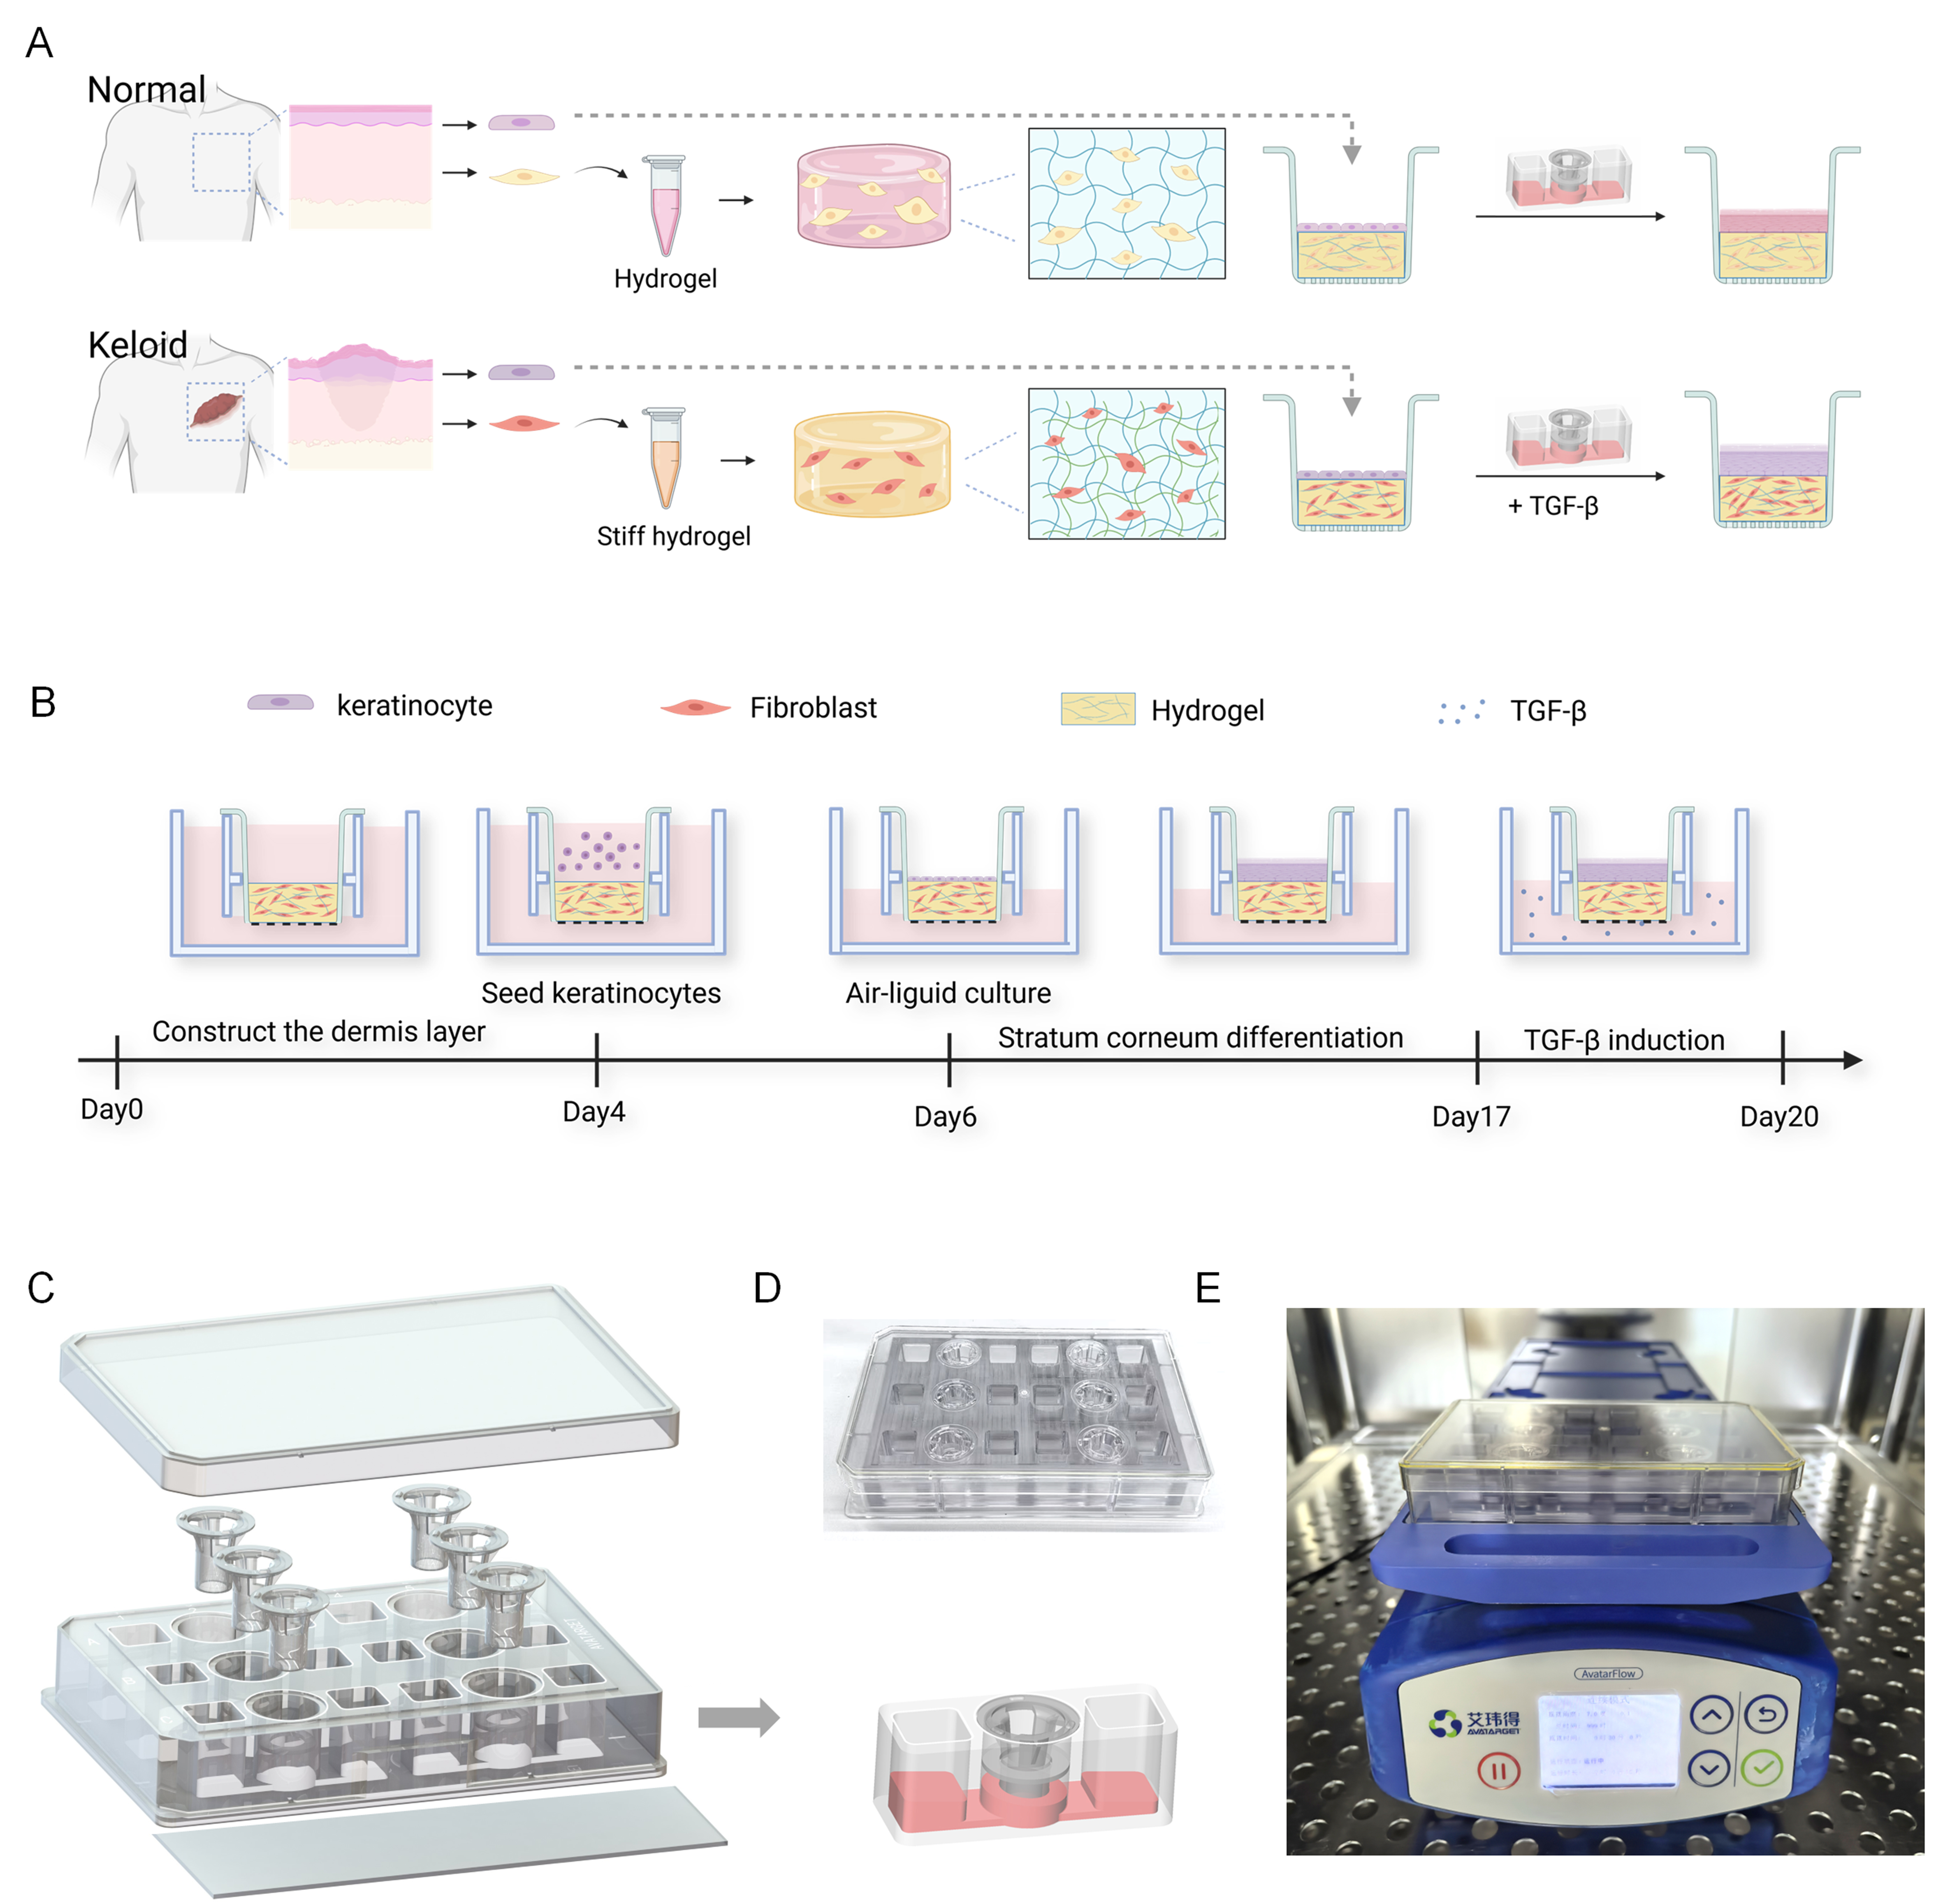
Figure 1. Design of a full-thickness SoC platform and tissue construction. (A) Schematic of experimental design. Primary keratinocytes and fibroblasts were isolated from normal and keloid donors. Fibroblasts were mixed with dermal hydrogels; stiffer gels were used for keloid-like models. After dermal maturation, keratinocytes were seeded. TGF-β induction generated full-thickness normal and keloid-like models; (B) Workflow of full-thickness model constructed in SoC. Keratinocytes were seeded on day 4. After 2 days of submerged culture, the air–liquid interface culture was continued. On day 17, the inducing factor was added to the SoC, and dynamic cultivation was continued for 72 h. Created with BioRender.com; (C) Exploded chip view. Box: single unit; arrows: 3D reconstruction of cultured model; (D) An actual photograph of the assembled chip; (E) Chip under dynamic culture on a shaking machine. (D) and (E), author’s original photographs. SoC: Skin-on-chip; TGF-β: transforming growth factor-beta.
On Day 17, the full-thickness models were transferred to the shaking machine for dynamic cultivation. Experimental groups were treated with specific reagents according to the study design. The constructs were then cultured under rocking conditions (7° every 30 min) for 72 h to enable dynamic medium circulation during treatment.
The structure of the chip is shown in the exploded view of Figure 1C. It consists of four parts arranged from top to bottom: the cover, insert, reservoir plate, and baseplate. Each chip contains six repeating units and can cultivate six biological models. Each unit features a three-hole series structure. The middle hole holds the insert, and the porous membrane of the insert separates the hole into upper and lower parts. The two side holes serve as medium reservoirs that connect to the lower parts of the middle hole via microchannels. Figure 1D presents the complete physical appearance of the chip. Figure 1E illustrates the process of dynamic cultivation. The chip is placed on a shaking machine (Avatarget, Jiangsu, China) with culture medium added to the side holes. The fluid in the side holes can create a height difference, causing the medium to flow back and forth under gravity, thereby enabling dynamic cultivation and nutrient exchange for the biological models. The fluid parameters required for model construction can be obtained through the parameter settings of the shaking machine.
Pathological morphology and gene expression differences between keloid and normal skin tissues
Histological and gene expression analyses were performed on keloid and normal skin tissues. H&E staining showed that the normal skin exhibited an intact epidermal structure with orderly arranged cells. Fibroblasts were evenly distributed within the dermis, and collagen fibers were loosely arranged in parallel bundles. In contrast, the keloid tissue displayed a slightly thickened epidermis, a significantly increased number of fibroblasts in the dermis, and a markedly elevated collagen content. The collagen fibers were disorganized, forming numerous thick, interwoven bundles. Masson’s trichrome staining further demonstrated a pronounced increase in dermal staining intensity in keloid tissue, indicating significantly elevated collagen deposition and disordered fiber arrangement [Figure 2A].
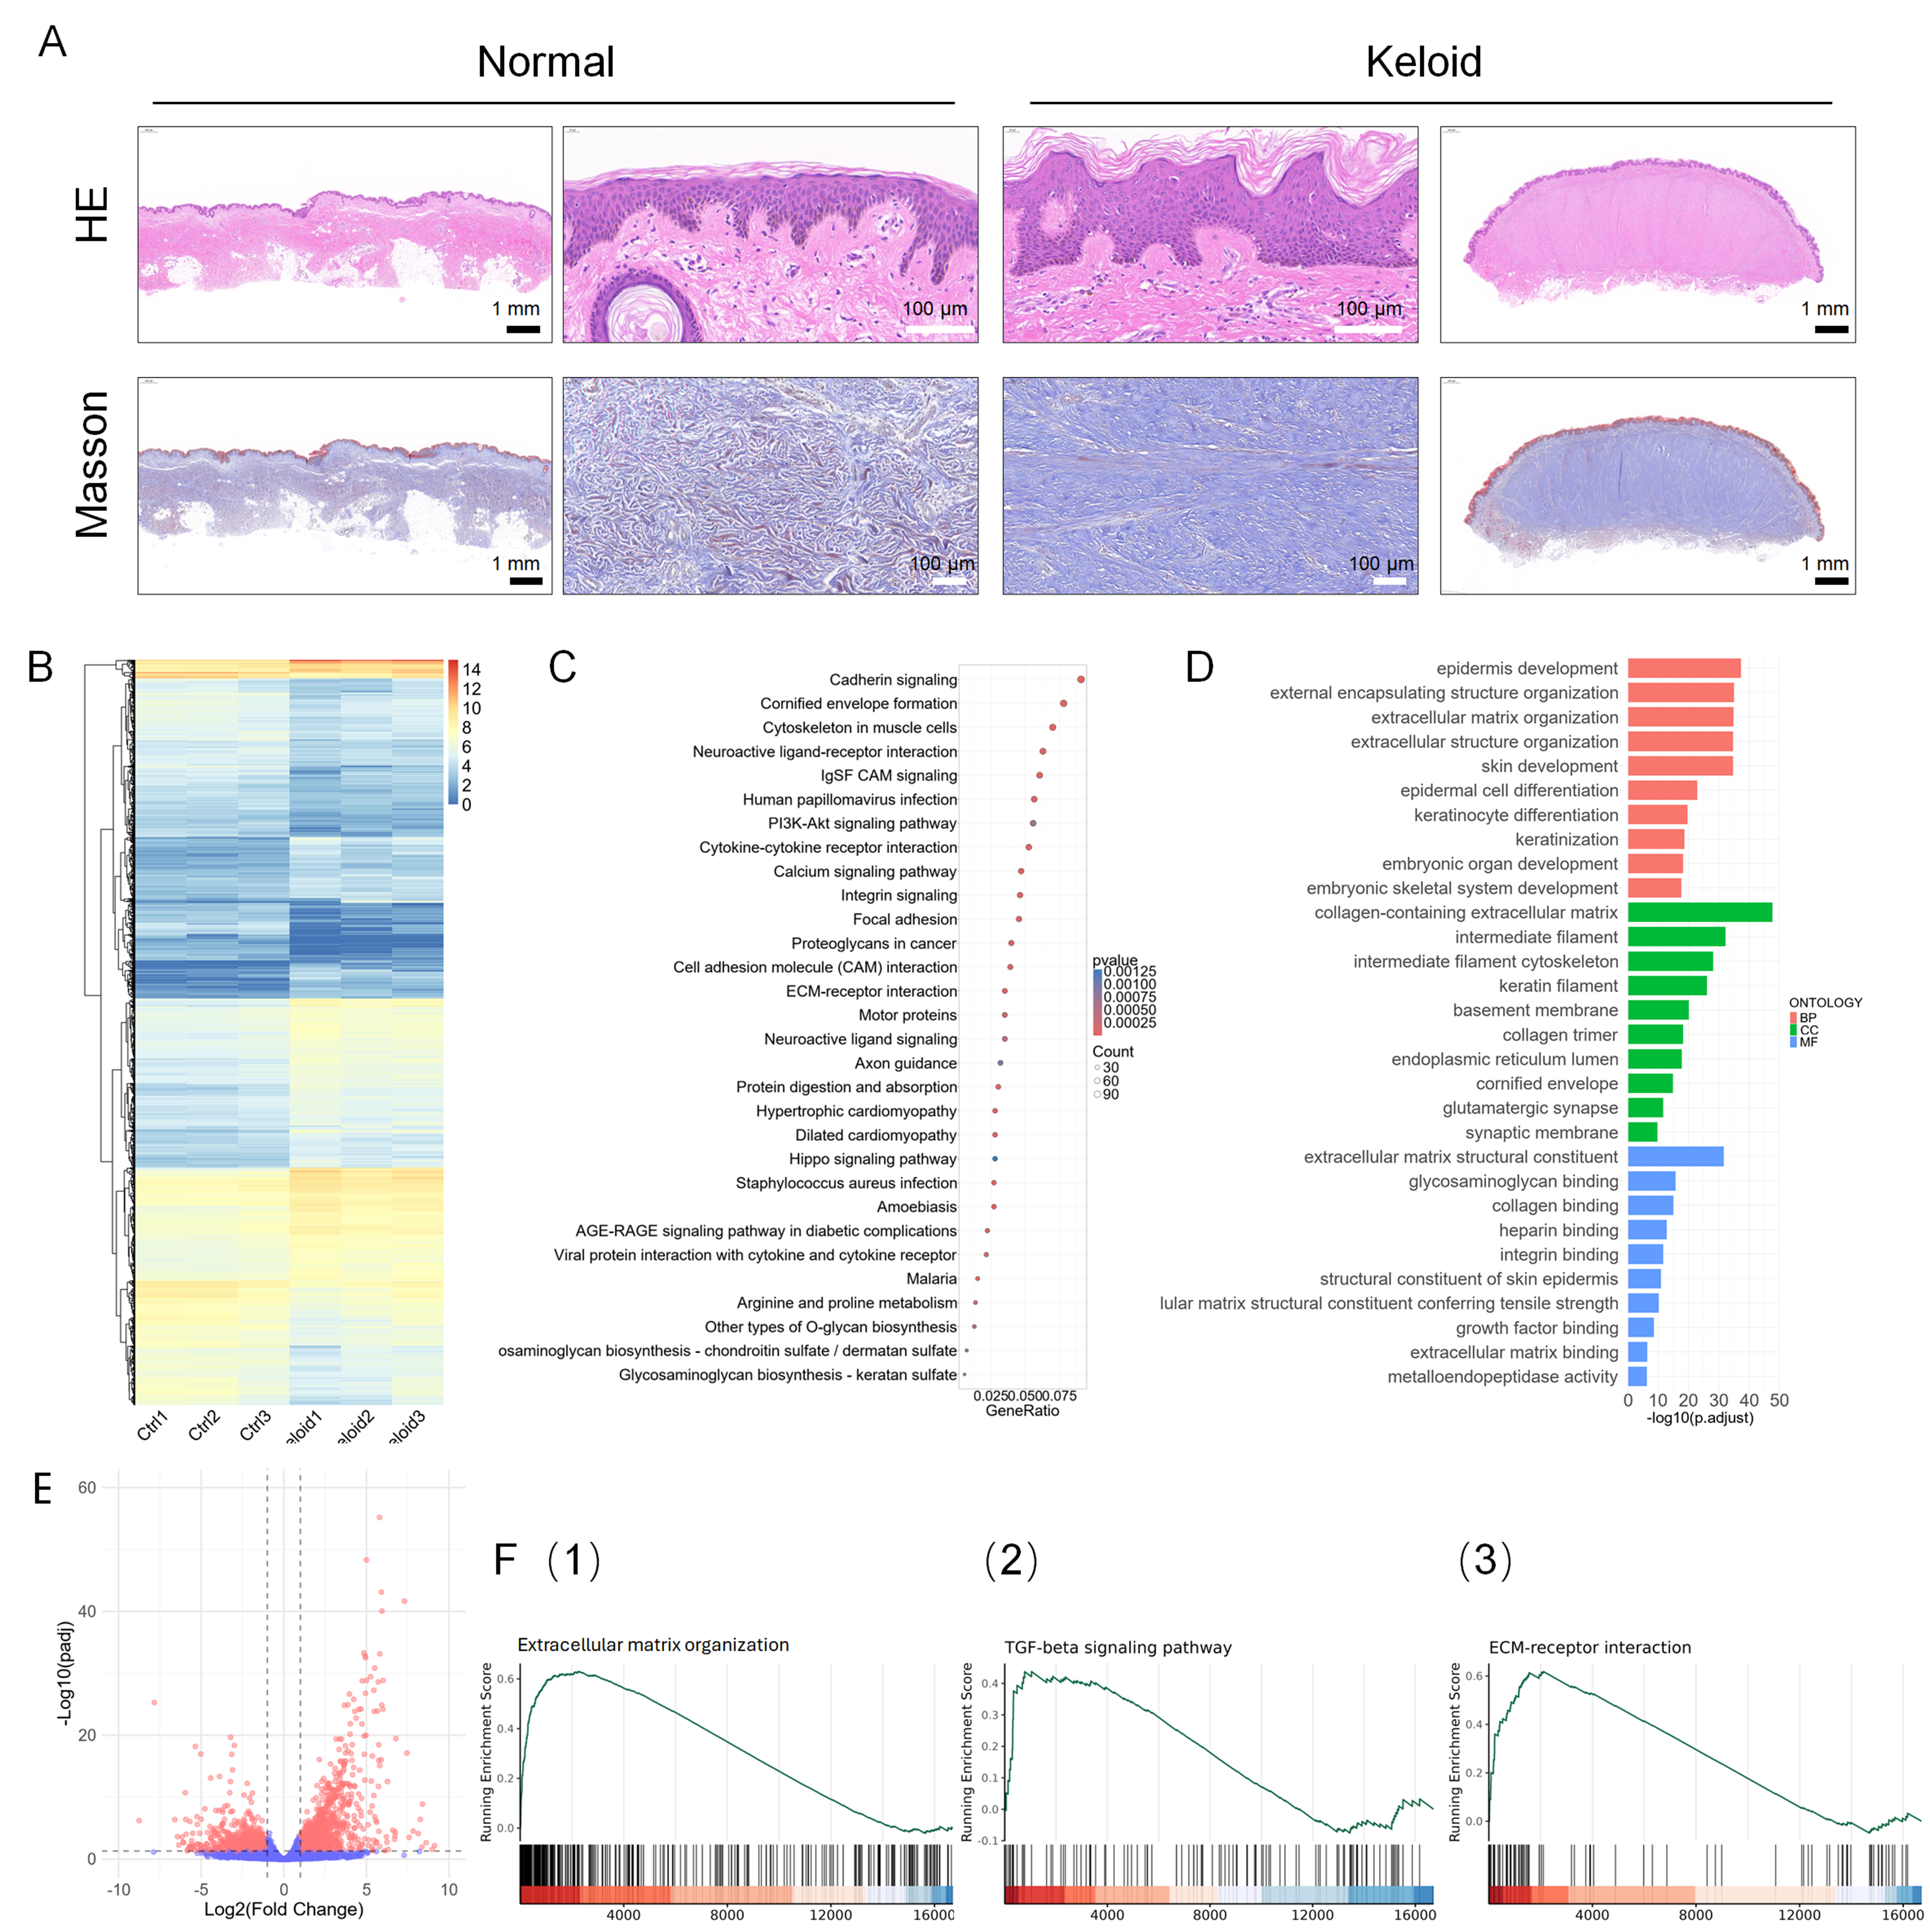
Figure 2. Morphological and gene expression comparison between primary normal and keloid skin tissues. (A) H&E and Masson staining of primary skin tissues. Outer panels: whole-tissue view at 2× magnification; center panels: localized region at 40× magnification. Scale bar: 1 mm (black), 100 μm (white); (B-F) presents the RNA-seq analysis results from the GSE237752 dataset, comparing gene expression profiles between keloid and normal skin samples. (B) A heatmap of DEGs, with red indicating high expression and blue indicating low expression; (C) A bubble plot of KEGG pathway enrichment analysis for DEGs, where dot color represents the P-value and dot size indicates the number of enriched genes; (D) GO enrichment analysis of DEGs, encompassing BPs, CCs, and MFs; (E) A volcano plot of DEGs, with downregulated genes on the left and upregulated genes on the right; (F) GSEA showing enrichment of (1) the GO term “ECM organization”, (2) the KEGG pathway “ECM‑receptor interaction”, and (3) the KEGG pathway “TGF‑β signaling pathway”. Analyses are based on independent biological replicates (n = 3 per group). H&E: Hematoxylin and eosin; DEGs: differentially expressed genes; KEGG: Kyoto Encyclopedia of Genes and Genomes; GO: Gene Ontology; BPs: biological processes; CCs: cellular components; MFs: molecular functions; GSEA: Gene Set Enrichment Analysis; ECM: excessive extracellular matrix; TGF‑β: transforming growth factor-beta.
To provide a human tissue reference for the transcriptomic characterization of the engineered model, we further analyzed the publicly available RNA-seq dataset GSE237752 containing normal skin and keloid tissues. Gene expression profiling was performed on both groups of samples. Comparative analysis revealed a total of 17,989 genes detected in both keloid and normal skin tissues [Figure 2B]. KEGG pathway enrichment indicated aberrant activation of pathways such as PI3K-Akt signaling and cytokine–cytokine receptor interaction in keloid tissue compared with normal skin [Figure 2C]. GO enrichment analysis showed significant clustering in terms associated with BPs, CCs, and MFs, including ECM organization, collagen-containing ECM, and collagen binding [Figure 2D]. Differential expression analysis identified 2,745 DEGs, of which 1,466 genes were significantly upregulated and 1,279 were significantly downregulated in keloid tissue [Figure 2E]. GSEA further demonstrated marked upregulation of ECM organization [Figure 2F(1)] and significant enrichment of the TGF-β signaling pathway and ECM–receptor interaction [Figure 2F(2) and (3)], indicating abnormal TGF-β signaling and ECM remodeling in keloid tissue.
Characterization of the mechanical properties of normal skin and keloid tissue for hydrogel design
To construct a 3D hydrogel–skin tissue culture model, a GelMA/SA dual-network hydrogel system was employed [Figure 3A], which was prepared by UV light curing for 30 s followed by immersion in calcium chloride solution [Figure 3B]. To mimic the increased stiffness characteristic of keloid tissue, trehalose was further incorporated into the system as an entangling agent for hydrogel molecular chains. Rheological and mechanical characterizations were performed to profile native skin tissues and validate the biomimetic capacity of the engineered hydrogels. In logarithmic strain sweep tests [Figure 3C], distinct stress–strain behaviors were observed across the groups. Specifically, the stiff hydrogel (5% GelMA + 0.5% SA + 1% trehalose) exhibited an initial stress of approximately 2.1-2.2 × 10³ Pa, closely resembling the profile of keloid tissue, which initially reached nearly 2.0 × 10³ Pa at the onset of shearing; both displayed pronounced strain-dependent softening, with stress decreasing markedly as strain increased from 0.1% to 100%. Conversely, the soft hydrogel (5% GelMA + 0.5% SA) maintained a stable stress plateau of roughly 1.1 × 10³ Pa, which approximated the behavior of normal skin tissue, with a corresponding initial level of about 1.0 × 10³ Pa.
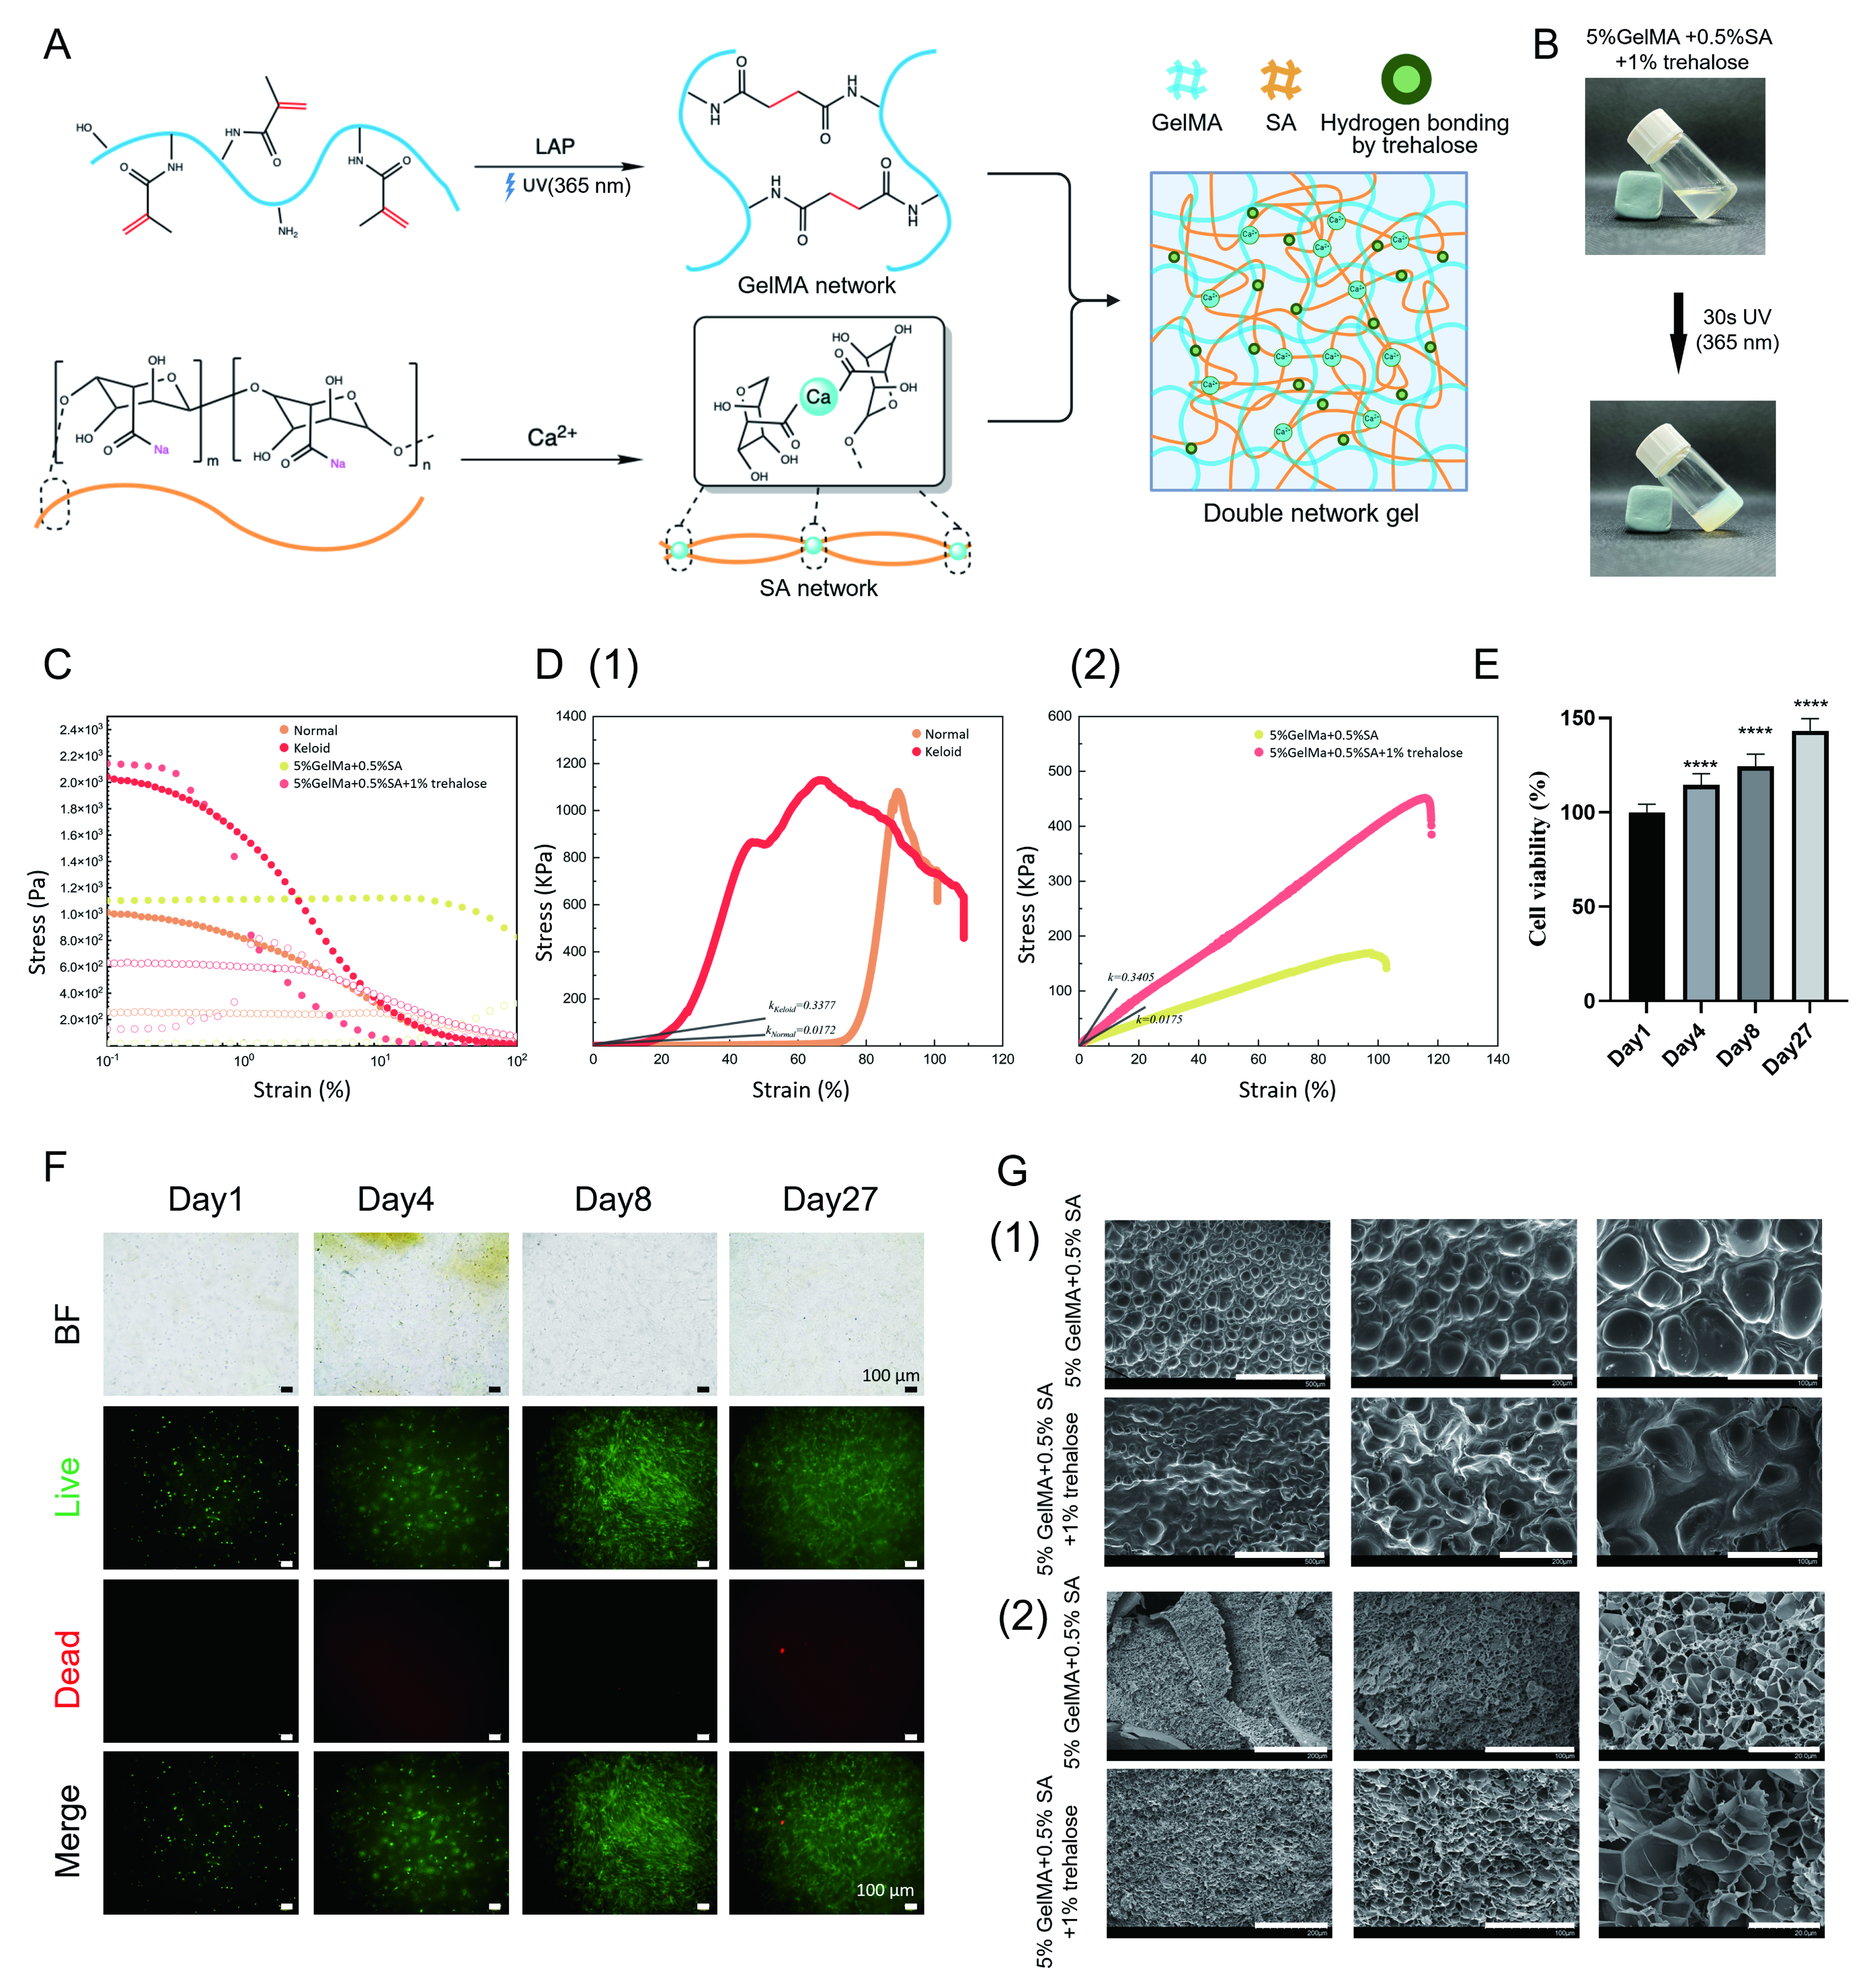
Figure 3. Characterization of the soft and stiff hydrogel. (A) Schematic illustration of the fabrication of the mechanically tunable GelMA/SA dual-network hydrogel. Created with BioRender.com; (B) Gelation process of keloid stiff hydrogel (author’s original photograph); (C) Strain sweeps of keloid tissue and GelMA/SA hydrogels confirm their similar rheological characteristics; (D) Tensile test of normal skin and keloid tissue demonstrates higher stiffness in skin fibrosis. Different GelMA/SA hydrogel systems were used to mimic the distinctions of stiffness (in Young’s modulus); (E) Cell viability and (F) distribution of keloid cells within the hydrogel after 4 weeks (live: green, dead: red); (G) Surface and inner structure of hydrogel. Statistical significance was determined by one-way ANOVA with Tukey’s multiple comparisons test. Data are shown as mean ± SD. Analyses are based on technical replicates (n = 3 per group). ****P < 0.0001; ns, not significant. Scale bar: (F) 100 μm; (G) from left to right: (1) 500, 200 and 100 μm, (2) 200, 100 and 20 μm. GelMA: Gelatin methacryloyl; SA: sodium alginate; ANOVA: analysis of variance; SD: standard deviation; LAP: lithium phenyl-2,4,6-trimethylbenzoylphosphinate; UV: ultraviolet; BF: bright field.
To quantitatively confirm these mechanical similarities, the elastic moduli were derived from the linear regression slopes of the stress–strain curves. Mechanical testing of native tissues revealed elastic moduli of 1.72 kPa for normal skin and 33.77 kPa for keloid tissue [Figure 3D(1)]. In parallel, the optimized hydrogels yielded moduli of 1.752 and 34.05 kPa for the soft and stiff formulations, respectively [Figure 3D(2)], which were nearly identical to the corresponding native tissue values.
Cell viability assays [Figure 3E] and live/dead staining [Figure 3F] showed normal cell proliferation over 4 weeks, confirming the excellent biocompatibility of the hydrogel system. Morphological characterization demonstrated a loose, porous microstructure favorable for cell growth and migration [Figure 3G]. While this porosity is conducive to cell infiltration and nutrient diffusion, it should be noted that freeze-drying does not accurately represent the native hydrated architecture present during cell culture. Moreover, the soft and stiff hydrogels exhibited swelling ratios of approximately 9.706 and 8.603, respectively, providing additional characterization of the swelling behavior of the two hydrogel formulations [Supplementary Figure 1].
Meanwhile, the role of biomechanical regulation in keloid development has gained increasing attention in recent years. Mechanical stimulation has been reported to promote fibroblast activation, abnormal ECM deposition, and elevated secretion of profibrotic factors, contributing to a positive feedback loop between matrix stiffness and fibrosis progression[33]. In the present SoC model, a mechanically tuned microenvironment was incorporated to reproduce the increased matrix stiffness associated with keloid tissue [Figure 3]. The pathological matrix stiffness was subsequently combined with keloid-derived cells and TGF-β1 stimulation in the K-S-T model and therefore represents an integrated mechanical component of the engineered fibrotic microenvironment rather than an independently resolved factor.
Isolation of primary skin cells and characterization of SoC model
Primary skin matrix cells, including keratinocytes and fibroblasts, were isolated from normal skin and keloid tissues. In 2D culture, keratinocytes expressed the characteristic marker CK14, while fibroblasts expressed vimentin. Notably, fibroblasts derived from keloid tissue showed increased expression of the myofibroblast marker α-SMA compared with those from normal skin [Figure 4A]. Construct contraction analysis showed greater area reduction in the K-N-N group than in the N-N-N group, while the K-S-T constructs largely maintained their area [Supplementary Figure 2].
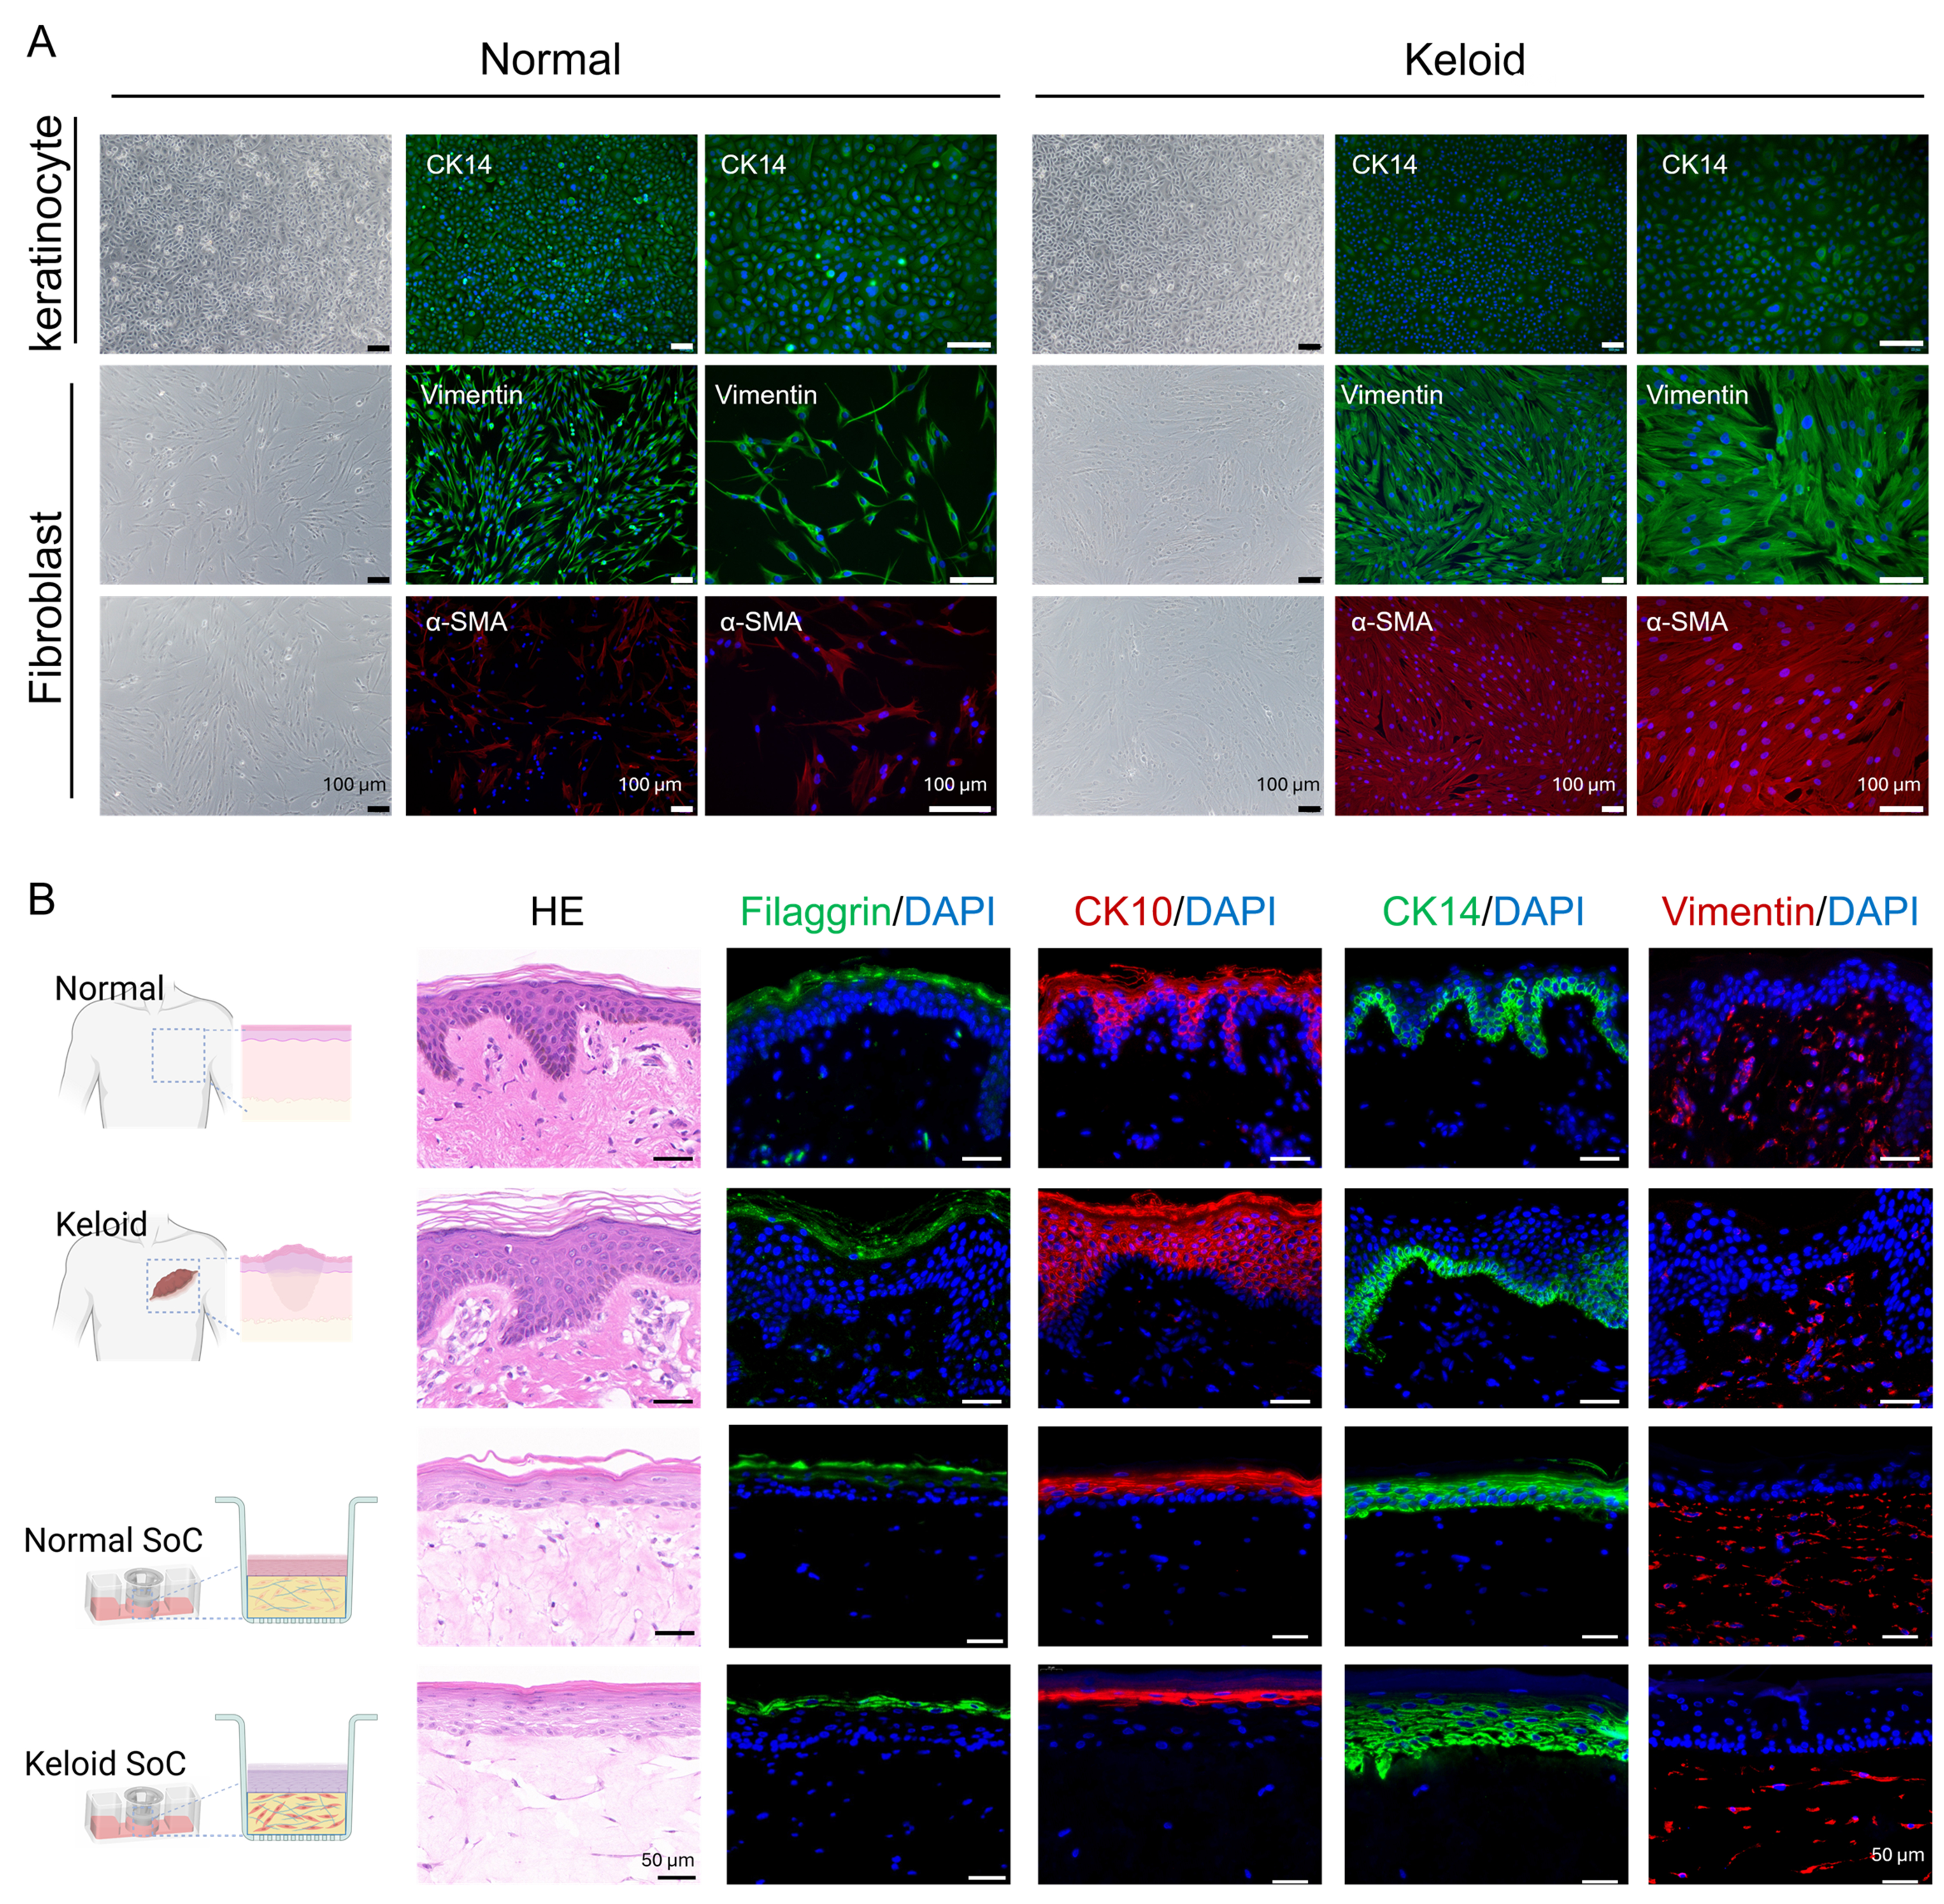
Figure 4. Characterization of primary cells and comparison between native tissues and SoC models. (A) Each row contains three images: the leftmost is the bright-field image, the middle is a fluorescence image captured at 10× magnification, and the rightmost is a fluorescence image captured at 20× magnification. The first row shows bright-field images and CK14 IF staining of keratinocytes from normal control donor and keloid patients. The second row shows bright-field images and Vimentin IF staining of fibroblasts from normal control donor and keloid patients. The third row shows bright-field images and α-SMA IF staining of fibroblasts from normal control donor and keloid patients. DAPI (blue), CK14 and Vimentin (green), α-SMA (red). Scale bar: 100 μm; (B) H&E staining and IF staining of filaggrin (green), CK10 (red), CK14 (green), and Vimentin (red) with DAPI (blue) were performed on normal skin, keloid skin, and both normal and keloid SoC models. Scale bar: 50 μm. Created with BioRender.com. Analyses are based on technical replicates (n = 3 per group). SoC: Skin-on-chip; IF: immunofluorescence; α-SMA: α-smooth muscle actin; DAPI: 4′,6-diamidino-2-phenylindole; H&E: hematoxylin and eosin.
IF staining of native skin tissues further confirmed the expression of filaggrin, CK10, CK14, and vimentin in both normal and keloid samples, with the stratum corneum appearing slightly thicker in keloid tissue [Figure 4B]. Consistently, 3D full-thickness skin equivalents constructed on-chip using primary cells exhibited comparable structural organization. Filaggrin was localized in the differentiated epidermal layers, consistent with epidermal maturation. CK10 was detected in terminally differentiated keratinocytes, and CK14 in basal proliferative keratinocytes. In the dermal compartment, fibroblasts showed strong vimentin staining. Collectively, these results demonstrate that the engineered skin equivalents faithfully reproduce the key histological and molecular features of native skin.
Gene expression comparison of keloid-like fibrotic SoC models generated by different engineering strategies
To evaluate which engineering strategy most effectively reproduced keloid-associated molecular changes, gene expression differences between human keloid and normal skin tissues were used as a pathological reference. These tissue-derived expression patterns were compared with the relative changes observed in three engineered SoC models: N-N-N, constructed using normal skin-derived cells and a soft matrix; K-N-N, constructed using keloid-derived cells and a soft matrix without TGF-β1 stimulation; and K-S-T, constructed using keloid-derived cells, a stiff matrix, and TGF-β1 stimulation. Rather than directly comparing absolute expression values across independent tissue and model datasets, we evaluated whether each model reproduced the direction and relative pattern of keloid-associated gene expression changes.
Based on the cell source, hydrogel type, presence or absence of factor induction, and drug treatment, different SoC construction strategies were established [Table 1]. Gene expression profiles were examined in normal skin tissue, keloid tissue, and three SoC models: N-N-N (normal cells + soft matrix), K-N-N (patient-derived cells + soft matrix), and K-S-T (patient-derived cells + stiff matrix + induction), to compare differences in the expression patterns of keloid-associated signature genes.
Group
| Model | N-N-N | K-N-N | K-S-T | K-S-T-N | K-S-T-F |
| Cell | Normal | Keloid | Keloid | Keloid | Keloid |
| Hydrogel | Normal | Normal | Stiff | Stiff | Stiff |
| TGF-β | - | - | + | + | + |
| Nintedanib | - | - | - | + | - |
| 5-FU | - | - | - | - | + |
Compared with normal skin, keloid tissue exhibited markedly elevated expression of TGF-β signaling–related genes (TGFB1, TGFB3, TGFBI, ACTA2). Among the SoC models, the K-S-T model showed the highest expression levels of these genes, significantly exceeding those in N-N-N, with the downstream effector ACTA2 showing the most pronounced increase [Figure 5A].
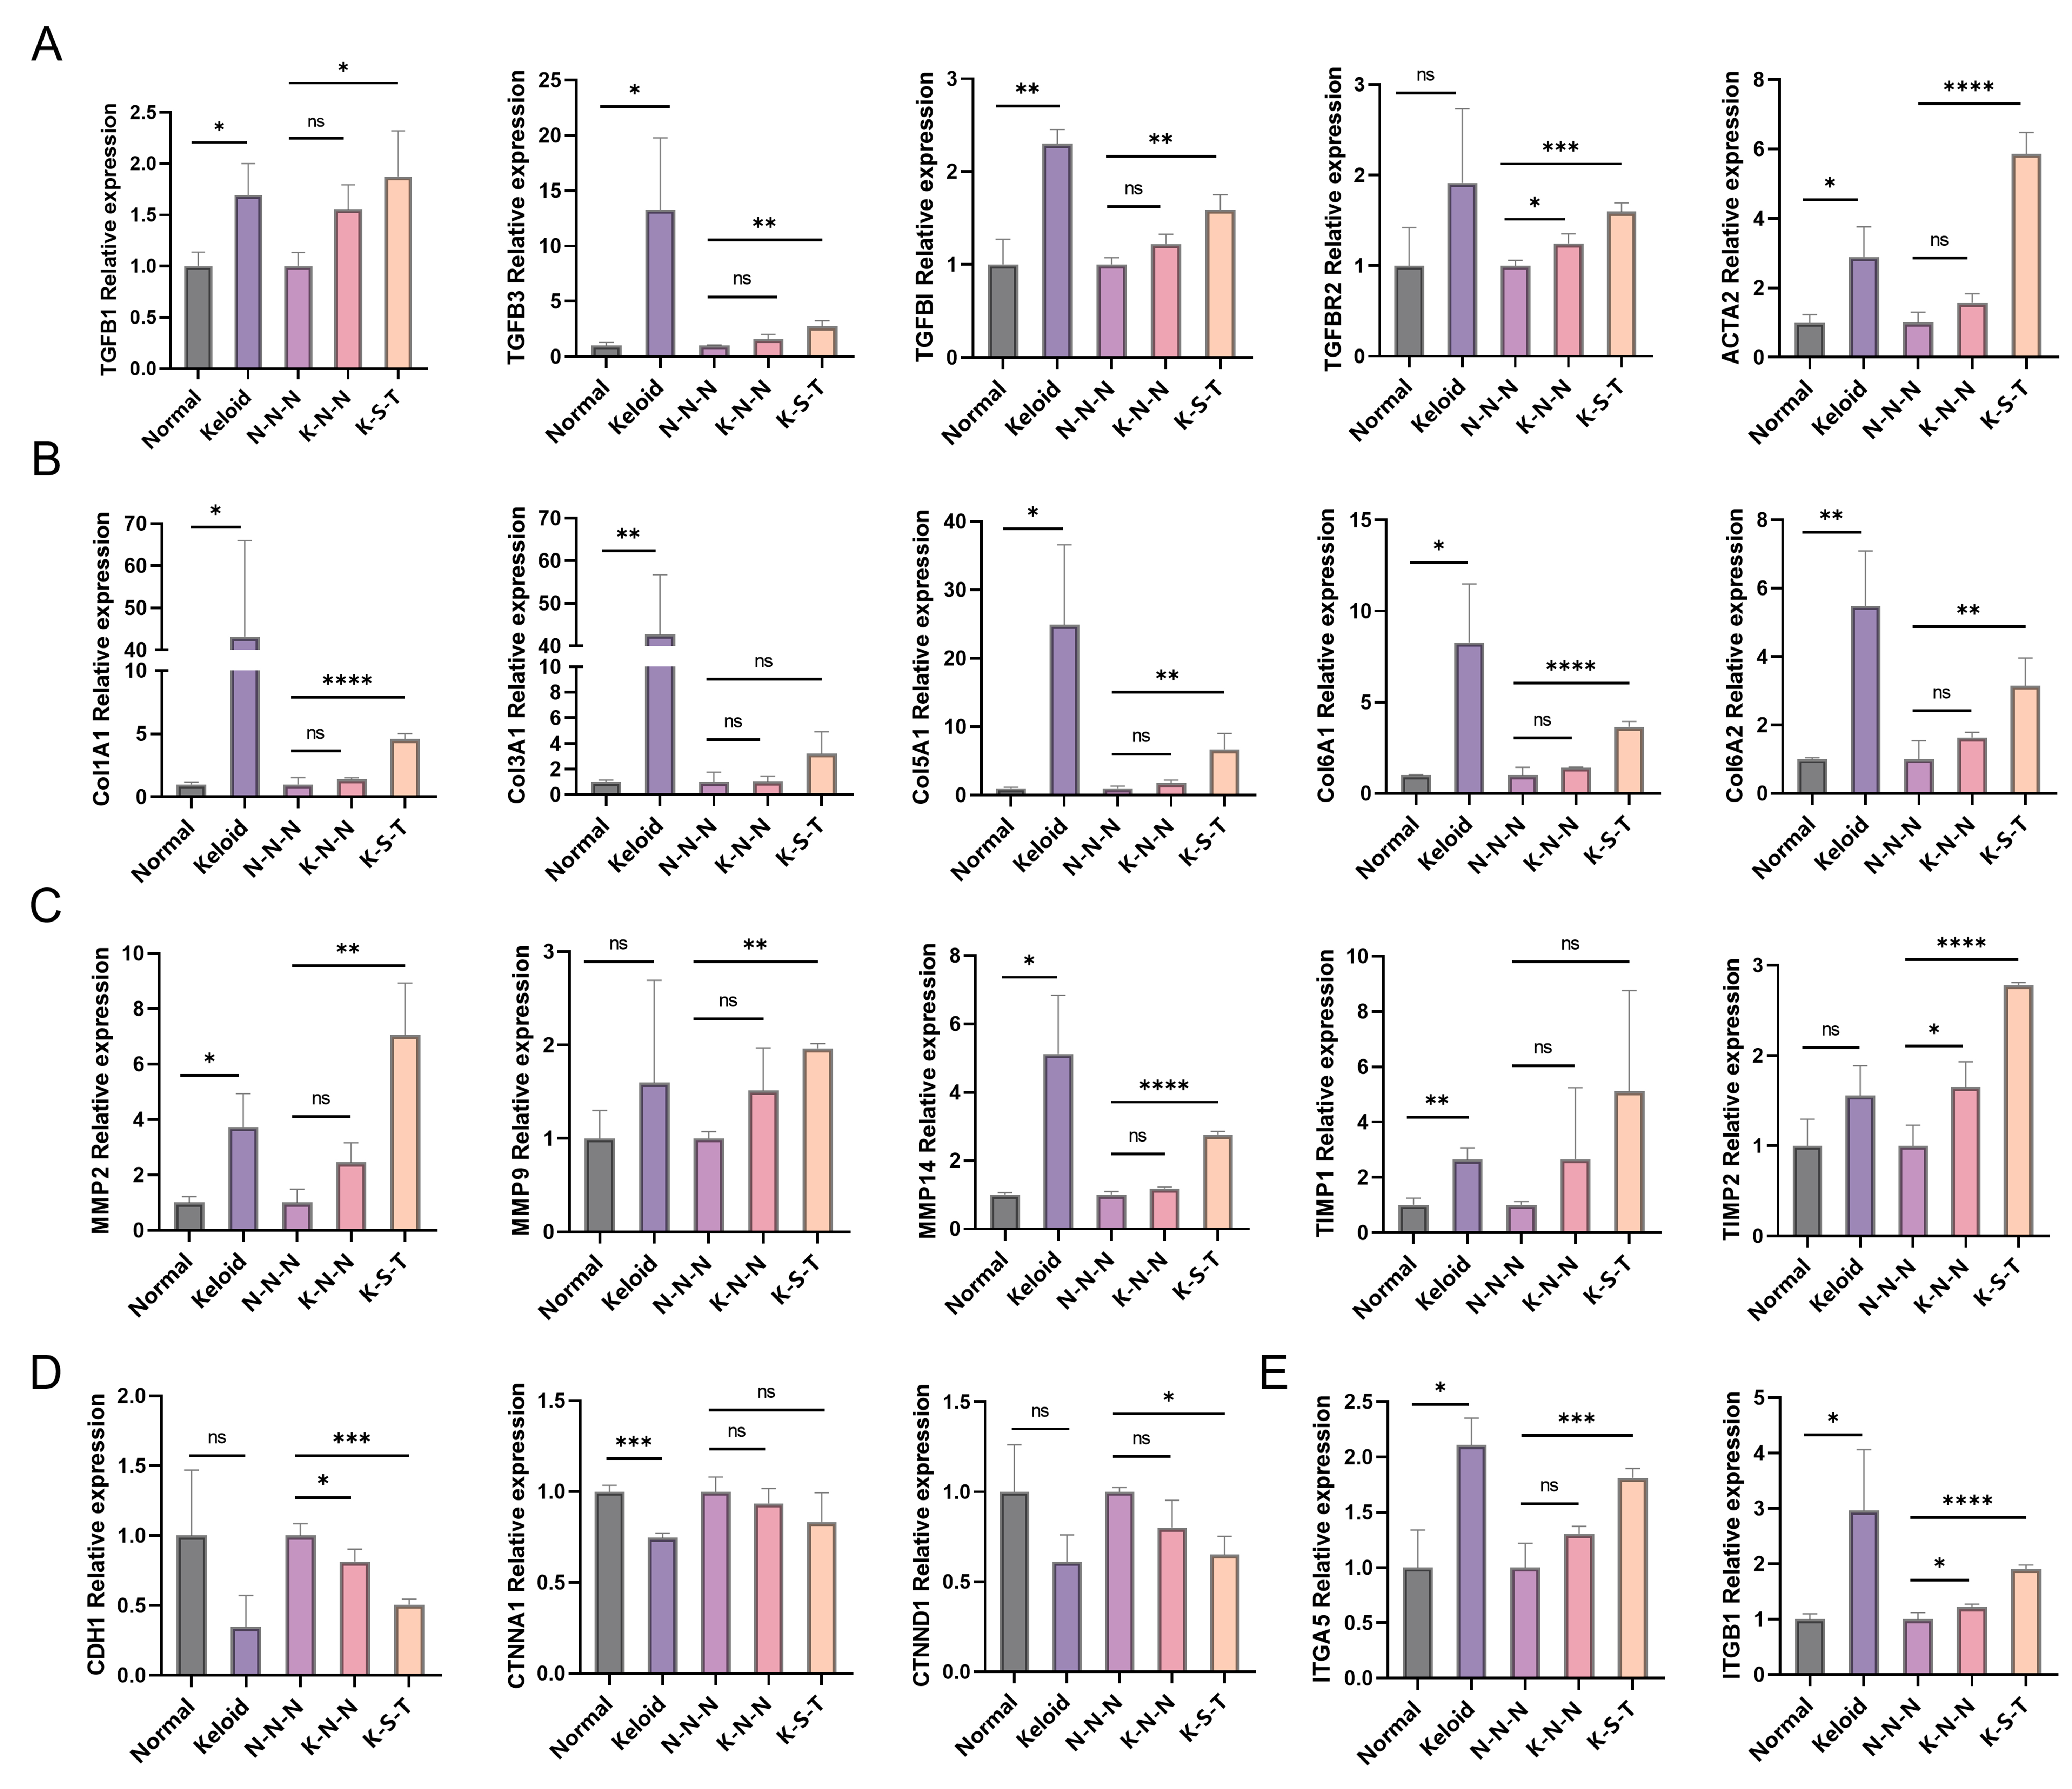
Figure 5. Evaluation of SoC construction strategies based on keloid-associated gene expression patterns. Tissue expression levels were normalized to the Normal group, and keloid/normal ratios were calculated based on TPM values. Model TPM values were normalized to the N-N-N group to calculate K-N-N/N-N-N and K-S-T/N-N-N ratios. Comparisons were performed between Keloid and Normal tissues, and between N-N-N and K-N-N and between N-N-N and K-S-T. (A) TGF-β pathway–related genes: TGFB1, TGFB3, TGFBI, TGFBR2, ACTA2; (B) ECM-related genes: COL1A1, COL3A1, COL5A1, COL6A1, COL6A2; (C) Protein degradation and excessive fibrosis–related genes: MMP2, MMP9, MMP14, TIMP1, TIMP2; (D) EMT–related genes: CDH1, CTNNA1, and CTNND1; (E) Integrin signaling: ITGA5, ITGB1. For tissue samples (Normal and Keloid), biological replicates were obtained from different donors (n = 3). Statistical significance was determined by two-tailed Student’s t-test or Mann–Whitney U test following Shapiro–Wilk normality test. For model data (N-N-N, K-N-N, and K-S-T), independent experiments were performed on separate occasions with the same donor-derived cells (n = 3). One-way ANOVA with Tukey’s post-hoc test was used for multiple pairwise comparisons. Data are presented as mean ± SD. *P < 0.05, **P < 0.01, ***P < 0.001, ****P < 0.0001; ns, not significant. SoC: Skin-on-chip; TPM: transcripts per million; TGF-β: transforming growth factor-beta; ECM: excessive extracellular matrix; EMT: epithelial–mesenchymal transition; ANOVA: analysis of variance; SD: standard deviation.
Genes encoding ECM components (Col1A1, Col3A1, Col5A1, Col6A1, Col6A2) displayed a similar pattern: their expression was significantly higher in keloid tissue than in normal skin; within the SoC models, collagen gene expression was greater in K-S-T than in the other two models, with Col1A1 and Col6A1 exhibiting the most notable differences [Figure 5B].
For ECM remodeling–related genes (MMP2, MMP9, MMP14, TIMP1, TIMP2), the expression of MMP2, MMP14 and TIMP1 was significantly higher in keloid tissue than in normal skin. In the SoC models, both K-N-N and K-S-T showed expression patterns similar to those observed in tissue samples when compared with N-N-N, with the K-S-T group displaying more marked differences for all genes except TIMP1 [Figure 5C].
Epithelial–mesenchymal transition (EMT)–related genes (CDH1, CTNNA1, CTNND1) were expressed at lower levels in keloid tissue than in normal skin. The SoC models displayed a similar trend: EMT gene expression decreased in K-S-T and K-N-N compared with N-N-N. Except for CTNNA1, the decrease was significantly greater in K-S-T [Figure 5D].
In addition, integrin/receptor family genes (ITGA5, ITGB1) were expressed at significantly higher levels in keloid tissue than in normal skin. In the SoC models, K-S-T exhibited significantly higher expression of these genes compared with the other two models [Figure 5E].
These results indicate that the combined use of keloid-derived cells, a stiff matrix, and TGF-β1 stimulation more effectively reproduced selected keloid-associated gene expression patterns than the other tested construction strategies.
Keloid, as a prototypical fibroproliferative disorder, is characterized by the overactivation of fibroblasts and aberrant deposition of ECM components, which represent well-established core pathological features[1]. Among them, abnormal activation of the TGF-β signaling pathway is closely associated with keloid fibrosis[34]. The increased expression of TGF-β signaling-related genes and ECM components observed in the K-S-T model therefore supports its ability to reproduce selected molecular features associated with keloid fibrosis.
ECM remodeling is another important feature of keloid pathology. MMPs and TIMPs participate in the dynamic regulation of ECM turnover, and their dysregulation has been associated with abnormal scar formation[35]. In the present study, the altered expression of MMP2, MMP14, and TIMP1 in the engineered models showed patterns similar to those observed in keloid tissue, further supporting the pathological relevance of the model at the level of ECM remodeling.
EMT-related processes have also been implicated in tissue repair and fibrosis[36], and aberrant expression of EMT-related genes has been reported in keratinocytes derived from keloid tissue[33,37,38]. In our SoC model, altered expression of EMT-associated genes, including downregulation of CDH1, was observed [Figure 5D]. These findings suggest that the epidermal–dermal composite model captures selected molecular changes associated with EMT-related processes in keloid pathology.
In addition, the K-S-T model also exhibited increased expression of the integrin-related genes ITGA5 and ITGB1 [Figure 5E]. Integrin-mediated mechanotransduction pathways have been implicated in fibrotic progression[39]. However, direct activation of downstream mechanotransduction pathways, such as the FAK-YAP/TAZ axis, was not assessed in the current study. Therefore, these findings indicate altered integrin-associated gene expression in the engineered fibrotic microenvironment but do not establish the activation of a specific mechanotransduction mechanism.
Characterization and antifibrotic drug response of the keloid-like fibrotic SoC model
Histopathological analysis [Supplementary Figure 3] showed that, compared with normal skin, keloid tissue exhibited increased thickness and enlarged collagen bundles in the dermis. IHC and IF further demonstrated significantly elevated expression of type I and type III collagen in keloids, accompanied by reduced expression of vimentin and markedly increased expression of α-SMA. To recapitulate these pathological features, we established a keloid SoC model (K-S-T) by integrating stiff hydrogels with primary keloid-derived skin cells and inducing fibrosis through TGF-β1 stimulation, followed by evaluation of drug responses to nintedanib and 5-FU [Figure 6A].
Figure 6. Expression of specific proteins and inflammatory factors in the normal group, keloid SoC model group, and model groups treated with nintedanib or 5-FU. (A) Induction and drug intervention process in keloid SoC. Created with BioRender.com; (B) IHC for pro-Col I, and IF staining for Col III (green), Vimentin (red), α-SMA (green), and DAPI (blue). Scale bar: 100 μm; (C) Quantification of pro-Col I/Col III ratio and fluorescence intensities of pro-Col I, Col III, Vimentin, and α-SMA. Analyses are based on technical replicates (n = 3 wells); (D) Changes in inflammatory factor levels: IL-6, TNFα, IL-8, VEGF-A, IL-1α, and IL-1β. Analyses are based on technical replicates (n = 3 wells). Statistical significance was determined by one-way ANOVA with Tukey’s multiple comparisons test. *P < 0.05, **P < 0.01, ***P < 0.001, ****P < 0.0001; ns, not significant. SoC: Skin-on-chip; 5-FU: 5-fluorouracil; IHC: immunohistochemistry; IF: immunofluorescence; α-SMA: α-smooth muscle actin; DAPI: 4′,6-diamidino-2-phenylindole; IL-6: interleukin-6; TNFα: tumor necrosis factor-alpha; IL-8: interleukin-8; VEGF-A: vascular endothelial growth factor A; IL-1α: interleukin-1 alpha; IL-1β: interleukin-1 beta; ANOVA: analysis of variance; TGF-β: transforming growth factor-beta; NDNB: Nintedanib.
Compared with the normal control SoC constructed using soft hydrogels and normal skin-derived cells (N-N-N), the K-S-T model exhibited disorganized basal cell arrangement, which was restored to a more ordered architecture after drug treatment. As shown in Figure 6B and C, IHC and IF analyses indicated increased expression of type I collagen, type III collagen and α-SMA in the K-S-T model, all of which were reduced following drug exposure. However, vimentin showed a non-significant decrease in the K-S-T model relative to the N-N-N group. After drug treatment, vimentin expression was significantly increased in the nintedanib group compared with the K-S-T group, whereas 5-FU induced a non-significant decrease. Furthermore, the pro-Col I/Col III integrated-density ratio was markedly increased in the K-S-T model and significantly reduced following drug treatment. Furthermore, inflammatory cytokine profiling [Figure 6D] revealed significantly elevated secretion of IL-6, TNF-α, IL-8, VEGF-A, IL-1α and IL-1β in the K-S-T model, which were substantially reduced upon drug intervention.
To distinguish antifibrotic effects from nonspecific cytotoxicity, we assessed cell proliferation status using Ki67 IHC [Supplementary Figure 4]. Distinct Ki67-positive cells remained detectable in both epidermal and dermal compartments after treatment, indicating that proliferative activity was not completely abolished under the tested conditions.
Nintedanib is a multi-target receptor tyrosine kinase inhibitor targeting PDGFR, FGFR, and VEGFR, thereby attenuating multiple profibrotic signaling processes. This inhibition can suppress abnormal fibroblast proliferation and migration and reduce collagen synthesis and deposition. Using the keloid SoC, nintedanib treatment resulted in clear reductions in fibrosis-related phenotypes.
In normal dermis, collagen I and III are maintained in a relatively balanced composition, whereas this balance is altered in keloid tissue, with an increased type I/III collagen ratio[9]. In our disease SoC model, the ratio of collagen I to collagen III IF integrated density was markedly increased in the K-S-T group and was significantly reduced following nintedanib treatment [Figure 6C]. Although this image-derived ratio does not represent the absolute molar or mass ratio of collagen I to collagen III, its increase is directionally consistent with the elevated type I/III collagen ratio reported in keloid tissue, supporting the ability of the model to reproduce this characteristic pattern of ECM dysregulation.
Phenotypically, nintedanib treatment was associated with reduced ECM-related features and decreased inflammatory cytokine secretion [Figure 6B-D]. These findings are consistent with the known antifibrotic actions of nintedanib; however, the present single-concentration experiment does not permit definitive attribution of these changes to a specific mechanism.
The model was further used to preliminarily evaluate its responsiveness to the clinically used keloid therapy 5-FU. Treatment reduced the dermal type I/III collagen ratio, α-SMA expression, and secretion of inflammatory cytokines such as IL-6 and TNF-α [Figure 6]. Given the well-established antiproliferative activity of 5-FU, these phenotypic changes may reflect both suppression of cell proliferation and attenuation of fibrosis-associated features. The present data therefore cannot fully distinguish fibrosis-specific effects from general cytostatic or cytotoxic effects.
Transcriptome analysis of antifibrotic drug responses in the keloid-like fibrotic SoC model
On the established keloid SoC, the antifibrotic drug nintedanib and the clinically used keloid therapy 5-FU were applied to compare their therapeutic effects. Bulk RNA-seq analysis revealed pronounced global differences in gene expression patterns between the keloid SoC and the normal SoC. Upon treatment with nintedanib, the gene expression profile of the keloid chip shifted toward that of the normal control, with 5-FU showing a similar but less pronounced trend [Figure 7].
Figure 7. RNA-seq analysis of the N-N-N, K-S-T, K-S-T-N, and K-S-T-F groups. (A) GO enrichment analysis of upregulated (1) and downregulated (2) genes, respectively, from the comparison between the K-S-T and K-S-T-N groups, and (3) GSEA of the “ECM organization” BP from the GO database for the same comparison; (B) GO enrichment analysis of upregulated (1) and downregulated (2) genes, respectively, from the comparison between the K-S-T and K-S-T-F groups, and (3) GSEA of the “Nuclear division” BP from the GO database for the same comparison; (C) A heatmap of TGF-β-related gene expression; (D) A heatmap of cell cycle-related gene expression; (E) A heatmap of ECM-related gene expression; (F) A heatmap of RHO/ROCK pathway- and mechanics-related gene expression; (G) Schematic illustration of fibrotic SoC model induction and pharmacological intervention. Created with BioRender.com. Data represent independent experiments performed on separate occasions using the cells from the same donor (n = 3). GO: Gene Ontology; GSEA: Gene Set Enrichment Analysis; ECM: excessive extracellular matrix; BP: biological process; TGF-β: transforming growth factor-beta; SoC: skin-on-chip; CC: cellular component; MF: molecular function; α-SMA: α-smooth muscle actin.
In the comparison between the K-S-T and K-S-T-N (K-S-T model + nintedanib treatment) groups, GO enrichment analysis indicated that upregulated genes were mainly associated with calcium ion signaling, synaptic transmission, and keratinization-related processes, while downregulated genes were significantly enriched in ECM-related processes. Consistently, GSEA further showed significant negative enrichment of the BP “ECM organization” in the K-S-T-N group [Figure 7A]. By contrast, in the comparison between the K-S-T and K-S-T-F (K-S-T model + 5-FU treatment) groups, upregulated genes were predominantly enriched in keratinization, calcium-mediated signaling, synaptic signaling, and related processes, whereas downregulated genes were significantly associated with cell cycle, nuclear division, mitotic nuclear division, chromosome segregation, and other proliferative processes. GSEA further showed significant negative enrichment of the BP “nuclear division” in the K-S-T-F group [Figure 7B].
We further examined the expression of 68 key genes implicated in keloid pathophysiology, including the TGF-β/SMAD pathway [Figure 7C], cell proliferation [Figure 7D], ECM remodeling [Figure 7E], and the RHO/ROCK pathway [Figure 7F]. These differential transcriptional responses are broadly consistent with the known pharmacological actions of nintedanib and 5-FU. Nintedanib is a multi-target receptor tyrosine kinase inhibitor targeting VEGFR, FGFR, and PDGFR signaling, whereas 5-FU is an antimetabolite that interferes with DNA/RNA synthesis[40,41] [Figure 7G].
At the transcriptional level, nintedanib treatment was associated with changes in genes related to TGF-β/SMAD signaling, cell proliferation, and ECM remodeling [Figure 7]. Together with the phenotypic changes observed in Figure 6, these findings are consistent with the known antifibrotic actions of nintedanib. However, the present single-concentration experiment does not permit definitive attribution of these changes to a specific mechanism.
Transcriptomic analysis also showed substantial changes in proliferation- and ECM-related programs following 5-FU treatment [Figure 7]. Given the well-established antiproliferative activity of 5-FU, these transcriptional changes may reflect both suppression of cell proliferation and attenuation of fibrosis-associated phenotypes. The present data therefore cannot fully distinguish fibrosis-specific effects from general cytostatic or cytotoxic effects.
Collectively, these results support the potential application of the keloid SoC model for preliminary therapeutic evaluation and characterization of treatment-associated molecular responses.
Study limitations
Although the keloid SoC model constructed in this study exhibits the characteristics of a full-thickness skin model and fibrosis-related pathological phenotypes, it still lacks immune microenvironment components involved in the progression of keloid disease, such as specific immune cells (e.g., T cells[42]) and skin-resident immune cells such as macrophages[43], which play critical roles in wound healing. The absence of immune–stromal crosstalk means that the model cannot recapitulate immune-driven fibrotic feedback or vascular-related drug delivery effects observed in patients. Consequently, the detected drug effects mainly reflect direct actions on dermal fibroblasts and keratinocytes and do not fully replicate in vivo therapeutic outcomes. We propose that incorporating immune and vascular cell types will be a key direction for future model optimization.
Functional barrier integrity was not directly quantified in the present model because the current device configuration does not permit reliable TEER or FITC-dextran permeability measurements. Meanwhile, the ELISA results reflect technical reproducibility rather than biological reproducibility; future studies should validate these findings using multiple independent models from different donors or batches. In addition, the current microfluidic system employed in this study is relatively simple and does not enable precise control of flow rate and direction. In future work, the influence of multicellular co-culture under defined fluidic conditions on disease model construction will be further investigated.
We also recognize that cell-mediated matrix remodeling may alter the in situ hydrogel modulus during long-term culture. Future studies should therefore incorporate stress-relaxation, creep, degradation, and endpoint mechanical measurements to better characterize the evolving mechanical properties of cell-laden hydrogels.
The human keloid transcriptomic data used in this study were obtained from the publicly available GEO dataset, whereas the engineered-model RNA-seq data were generated from engineered skin models established using clinical sample-derived cells in this study. Because these two datasets differ in experimental origin and, importantly, in sample composition (human tissue vs. engineered skin models), a direct cross-dataset comparison would be strongly influenced by dataset-specific effects and tissue heterogeneity and may therefore not provide a biologically intuitive comparison.
In addition, the engineered models were generated using cells from one donor per condition. Although three independently prepared model samples were analyzed, donor-to-donor variability, including potential differences associated with anatomical site and disease duration, could not be evaluated and should be further addressed using cells from multiple donors. Furthermore, while this disease system was preliminarily explored for its potential in keloid research and therapeutic evaluation, it has not yet been directly compared or validated against clinical outcomes, which will be a key focus in future translational applications.
CONCLUSION
In this study, organ-on-chip technology was applied to construct a dynamic keloid-like fibrotic SoC model integrating full-thickness skin architecture, pathological matrix stiffness, and TGF-β1-mediated fibrotic induction. This model enables multidimensional characterization of keloid-associated fibrotic features, including abnormal collagen deposition, fibroblast activation, and fibrosis-related molecular changes. By integrating these features within a controlled mechanical and biochemical microenvironment, the model offers a physiologically relevant platform for investigating keloid-associated fibrotic remodeling and preliminary antifibrotic drug responses.
Conventional 2D cell cultures fail to capture tissue-level pathological phenotypes due to the absence of microenvironmental interactions; simple 3D structures cannot reproduce the cross-regulation between mechanical and biochemical signals; and animal models are limited by species-specific differences in skin structure and healing mechanisms, reducing translational relevance. The keloid SoC model developed here partially addresses these limitations through the integration of multiple critical factors. Although the model does not fully recapitulate the complexity of human keloid pathology, particularly regarding immune cell involvement and long-term disease progression, it provides a controlled system for studying fibrosis-associated responses and evaluating potential antifibrotic treatments.
In summary, the keloid SoC model established in this study provides a platform for investigating keloid-associated fibrotic remodeling and preliminary antifibrotic drug responses.
DECLARATIONS
Acknowledgment
The graphical abstract was created with BioRender.com.
Authors’ contributions
Contributed to methodology design and experimental validation: Si, N.
Performed experiments: Yao, Y.
Contributed to conceptualization and methodology: Zhang, J. (Jing Zhang); Chen, Z.
Organized figures, designed experiments, and curated data: Li, X.
Contributed to material design and characterization: Zhang, S.; Gao, Y.
Analyzed sequencing data: Liu, X.
Performed experiments: Yuan, Y.; Yang K.
Provided image materials: Zha, S.
Contributed to the preparation and revision of the manuscript: Zhang, J. (Juan Zhang); Song, B.; Ouyang, J.; Zhou, T.; Si, N.; Yao, Y.; Zhang, J. (Jing Zhang); Li, X.; Zhang, S.; Gao, Y.; Liu, X.
Assisted with manuscript revision: Li, Q.
Provided resources and supervision: Gu, Z.
Contributed to conceptualization, funding acquisition, and supervision: Yin, N.
Availability of data and materials
The original transcriptomic data generated in this study have been deposited in the Genome Sequence Archive for Human (GSA-Human) under accession number HRA021614 (BioProject accession: PRJCA073929) for keloid SoC model data. The dataset is publicly accessible at the following link: https://ngdc.cncb.ac.cn/gsa-human/browse/HRA021614. The transcriptomic data of normal and keloid tissues used for comparison were derived from the following public domain resource: GEO database, accession number GSE237752 (https://www.ncbi.nlm.nih.gov/geo/query/acc.cgi?acc=GSE237752).
AI and AI-assisted tools statement
During the preparation of this manuscript, the AI tool ChatGPT (version GPT-5.6, released 2026-07-09) was used solely for language editing. The tool did not influence the study design, data collection, analysis, interpretation, or the scientific content of the work. All authors take full responsibility for the accuracy, integrity, and final content of the manuscript.
Financial support and sponsorship
This work was supported by the CAMS Innovation Fund for Medical Sciences (No. 2021-I2M-1-052), the CAMS Plastic Surgery Hospital Institutional Fund (No. YSZ2024CG002), the Open Research Fund of the State Key Laboratory of Digital Medical Engineering, Southeast University (No. 2025-M04), the Science and Technology Project of Jiangsu Province (Nos. BK20232023 and BK20222008), and the National Key R&D Program of China (No. 2022YFF0711102).
Conflicts of interest
Gu, Z. is a Guest Editor of the Special Topic “Flexible and Programmable Reconstruction of Organoids and Organoid-on-Chips” in Soft Science. Gu, Z. was not involved in any stage of the editorial process for this manuscript, including reviewer selection, manuscript handling, or decision-making. Zhang, J. (Jing Zhang), Li, X., Liu, X., Ouyang, J., Yang, K., Zha, S., Zhou, T. and Chen, Z. are affiliated with Jiangsu Avatarget Biotechnology Co., Ltd. The other authors declare that they have no conflicts of interest.
Ethical approval and consent to participate
Human skin tissue collection and primary cell isolation were approved by the Institutional Review Board of Plastic Surgery Hospital, Chinese Academy of Medical Sciences and Peking Union Medical College under Approval No. 120 (2023). The subsequent keloid organ-on-a-chip study was approved under Approval No. 183 (2025). All procedures were conducted in accordance with the Declaration of Helsinki. Written informed consent was obtained from all participants prior to surgical specimen collection.
Consent for publication
Not applicable.
Copyright
© The Author(s) 2026.
Supplementary Materials
REFERENCES
1. Deng, C.; Hu, Y.; Zhu, D.; et al. Single-cell RNA-seq reveals fibroblast heterogeneity and increased mesenchymal fibroblasts in human fibrotic skin diseases. Nat. Commun. 2021, 12, 24110.
2. Zhao, Y.; Wei, Q.; Zeng, R.; Wang, Y.; Yang, Y.; Wang, Y. Natural killer cell dysfunction drives keloid pathogenesis. Cell. Rep. 2026, 45, 117129.
3. Nagar, H.; Kim, S.; Lee, I.; et al. Downregulation of CR6-interacting factor 1 suppresses keloid fibroblast growth via the TGF-β/Smad signaling pathway. Sci. Rep. 2021, 11, 79785.
4. Chao, H.; Zheng, L.; Hsu, P.; et al. IL-13RA2 downregulation in fibroblasts promotes keloid fibrosis via JAK/STAT6 activation. JCI. Insight. 2023, 8, e157091.
5. Sun, Y.; Chen, Z.; Zhang, M.; et al. FOSL1-mediated super-enhancer facilitates pathological scarring. Cell. Rep. 2026, 45, 117667.
6. Cheng, X.; Gao, Z.; Shan, S.; et al. Single cell transcriptomics reveals the cellular heterogeneity of keloids and the mechanism of their aggressiveness. Commun. Biol. 2024, 7, 7311.
7. Zhang, Y.; Bao, Y.; Li, Z.; Jin, Z. A novel nude mice model for studying the pathogenesis of keloid. J. Cosmet. Dermatol. 2025, 24, e70284.
8. Ancuța, D.; Văduva, M.; Coman, C.; Caraș, I. Recent advances in animal models for pathological scar research: a comprehensive review of experimental approaches and translational relevance. Animal. Model. Exp. Med. 2026, 9, 59-71.
9. Abergel, R. P.; Pizzurro, D.; Meeker, C. A.; et al. Biochemical composition of the connective tissue in keloids and analysis of collagen metabolism in keloid fibroblast cultures. J. Invest. Dermatol. 1985, 84, 384-90.
10. Lim, I. J.; Phan, T.; Song, C.; Tan, W. T. L.; Longaker, M. T. Investigation of the influence of keloid-derived keratinocytes on fibroblast growth and proliferation in vitro. Plast. Reconstr. Surg. 2001, 107, 797-808.
11. Limandjaja, G. C.; van den Broek, L. J.; Breetveld, M.; et al. Characterization of in vitro reconstructed human normotrophic, hypertrophic, and keloid scar models. Tissue. Eng. Part. C. Methods. 2018, 24, 242-53.
12. Ahn, M.; Cho, W.; Park, W.; et al. 3D biofabrication of diseased human skin models in vitro. Biomater. Res. 2023, 27, 80.
13. Choi, Y.; Jang, H.; Shim, J.; et al. 3D keloid spheroid model: development and application for personalized drug response prediction. Commun. Biol. 2024, 7, 7194.
14. Dirand, Z.; Tissot, M.; Chatelain, B.; Viennet, C.; Rolin, G. Is spheroid a relevant model to address fibrogenesis in keloid research? Biomedicines 2023, 11, 2350.
15. Ingber, D. E. Human organs-on-chips for disease modelling, drug development and personalized medicine. Nat. Rev. Genet. 2022, 23, 467-91.
16. Leung, C. M.; de Haan, P.; Ronaldson-Bouchard, K.; et al. A guide to the organ-on-a-chip. Nat. Rev. Methods. Primers. 2022, 2, 33.
17. Sutterby, E.; Thurgood, P.; Baratchi, S.; Khoshmanesh, K.; Pirogova, E. Microfluidic skin‐on‐a‐chip models: toward biomimetic artificial skin. Small 2020, 16, 2002515.
18. Lee, T.; Kyung, S. Y.; Kwon, M.; Park, B.; Ko, J. Innovations in skin microphysiological systems for nonclinical testing and FDA modernization. Microsyst. Nanoeng. 2026, 12, 1149.
19. Kim, K.; Kim, H.; Sung, G. Y. An interleukin-4 and interleukin-13 induced atopic dermatitis human skin equivalent model by a skin-on-a-chip. Int. J. Mol. Sci. 2022, 23, 2116.
20. Sun, S.; Jin, L.; Zheng, Y.; Zhu, J. Modeling human HSV infection via a vascularized immune-competent skin-on-chip platform. Nat. Commun. 2022, 13, 33114.
21. Streutker, E. M.; Devamoglu, U.; Vonk, M. C.; Verdurmen, W. P. R.; Le Gac, S. Fibrosis‐on‐chip: a guide to recapitulate the essential features of fibrotic disease. Adv. Healthc. Mater. 2024, 13, e2303991.
22. Abdo, D.; Zhao, Y.; Okhovatian, S.; et al. A dermis-on-a-chip model for compound screening. Mater. Today. Bio. 2025, 34, 102111.
23. Li, P.; Cui, F.; Chen, H.; et al. A microfluidic cell co-culture chip for the monitoring of interactions between macrophages and fibroblasts. Biosensors 2023, 13, 70.
24. Biglari, S.; Le, T. Y. L.; Tan, R. P.; et al. Simulating inflammation in a wound microenvironment using a dermal wound‐on‐a‐chip model. Adv. Healthc. Mater. 2019, 8, e1801307.
25. Matei, A. E.; Chen, C. W.; Kiesewetter, L.; et al. Vascularised human skin equivalents as a novel in vitro model of skin fibrosis and platform for testing of antifibrotic drugs. Ann. Rheum. Dis. 2019, 78, 1686-92.
26. Rimal, R.; Marquardt, Y.; Nevolianis, T.; et al. Dynamic flow enables long‐term maintenance of 3‐D vascularized human skin models. Appl. Mater. Today. 2021, 25, 101213.
27. Pappalardo, A.; Ornek, D.; Cerda, L. G.; et al. A mechanomimetic model of skin fibrosis. Lab. Chip. 2026, 26, 665-80.
28. Yue, K.; Trujillo-de Santiago, G.; Alvarez, M. M.; Tamayol, A.; Annabi, N.; Khademhosseini, A. Synthesis, properties, and biomedical applications of gelatin methacryloyl (GelMA) hydrogels. Biomaterials 2015, 73, 254-71.
29. Zhang, J.; Chen, Z.; Zhang, Y.; et al. Construction of a high fidelity epidermis-on-a-chip for scalable in vitro irritation evaluation. Lab. Chip. 2021, 21, 3804-18.
30. Rittié, L.; Fisher, G. J. Isolation and culture of skin fibroblasts. Methods. Mol. Med. 2005, 117, 83-98.
31. Brietzke, A.; Guthoff, R. F.; Grabow, N.; Stahnke, T. Nintedanib suppresses expression of extracellular matrix proteins in TGF-β1-stimulated primary human fibroblasts of the Tenon. Curr. Dir. Biomed. Eng. 2021, 7, 367-70.
32. Nobari, S.; Najafi, R.; Mahdavinezhad, A.; jalali, A.; Amini, R.; Emran, T. B. The combination of zerumbone with 5-fluorouracil for sensitizing colorectal cancer-associated fibroblasts to treatment. Evid. Based. Complement. Alternat. Med. 2022, 2022, 1-13.
33. Feng, F.; Liu, M.; Pan, L.; et al. Biomechanical regulatory factors and therapeutic targets in keloid fibrosis. Front. Pharmacol. 2022, 13, 906212.
34. Stone, R. C.; Pastar, I.; Ojeh, N.; et al. Epithelial-mesenchymal transition in tissue repair and fibrosis. Cell. Tissue. Res. 2016, 365, 495-506.
35. Lee, Y. I.; Shim, J. E.; Kim, J.; et al. WNT5A drives interleukin-6-dependent epithelial–mesenchymal transition via the JAK/STAT pathway in keloid pathogenesis. Burns. Trauma. 2022, 10, tkac023.
36. Ma, X.; Chen, J.; Xu, B.; et al. Keloid-derived keratinocytes acquire a fibroblast-like appearance and an enhanced invasive capacity in a hypoxic microenvironment in vitro. Int. J. Mol. Med. 2015, 35, 1246-56.
37. Shi, Y.; Wang, S.; Yang, R.; et al. ROS promote hypoxia‐induced keratinocyte epithelial‐mesenchymal transition by inducing SOX2 expression and subsequent activation of Wnt/β‐catenin. Oxid. Med. Cell. Longev. 2022, 2022, 1084006.
38. Kim, H. J.; Kim, Y. H. Comprehensive insights into keloid pathogenesis and advanced therapeutic strategies. Int. J. Mol. Sci. 2024, 25, 8776.
39. Zhang, T.; Wang, X. F.; Wang, Z. C.; et al. Current potential therapeutic strategies targeting the TGF-β/Smad signaling pathway to attenuate keloid and hypertrophic scar formation. Biomed. Pharmacother. 2020, 129, 110287.
40. Zhou, B.; Wang, W.; Wu, X.; et al. Nintedanib inhibits keloid fibroblast functions by blocking the phosphorylation of multiple kinases and enhancing receptor internalization. Acta. Pharmacol. Sin. 2020, 41, 1234-45.
41. Mohamad, N. E.; Abd El Raheem, T. A.; Mahmoud, R. H.; Hamed, N. O. Evaluating serum level of thymidylate synthase in post burn keloid patients before and after intralesional injection of 5-fluorouracil. Scars. Burns. Heal. 2022, 8.
42. Wang, X.; Liang, B.; Li, J.; et al. Identification and characterization of four immune-related signatures in keloid. Front. Immunol. 2022, 13, 942446.
Cite This Article
 Open Access
How to Cite
Si, N.; Yao, Y.; Zhang, J.; Li, X.; Zhang, S.; Gao, Y.; Liu, X.; Ouyang, J.; Yang, K.; Zhang, J.; Song, B.; Zha, S.; Yuan, Y.; Zhou, T.; Li, Q.; Chen, Z.; Gu, Z.; Yin, N. Engineering a keloid-like fibrotic skin-on-a-chip for drug evaluation. Soft Sci. 2026, 6, 103. https://dx.doi.org/10.20517/ss.2026.155
Download Citation
If you have the appropriate software installed, you can download article citation data to the citation manager of your choice. Simply select your manager software from the list below and click on download.
Export Citation File
Type of Import
Tips on Downloading Citation
Citation Manager File Format
Type of Import
Direct Import: When the Direct Import option is selected (the default state), a dialogue box will give you the option to Save or Open the downloaded citation data. Choosing Open will either launch your citation manager or give you a choice of applications with which to use the metadata. The Save option saves the file locally for later use.
Indirect Import: When the Indirect Import option is selected, the metadata is displayed and may be copied and pasted as needed.
About This Article
Special Topic
Copyright

Data & Comments
Data
0












Comments
Comments must be written in English. Spam, offensive content, impersonation, and private information will not be permitted. If any comment is reported and identified as inappropriate content by OAE staff, the comment will be removed without notice. If you have any queries or need any help, please contact us at [email protected].