
fig2
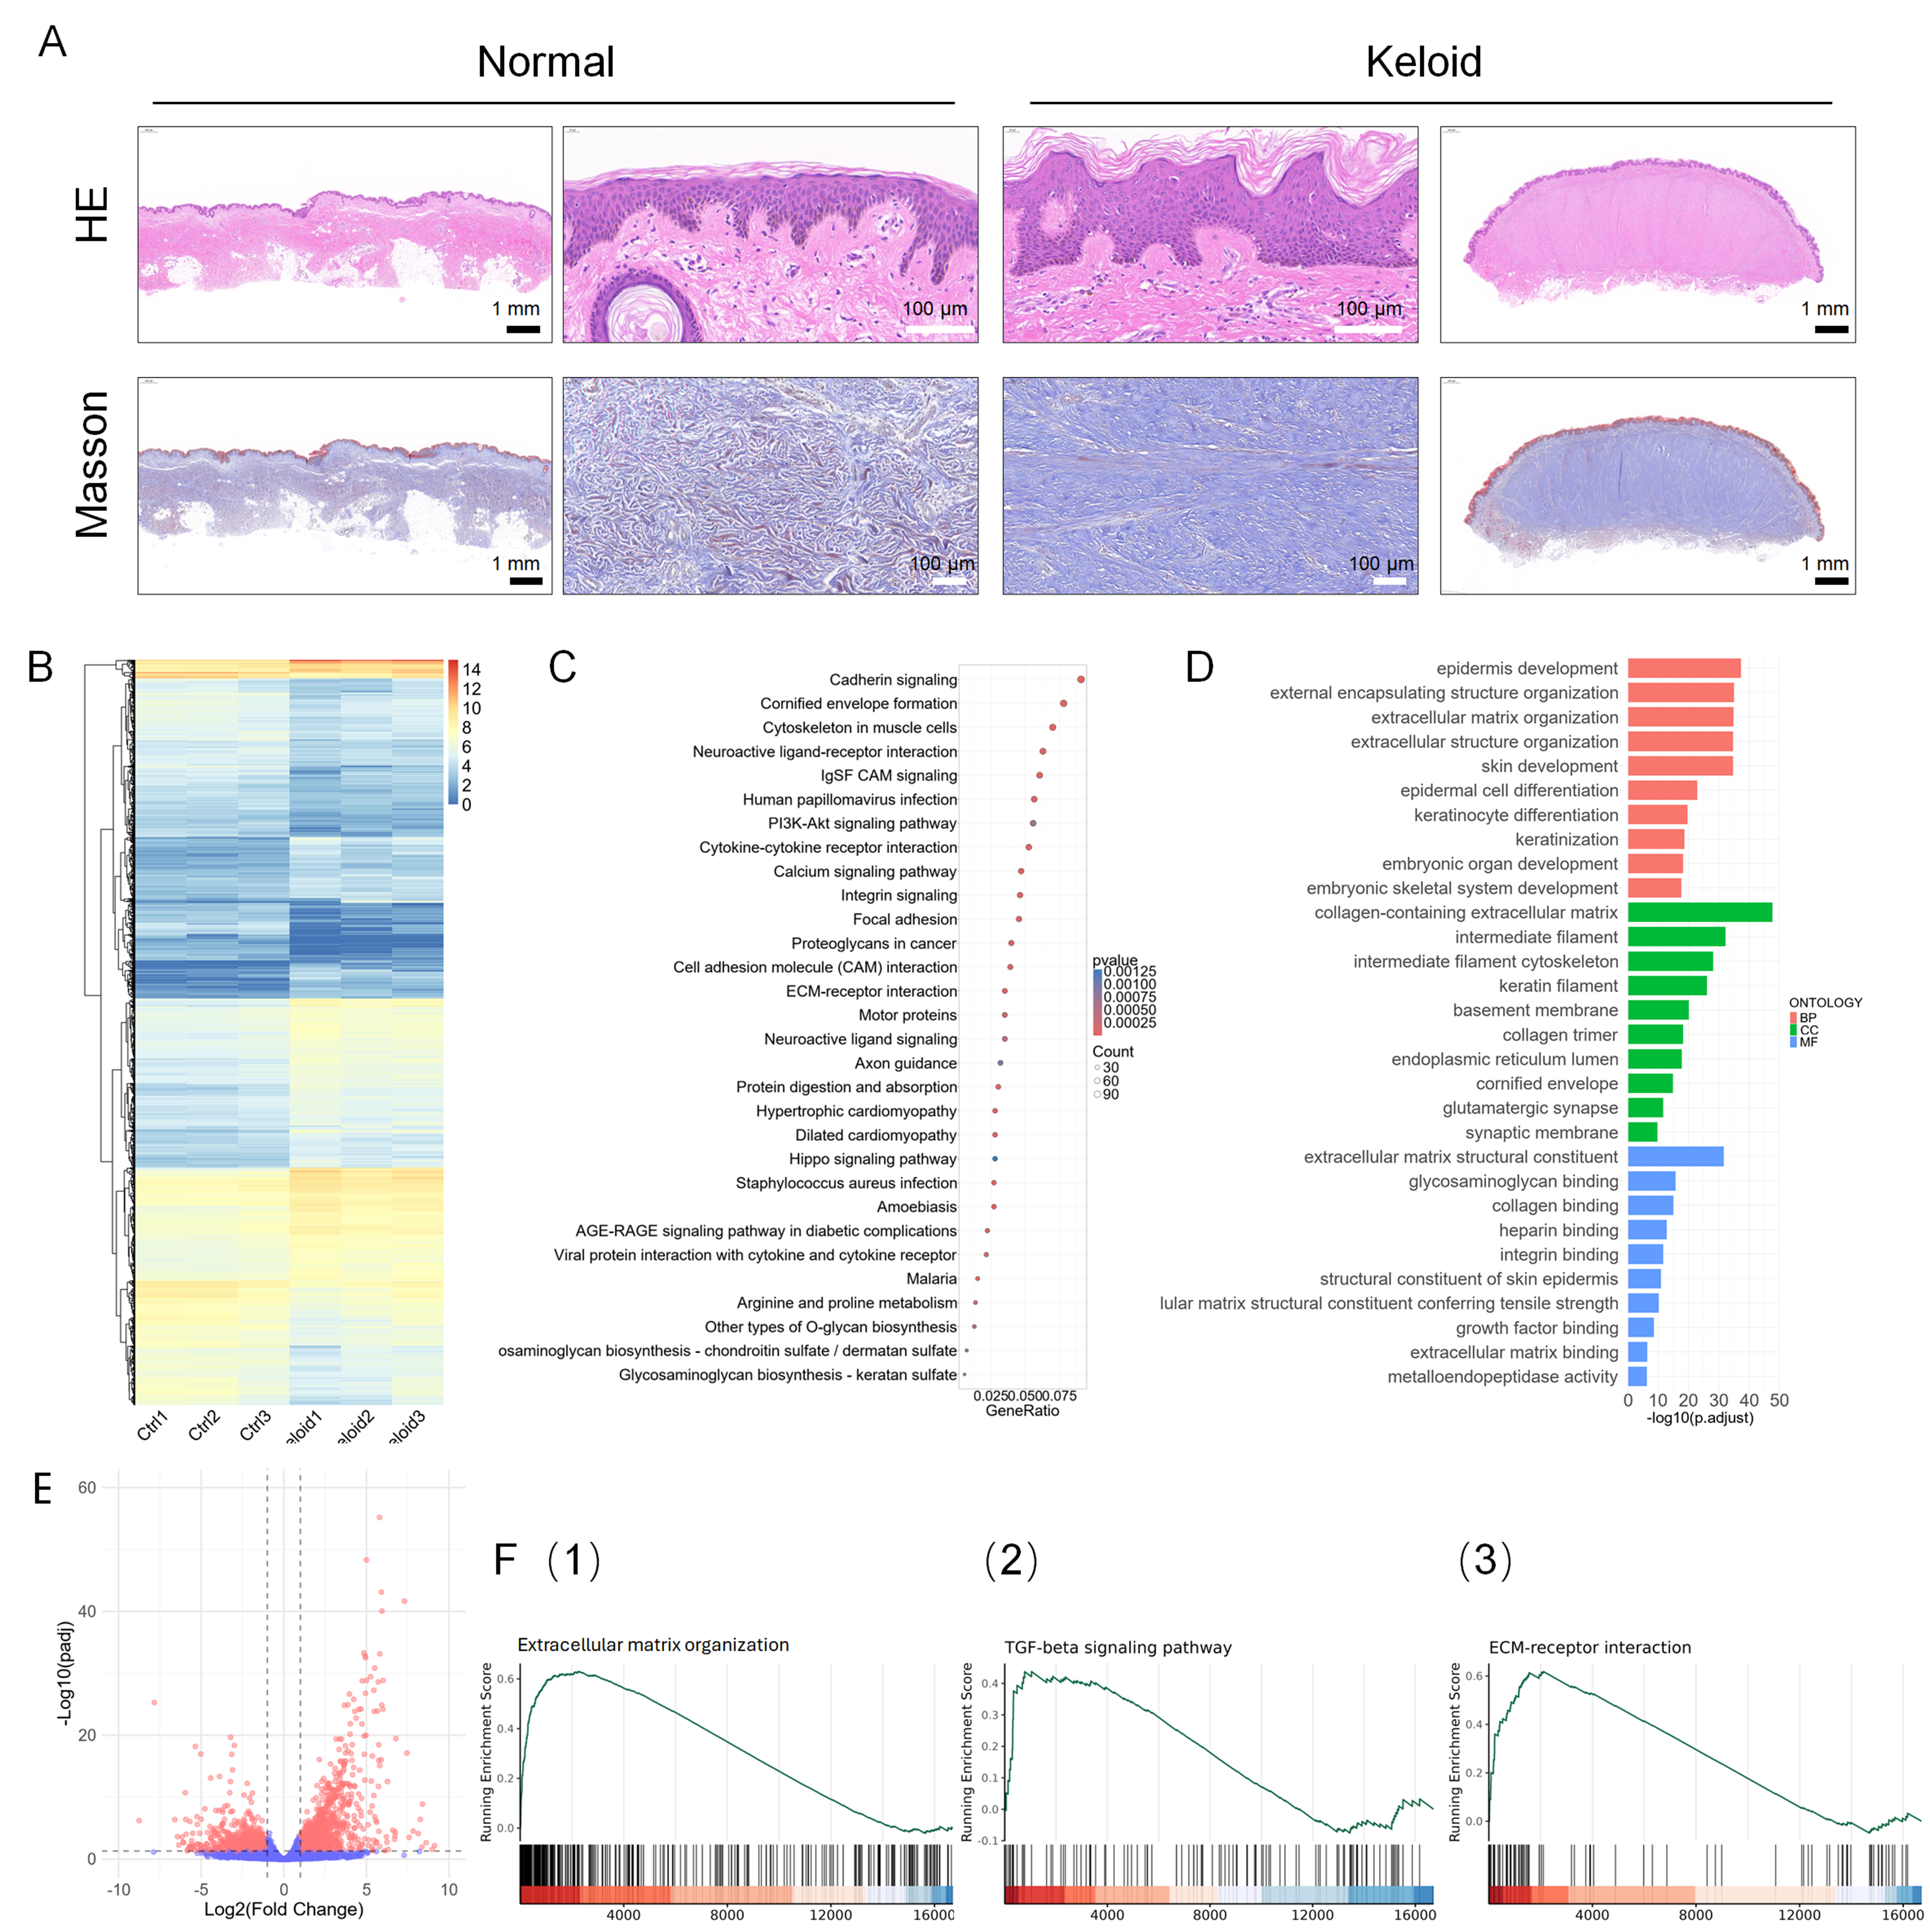
Figure 2. Morphological and gene expression comparison between primary normal and keloid skin tissues. (A) H&E and Masson staining of primary skin tissues. Outer panels: whole-tissue view at 2× magnification; center panels: localized region at 40× magnification. Scale bar: 1 mm (black), 100 μm (white); (B-F) presents the RNA-seq analysis results from the GSE237752 dataset, comparing gene expression profiles between keloid and normal skin samples. (B) A heatmap of DEGs, with red indicating high expression and blue indicating low expression; (C) A bubble plot of KEGG pathway enrichment analysis for DEGs, where dot color represents the P-value and dot size indicates the number of enriched genes; (D) GO enrichment analysis of DEGs, encompassing BPs, CCs, and MFs; (E) A volcano plot of DEGs, with downregulated genes on the left and upregulated genes on the right; (F) GSEA showing enrichment of (1) the GO term “ECM organization”, (2) the KEGG pathway “ECM‑receptor interaction”, and (3) the KEGG pathway “TGF‑β signaling pathway”. Analyses are based on independent biological replicates (n = 3 per group). H&E: Hematoxylin and eosin; DEGs: differentially expressed genes; KEGG: Kyoto Encyclopedia of Genes and Genomes; GO: Gene Ontology; BPs: biological processes; CCs: cellular components; MFs: molecular functions; GSEA: Gene Set Enrichment Analysis; ECM: excessive extracellular matrix; TGF‑β: transforming growth factor-beta.