
fig4
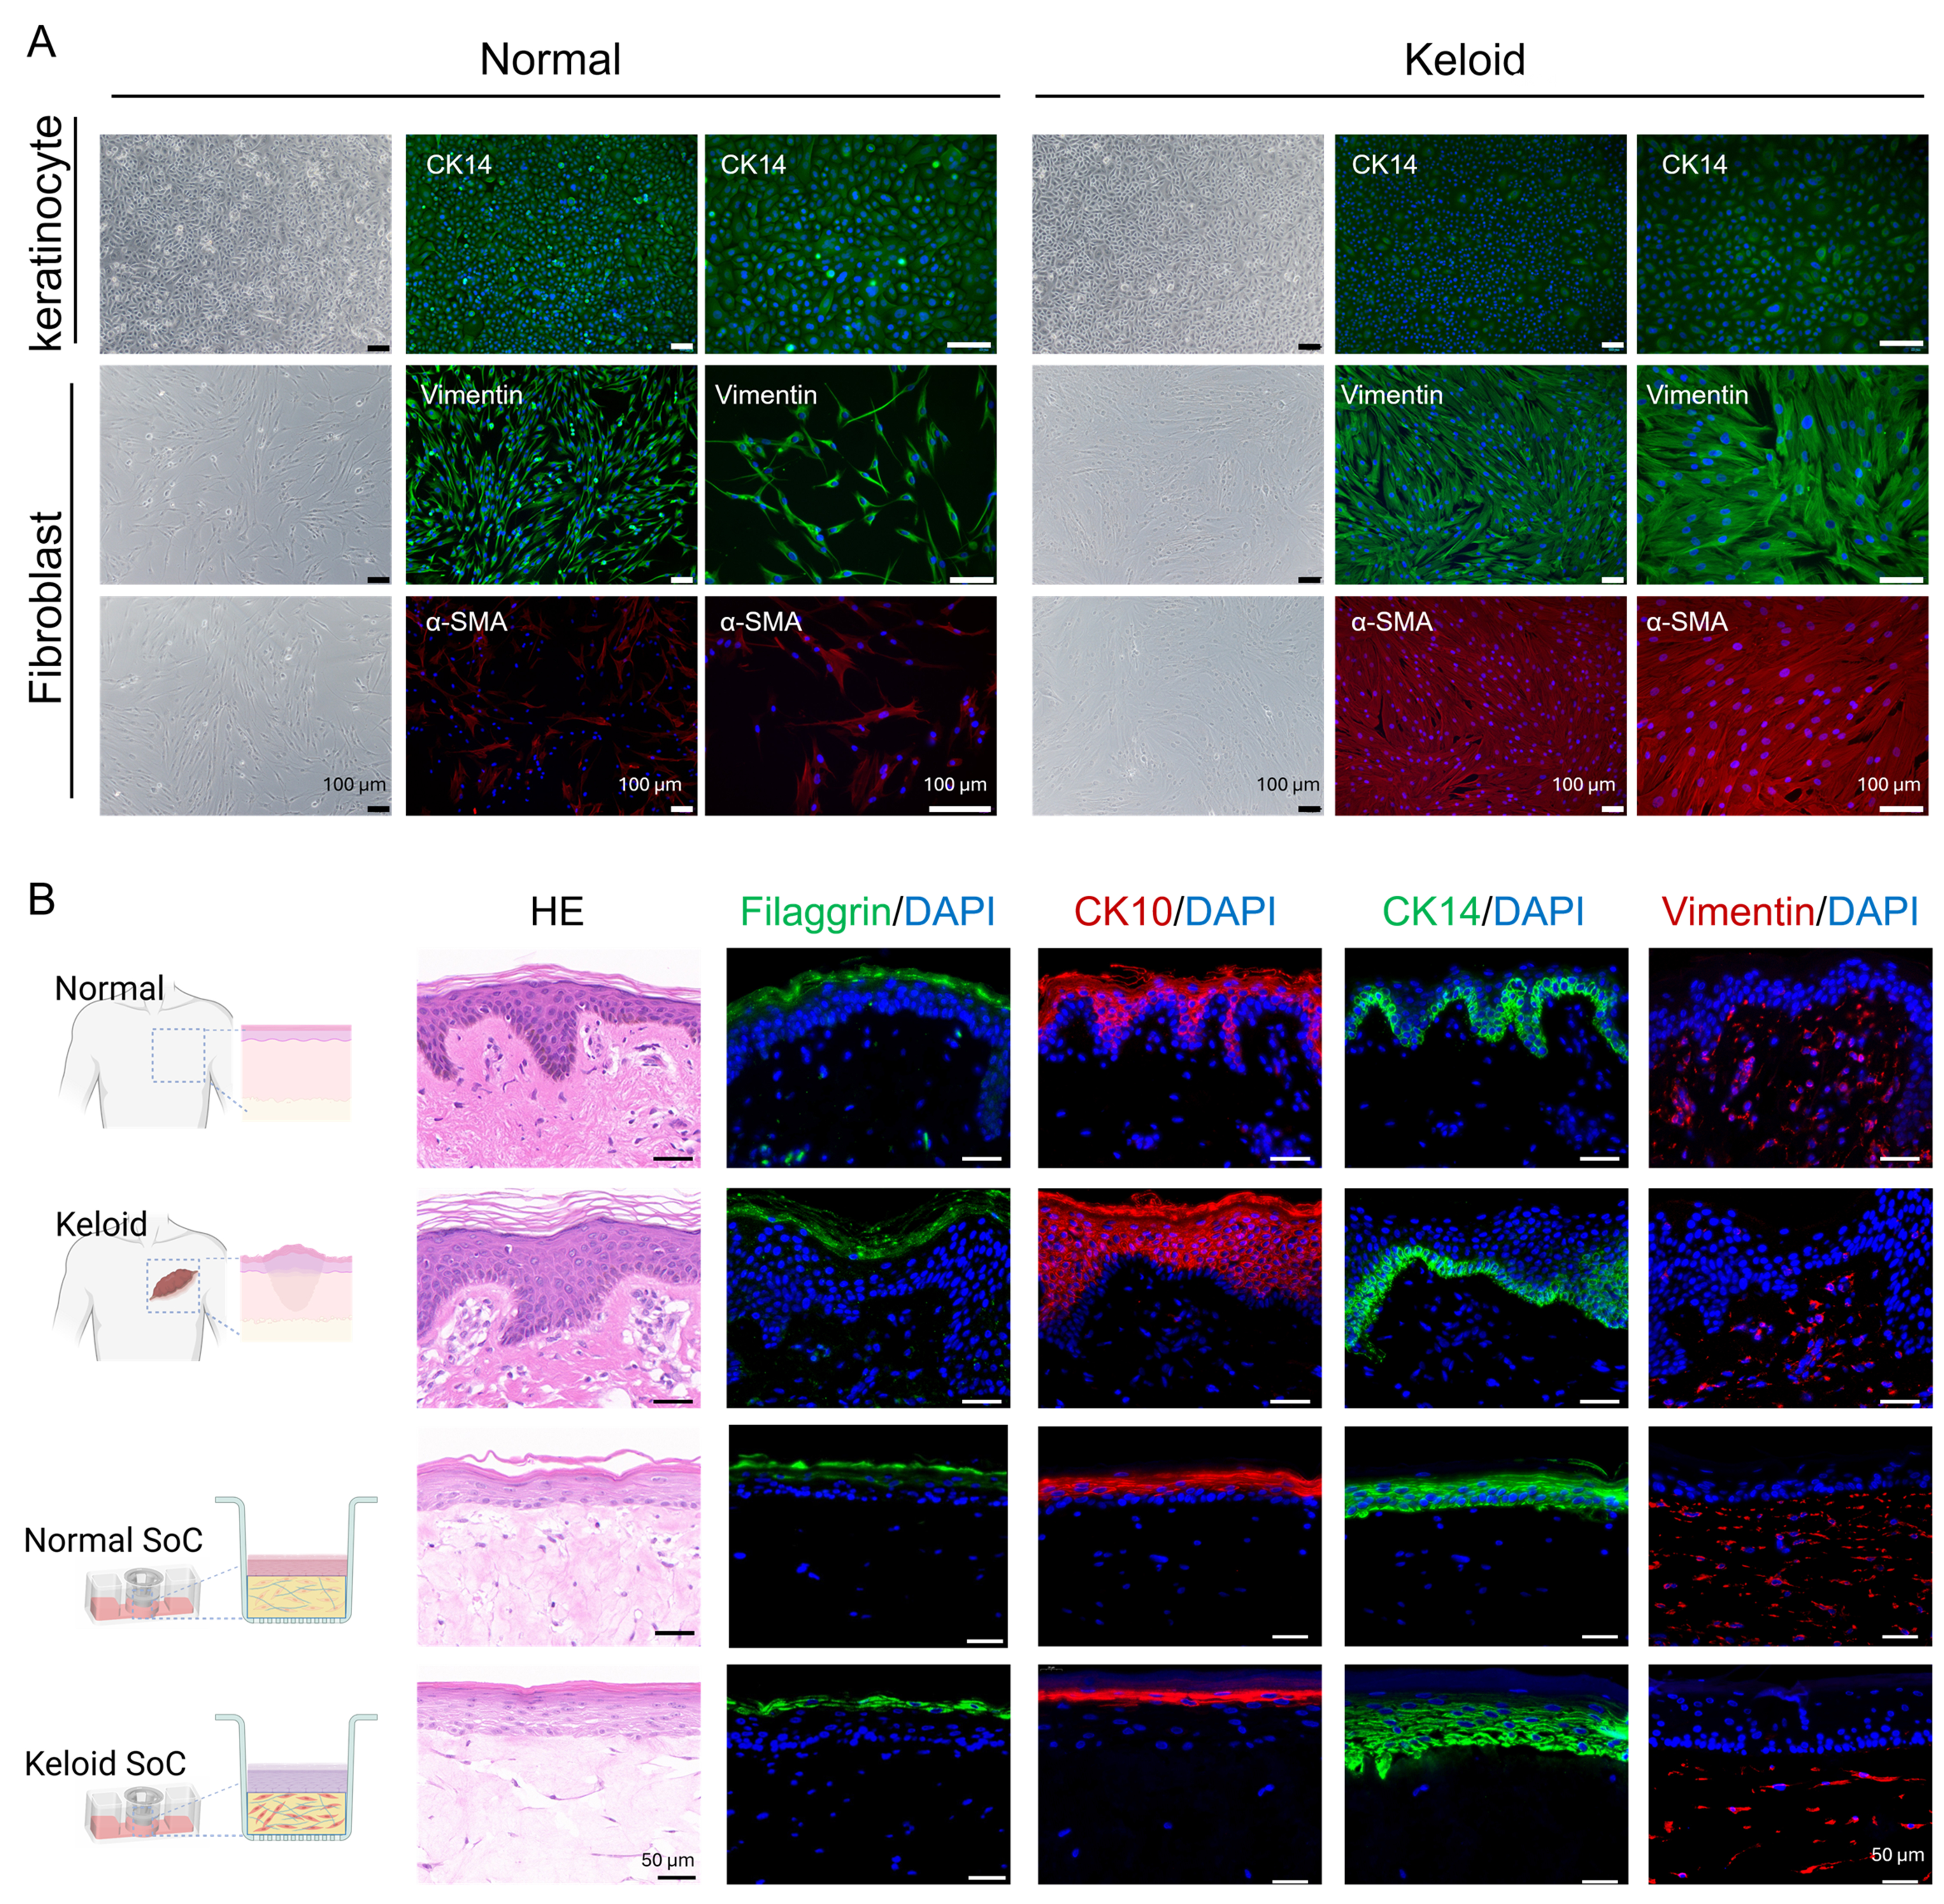
Figure 4. Characterization of primary cells and comparison between native tissues and SoC models. (A) Each row contains three images: the leftmost is the bright-field image, the middle is a fluorescence image captured at 10× magnification, and the rightmost is a fluorescence image captured at 20× magnification. The first row shows bright-field images and CK14 IF staining of keratinocytes from normal control donor and keloid patients. The second row shows bright-field images and Vimentin IF staining of fibroblasts from normal control donor and keloid patients. The third row shows bright-field images and α-SMA IF staining of fibroblasts from normal control donor and keloid patients. DAPI (blue), CK14 and Vimentin (green), α-SMA (red). Scale bar: 100 μm; (B) H&E staining and IF staining of filaggrin (green), CK10 (red), CK14 (green), and Vimentin (red) with DAPI (blue) were performed on normal skin, keloid skin, and both normal and keloid SoC models. Scale bar: 50 μm. Created with BioRender.com. Analyses are based on technical replicates (n = 3 per group). SoC: Skin-on-chip; IF: immunofluorescence; α-SMA: α-smooth muscle actin; DAPI: 4′,6-diamidino-2-phenylindole; H&E: hematoxylin and eosin.