
fig5
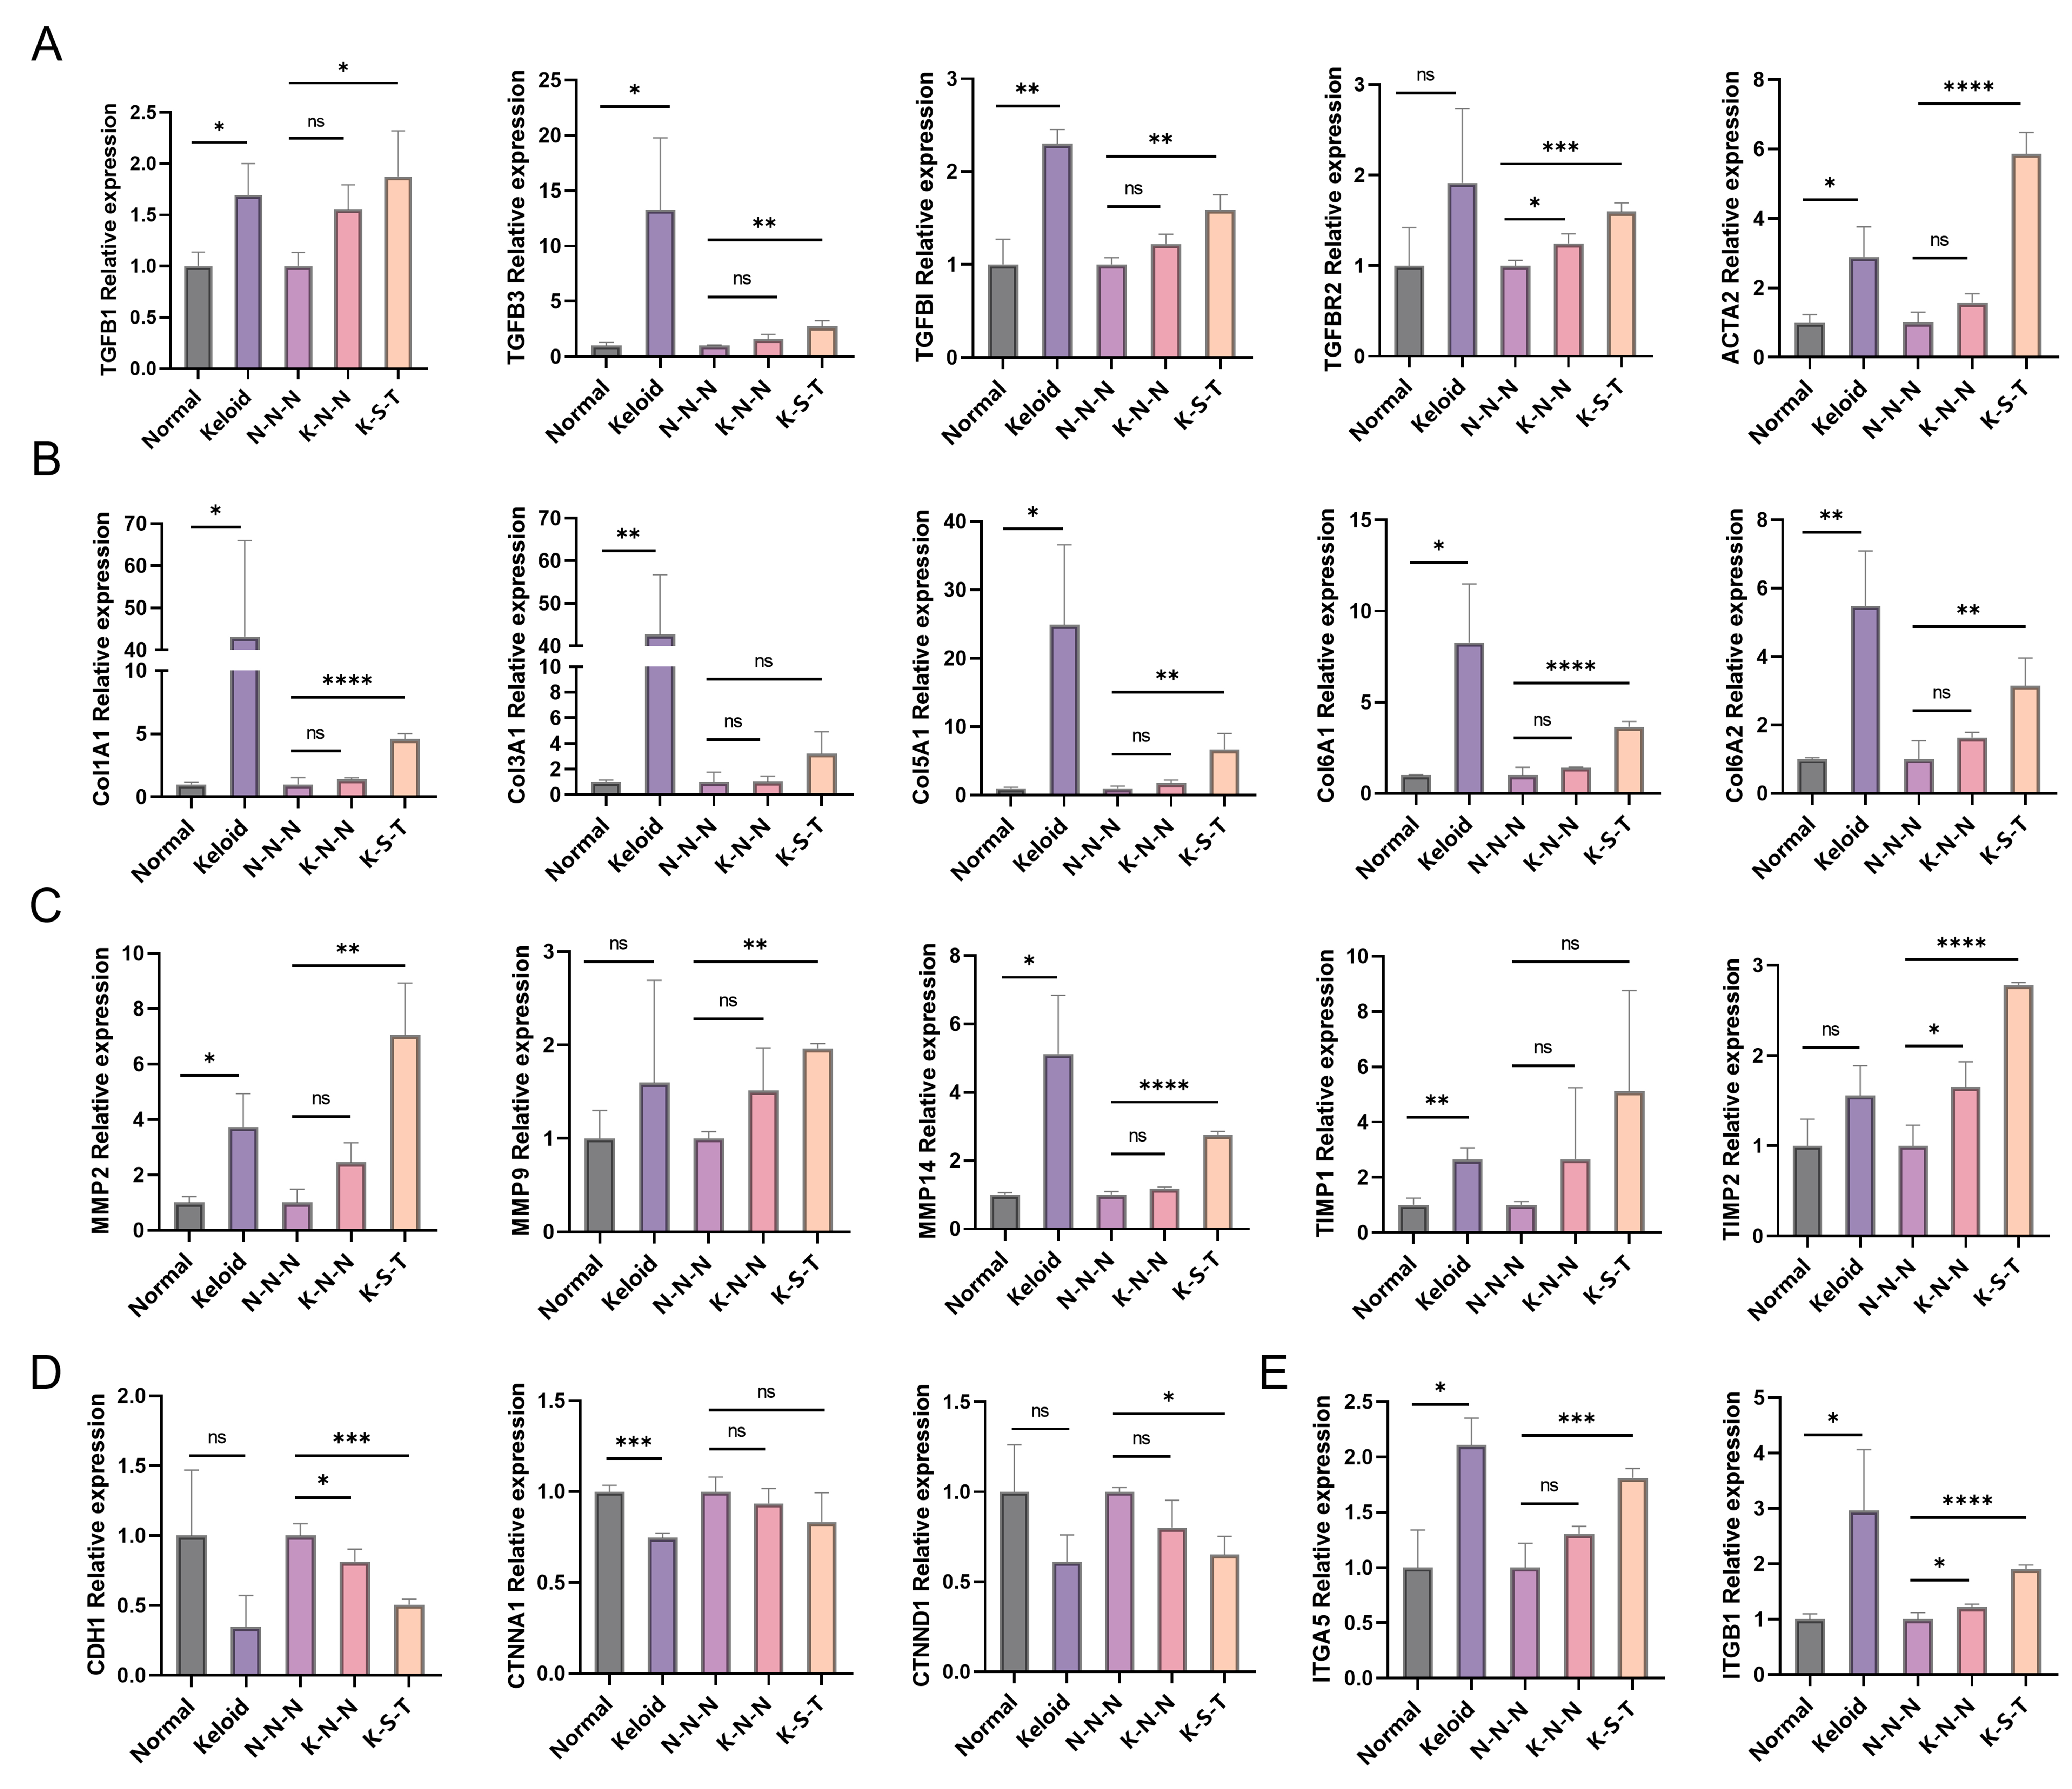
Figure 5. Evaluation of SoC construction strategies based on keloid-associated gene expression patterns. Tissue expression levels were normalized to the Normal group, and keloid/normal ratios were calculated based on TPM values. Model TPM values were normalized to the N-N-N group to calculate K-N-N/N-N-N and K-S-T/N-N-N ratios. Comparisons were performed between Keloid and Normal tissues, and between N-N-N and K-N-N and between N-N-N and K-S-T. (A) TGF-β pathway–related genes: TGFB1, TGFB3, TGFBI, TGFBR2, ACTA2; (B) ECM-related genes: COL1A1, COL3A1, COL5A1, COL6A1, COL6A2; (C) Protein degradation and excessive fibrosis–related genes: MMP2, MMP9, MMP14, TIMP1, TIMP2; (D) EMT–related genes: CDH1, CTNNA1, and CTNND1; (E) Integrin signaling: ITGA5, ITGB1. For tissue samples (Normal and Keloid), biological replicates were obtained from different donors (n = 3). Statistical significance was determined by two-tailed Student’s t-test or Mann–Whitney U test following Shapiro–Wilk normality test. For model data (N-N-N, K-N-N, and K-S-T), independent experiments were performed on separate occasions with the same donor-derived cells (n = 3). One-way ANOVA with Tukey’s post-hoc test was used for multiple pairwise comparisons. Data are presented as mean ± SD. *P < 0.05, **P < 0.01, ***P < 0.001, ****P < 0.0001; ns, not significant. SoC: Skin-on-chip; TPM: transcripts per million; TGF-β: transforming growth factor-beta; ECM: excessive extracellular matrix; EMT: epithelial–mesenchymal transition; ANOVA: analysis of variance; SD: standard deviation.