


A multimodal neuroimaging and hepatic imaging analysis for hepatic-type and neurological-type Wilson’s disease
 0
0 Abstract
Aim: Wilson’s disease (WD) primarily manifests in hepatic and neurological symptoms. This study aims to integrate multimodal neuroimaging and hepatic imaging analysis to provide novel insights into the diagnosis and severity assessment of WD.
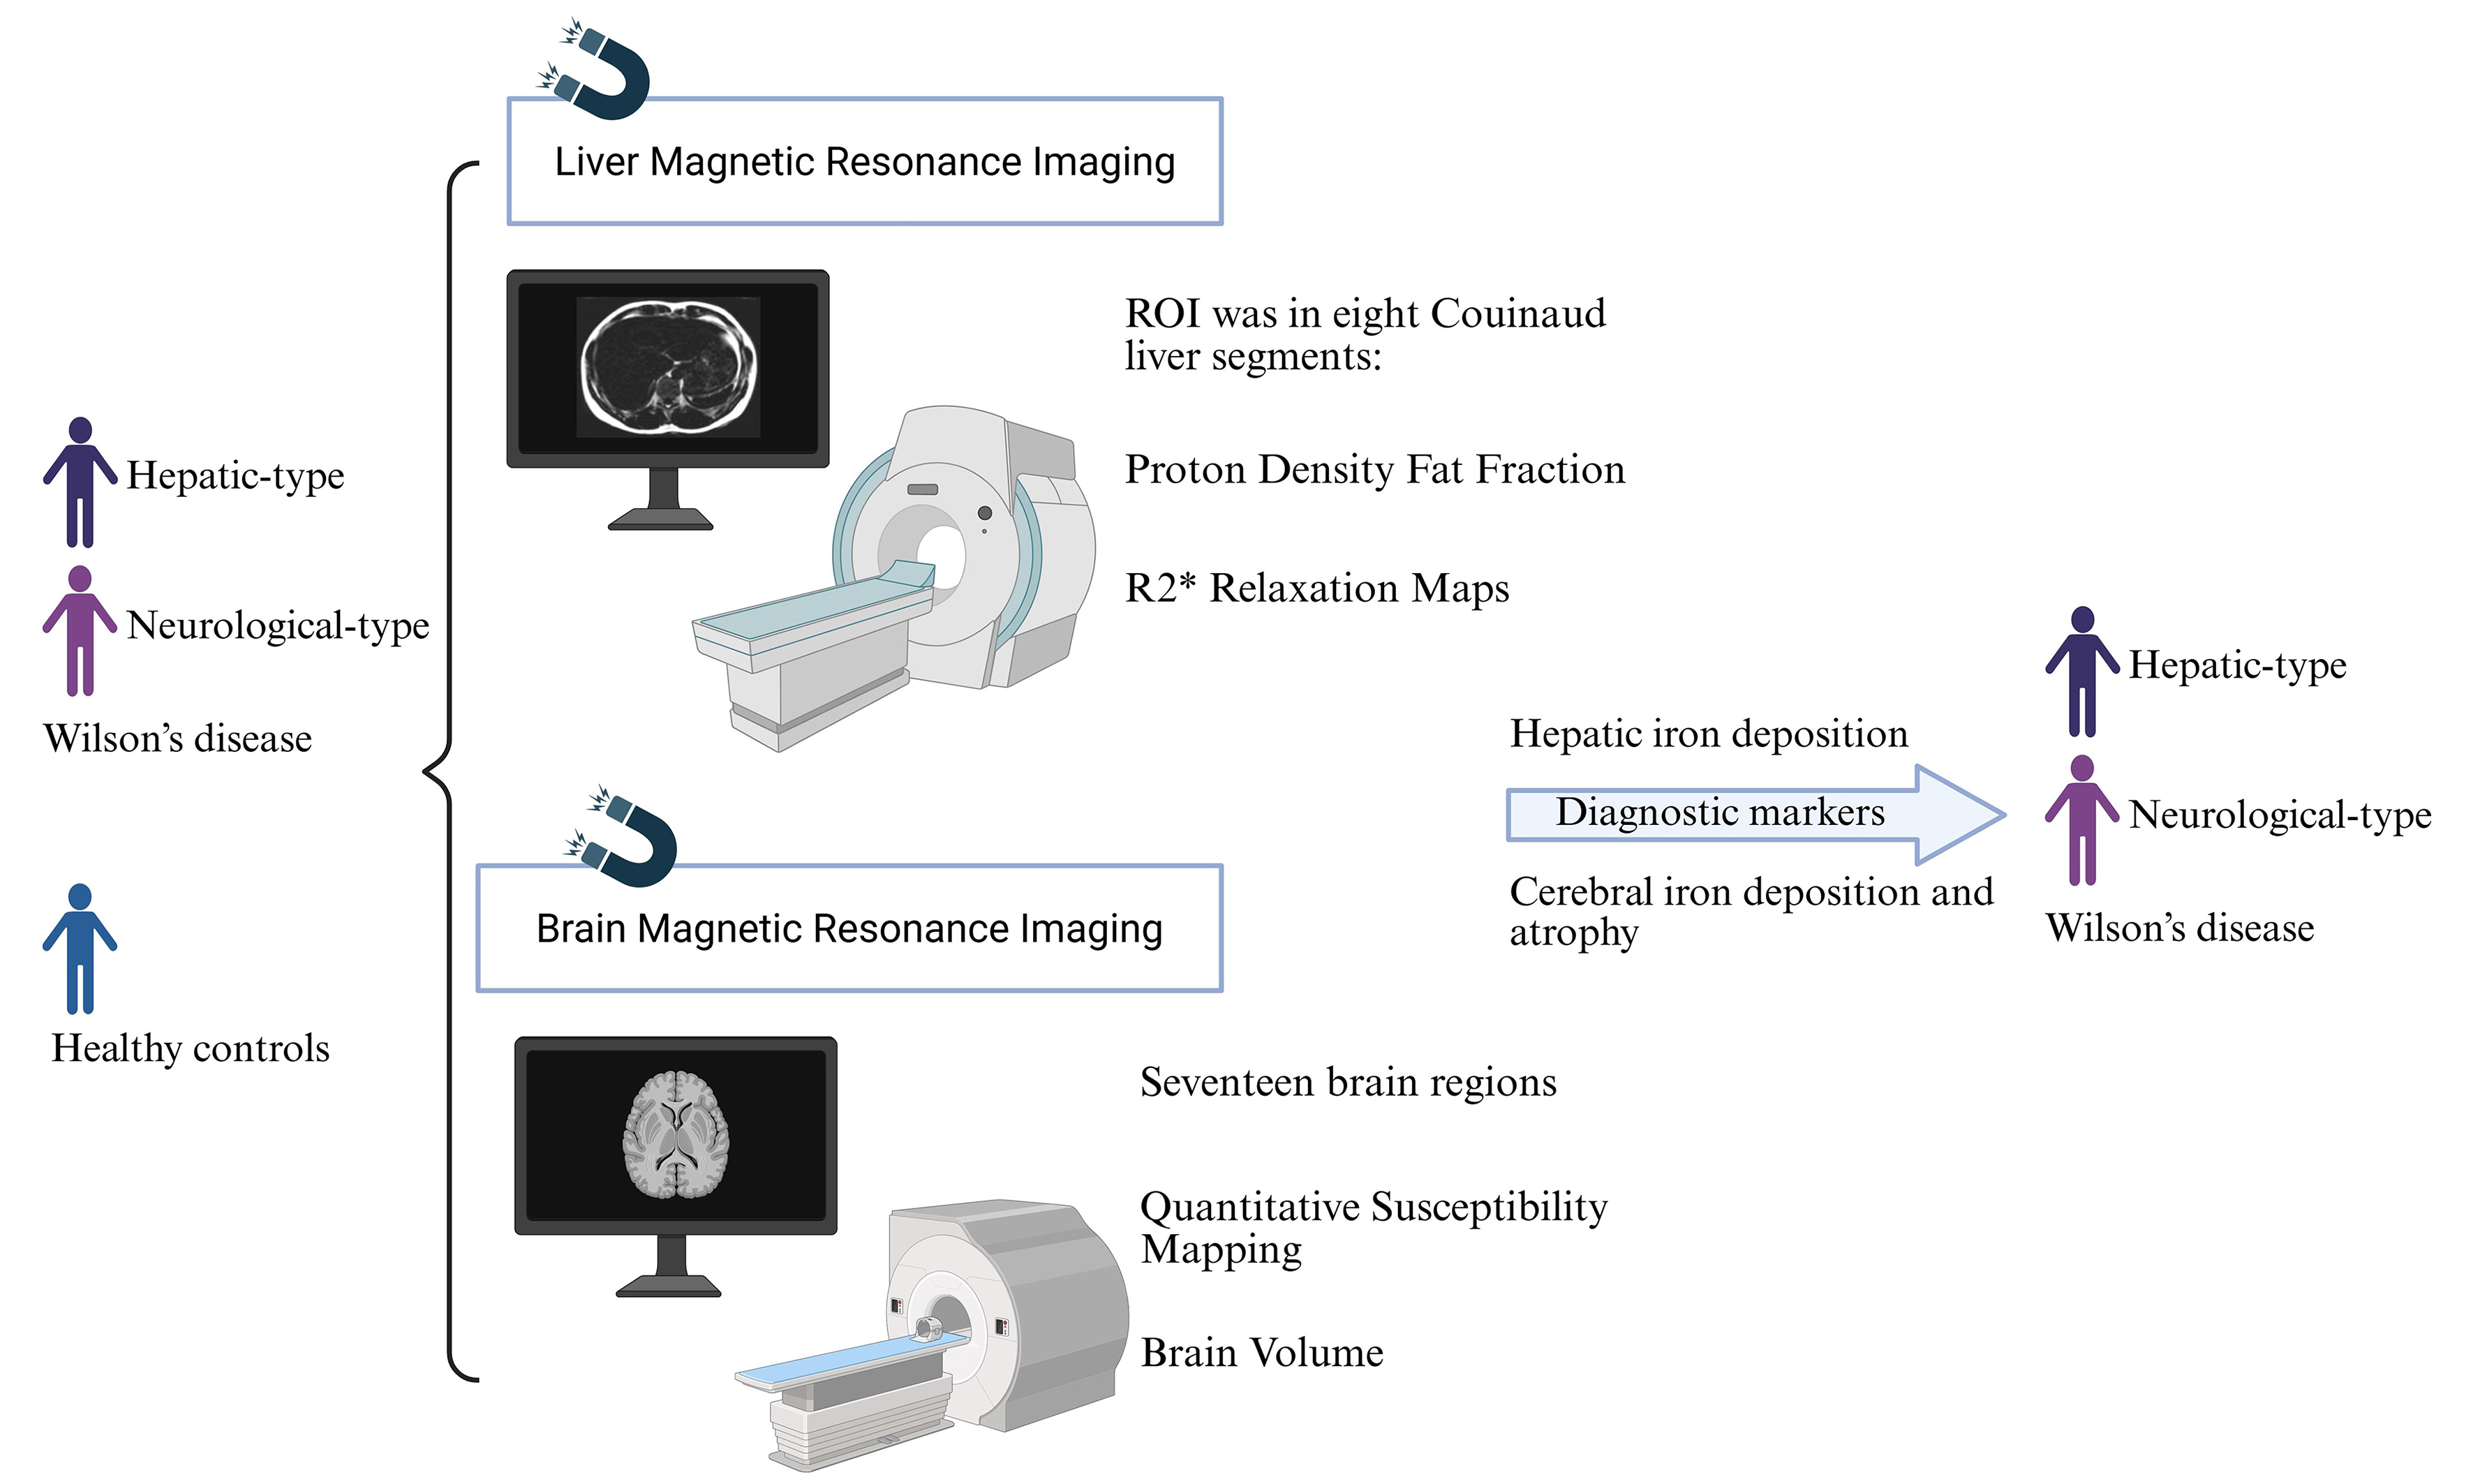
Methods: This study recruited patients diagnosed with hepatic-type WD (HWD), neurological-type WD (NWD), and healthy controls (HCs). All participants underwent both brain and liver magnetic resonance imaging (MRI) scanning. The quantitative susceptibility mapping (QSM) values, volumes of different brain regions, fat content, and iron quantification in liver regions of interest (ROIs) were compared and analyzed across groups. The diagnostic biomarkers were identified by LASSO (Least Absolute Shrinkage and Selection Operator) regression, and their diagnostic value was evaluated using receiver operating characteristic (ROC) analysis. In addition, the correlation between the severity of neurological symptoms and imaging biomarkers was analyzed.
Results: A total of 38 subjects were included in this study, comprising 17 cases of HWD, 10 NWD, and 11 HCs. Compared to HCs, the WD group, especially NWD, exhibited significant iron deposition in liver segments. Additionally, QSM values were significantly increased. The regional brain volumes were significantly reduced. The ROC curve demonstrates that the combination of brain QSM values and volumes selected exhibits strong discriminatory power in distinguishing between WD vs. HCs, NWD vs. HCs, HWD vs. HCs, and NWD vs. HWD.
Conclusion: Iron deposition in the liver and brain, as well as the extent of regional brain atrophy, may serve as predictive markers for the onset of WD, particularly NWD. All suspected and confirmed WD patients, regardless of NWD or HWD, should undergo brain and liver MRI for diagnostic evaluation and follow-up assessments.
Keywords
INTRODUCTION
Wilson’s disease (WD) is an autosomal recessive genetic disorder characterized by copper metabolism disturbance caused by mutations in the ATP7B (ATPase Copper Transporting Beta) gene. These mutations impair copper excretion, leading to its accumulation predominantly in organs such as the liver and brain. This copper overload subsequently induces a spectrum of clinical manifestations. WD can be classified into hepatic-type WD (HWD), which is primarily characterized by hepatic symptoms, and neurological-type WD (NWD), which is distinguished by neurological abnormalities. Diagnosis of WD is based on the Leipzig scoring system, which incorporates the presence or absence of Kayser-Fleischer (KF) rings, the presence and severity of neurological symptoms, serum ceruloplasmin (CP) concentration, the presence or absence of hemolytic anemia with negative Coombs’ test findings, quantitative hepatic copper content, rhodanine staining results of liver tissue, 24 h urinary copper, and ATP7B gene mutation analysis, among others[1-4].
Mild to moderate hepatic steatosis represents the most common non-specific alteration in early and mid-stage hepatic WD[5]. A study conducted an analysis of the liver pathology in WD children and revealed that 92% (34 out of 37) of WD children exhibited histological features of steatosis or steatohepatitis[6]. In severe cases, this condition may progress to advanced stages such as liver cirrhosis, liver failure, or hepatocellular carcinoma. Regular follow-up is recommended for affected patients[7]. It is also important to monitor liver fat levels in WD. However, at present, there are no clinical imaging studies that have specifically assessed hepatic fat content in patients with WD.
CP, serving as the primary copper carrier in the human body, plays a critical role in the transmembrane transport of iron by catalyzing the oxidation of ferrous ions (Fe2+) to ferric ions (Fe3+), thereby facilitating the binding of iron to transferrin[8,9]. Consequently, CP deficiency in WD can lead to systemic iron deposition. In Long Evans Cinnamon rats, a WD animal model, hepatocyte transplantation can reduce liver iron concentration associated with increased CP oxidase activity[9]. In addition, 7T magnetic resonance imaging (MRI) showed that the low T2/T2* signal intensity observed in the basal ganglia of WD is associated with iron deposition rather than copper accumulation[10]. Therefore, WD patients exhibit not only copper metabolism disorders but also disturbances in iron metabolism[11]. Previous studies have demonstrated that WD patients exhibit elevated quantitative susceptibility mapping (QSM) values (indicating excessive metal accumulation) in the putamen, globus pallidum, caudate nucleus and thalamus, which may contribute to microstructural damage within the basal ganglia. Nevertheless, it remains unclear whether QSM values are elevated in the liver. Additionally, the potential relationship between hepatic QSM changes and neurological symptoms has not been established.
Multiple studies have reported atrophy in the basal ganglia of WD patients, and the atrophy of the nucleus, globus pallidum, and putamen showed a positive correlation with scores on the Unified Wilson’s Disease Rating Scale (UWDRS). Of note, existing imaging studies have primarily focused on regional brain volumes in limited cerebral areas in WD patients, and subtype analysis was rarely conducted.
To address these issues, we systematically assessed the hepatic fat content, iron deposition in the liver and brain, and brain atrophy in patients with HWD and NWD through brain and liver MRI. Next, we analyzed the correlation between detection indices and neurological manifestations. Importantly, we screened the diagnostic indices for WD by LASSO (Least Absolute Shrinkage and Selection Operator) regression analysis, and evaluated their diagnostic power by receiver operating characteristic (ROC) analysis and area under the curve (AUC). This study integrates multimodal neuroimaging and hepatic imaging analysis and provides novel insights into the diagnosis and severity assessment of WD. Especially, our work contributes new and reliable evidence to refine clinical guidelines of WD.
METHODS
Study subjects
This study enrolled participants who provided consent and underwent 3.0T MRI examination of both the brain and liver, with these individuals derived from our prior cohort[12] (May 2021 to June 2023). Healthy controls (HCs) were recruited from the general population undergoing routine health examinations, age- and sex-matched with WD patients. The matching criteria were complete gender consistency and an age difference allowance of ±3 years. Subsequently, the HCs underwent the same 3.0T MRI of the brain and liver. In brief, a total of 17 HWD patients (mean age, 28.41 years; 10 female, seven male) from Beijing YouAn Hospital (hepatology centers in China, along with 10 NWD patients (mean age, 30.80 years; 2 female, eight male) and 11 HCs (mean age, 30.64 years; five female, five male) from Beijing Tiantan Hospital (Neurology centers in China). This study has been approved by the Ethics Committee of Beijing You’an Hospital, Capital Medical University (Ethics Number: LL-2019-029-K). All participants signed written informed consent forms.
The diagnosis of WD was established according to the widely recognized Leipzig scoring criteria mentioned in the guidelines of the American Association for the Study of Liver Diseases (AASLD)[1] and the Chinese guidelines[7] for WD. According to the corresponding diagnostic and classification criteria[12,13,14] for hepatic and neurological types, WD was grouped as follows: HWD, comprehensive and meticulous clinical and neurological examinations are required to exclude the presence of neurological symptoms in patients; NWD, it refers to patients who have presented neurological and/or psychiatric symptoms at the time of diagnosis, and these symptoms are not associated with symptomatic liver disease.
All three groups, including the HWD group, the NWD group, and the HC group, underwent harmonized brain and liver MRI (including field strength and imaging protocols). The information related to clinical phenotypes, demographic characteristics, age of onset, disease duration, presence of KF rings, treatment regimens and durations, CP levels, liver function and blood routine tests was systematically collected. We also calculated the various scores of WD patients with different clinical phenotypes, including Mini-Mental State Examination (MMSE) scores, Montreal Cognitive Assessment (MoCA) scores, Global Assessment Scale for WD (GAS for WD)[15], and UWDRS[16]. Among them, MMSE is a widely recognized standardized scale commonly employed to assess cognitive function in adults. MoCA is a standardized assessment tool for screening mild cognitive impairment and early-stage dementia. GAS for WD is a clinical scoring instrument specifically developed to evaluate the severity of neurological manifestations in patients with WD. The UWDRS is a standardized clinical scoring instrument designed to evaluate the severity of multi-system manifestations in WD patients, encompassing neurological, hepatic, and psychiatric features. It represents one of the most comprehensive disease-specific scales currently available. This prospective study was approved by the institutional ethics committee.
MRI data acquisition
All participants underwent 3.0T brain MRI (Germany, Siemens Healthcare, MAGNETOM Prisma) and 3.0T liver MRI (USA, GE Healthcare, PREMIER Prisma) scans at Beijing Tiantan Hospital, Capital Medical University, Beijing, China [Figure 1]. Three-dimensional (3D) T1-weighted images of the brain were acquired using a sagittal magnetization-prepared rapid gradient-echo (GRE) sequence with the specific sequence parameters: TE (echo time)/TR (repetition time)/TI (inversion time) = 2.0/2000/880 ms, flip angle = 8°, voxel size = 1 mm3 × 1 mm3 × 1 mm3. The 3.0T liver MRI routine abdominal scan incorporated the iterative decomposition of water and fat with echo asymmetry and least-squares estimation-iron quantification (IDEAL-IQ) sequence with the following sequence parameters: TE/TR = 0.9-4.2/5.7 ms, flip angle = 3°, image matrix size = 128 × 128.
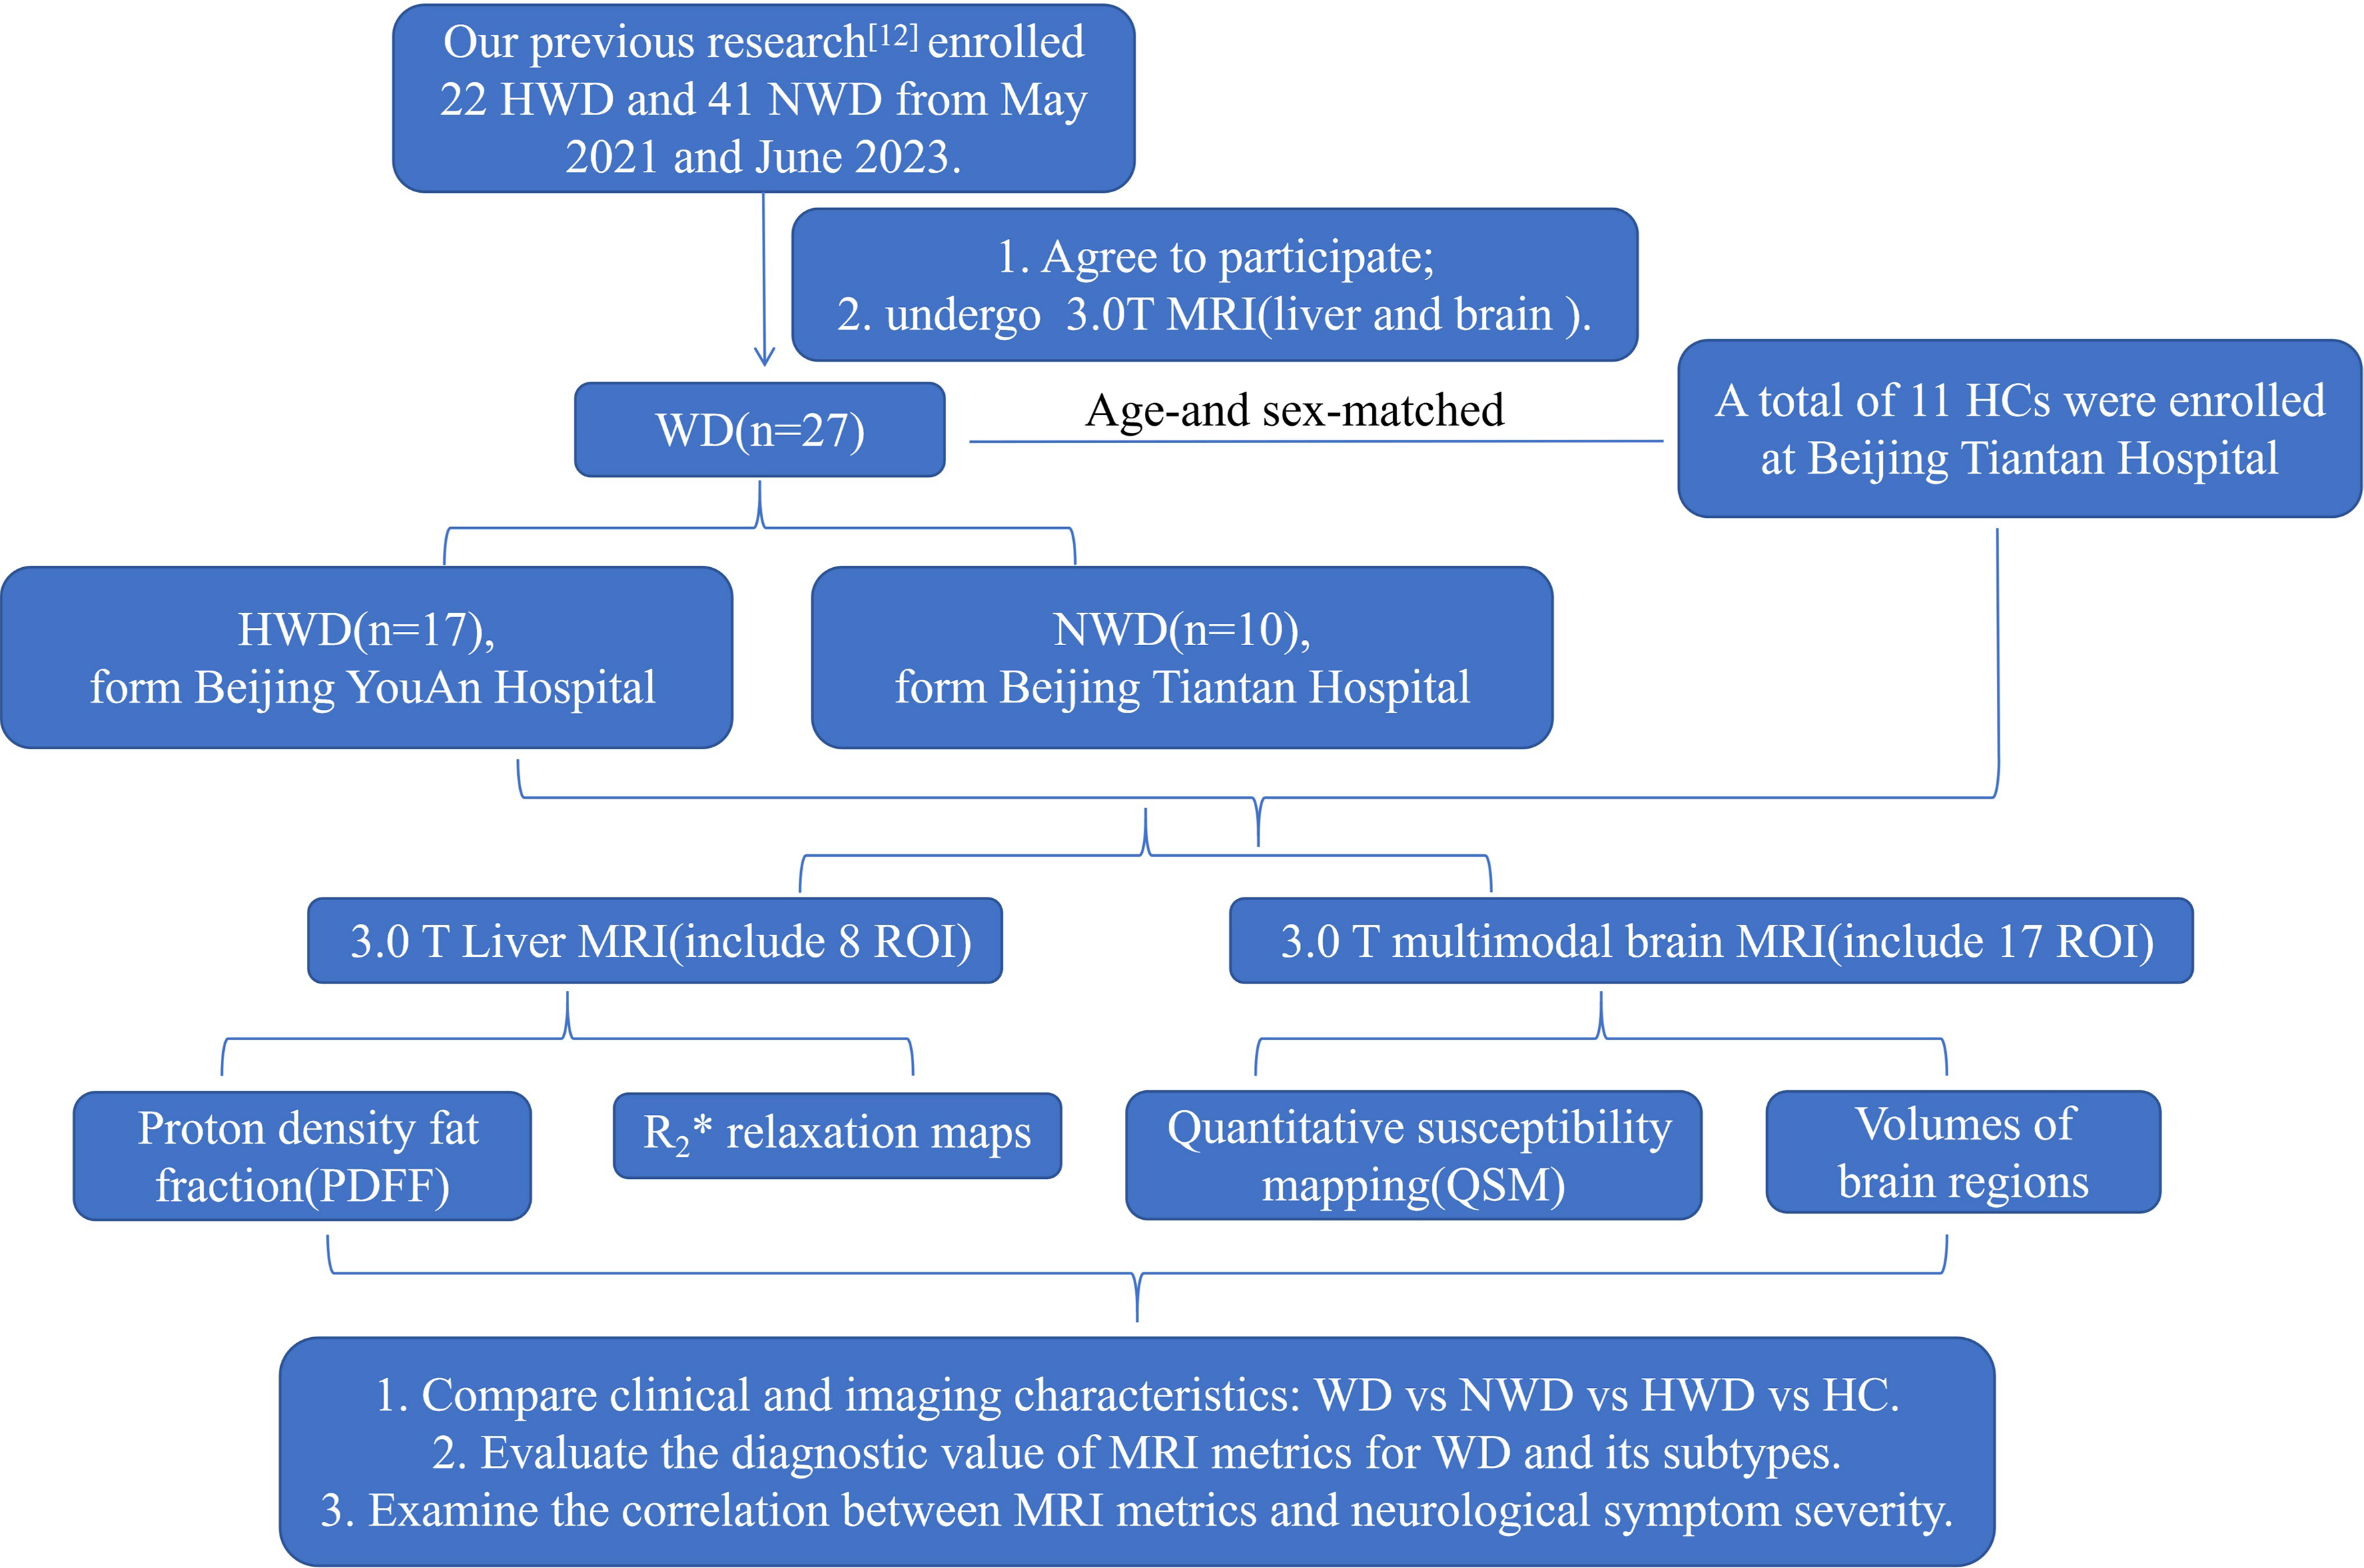
Figure 1. Flowchart of the study design. WD: Wilson’s disease; NWD: neurological Wilson’s disease; HWD: hepatic Wilson’s disease; HCs: healthy controls; ROI: region of interest; MRI: magnetic resonance imaging; R2*: the rate of signal decay caused by the combined effects of intrinsic tissue properties and magnetic field inhomogeneities, and were generated to quantify iron deposition.
To ensure the repeatability of the region of interest (ROI) localization in liver imaging and neuroimaging analysis, for liver MRI features, the maximum fitting ROI was placed in each of the eight Couinaud liver segments [Figure 2A], carefully avoiding major blood vessels, bile ducts, and obvious image artifacts[17]. The R2* relaxation maps (Hz), reflecting the rate of signal decay caused by both intrinsic tissue properties and magnetic field inhomogeneities, were generated to quantify iron deposition [Figure 2B][18], while proton density fat fraction (PDFF, %) was measured to evaluate hepatic steatosis [Figure 2C][19].
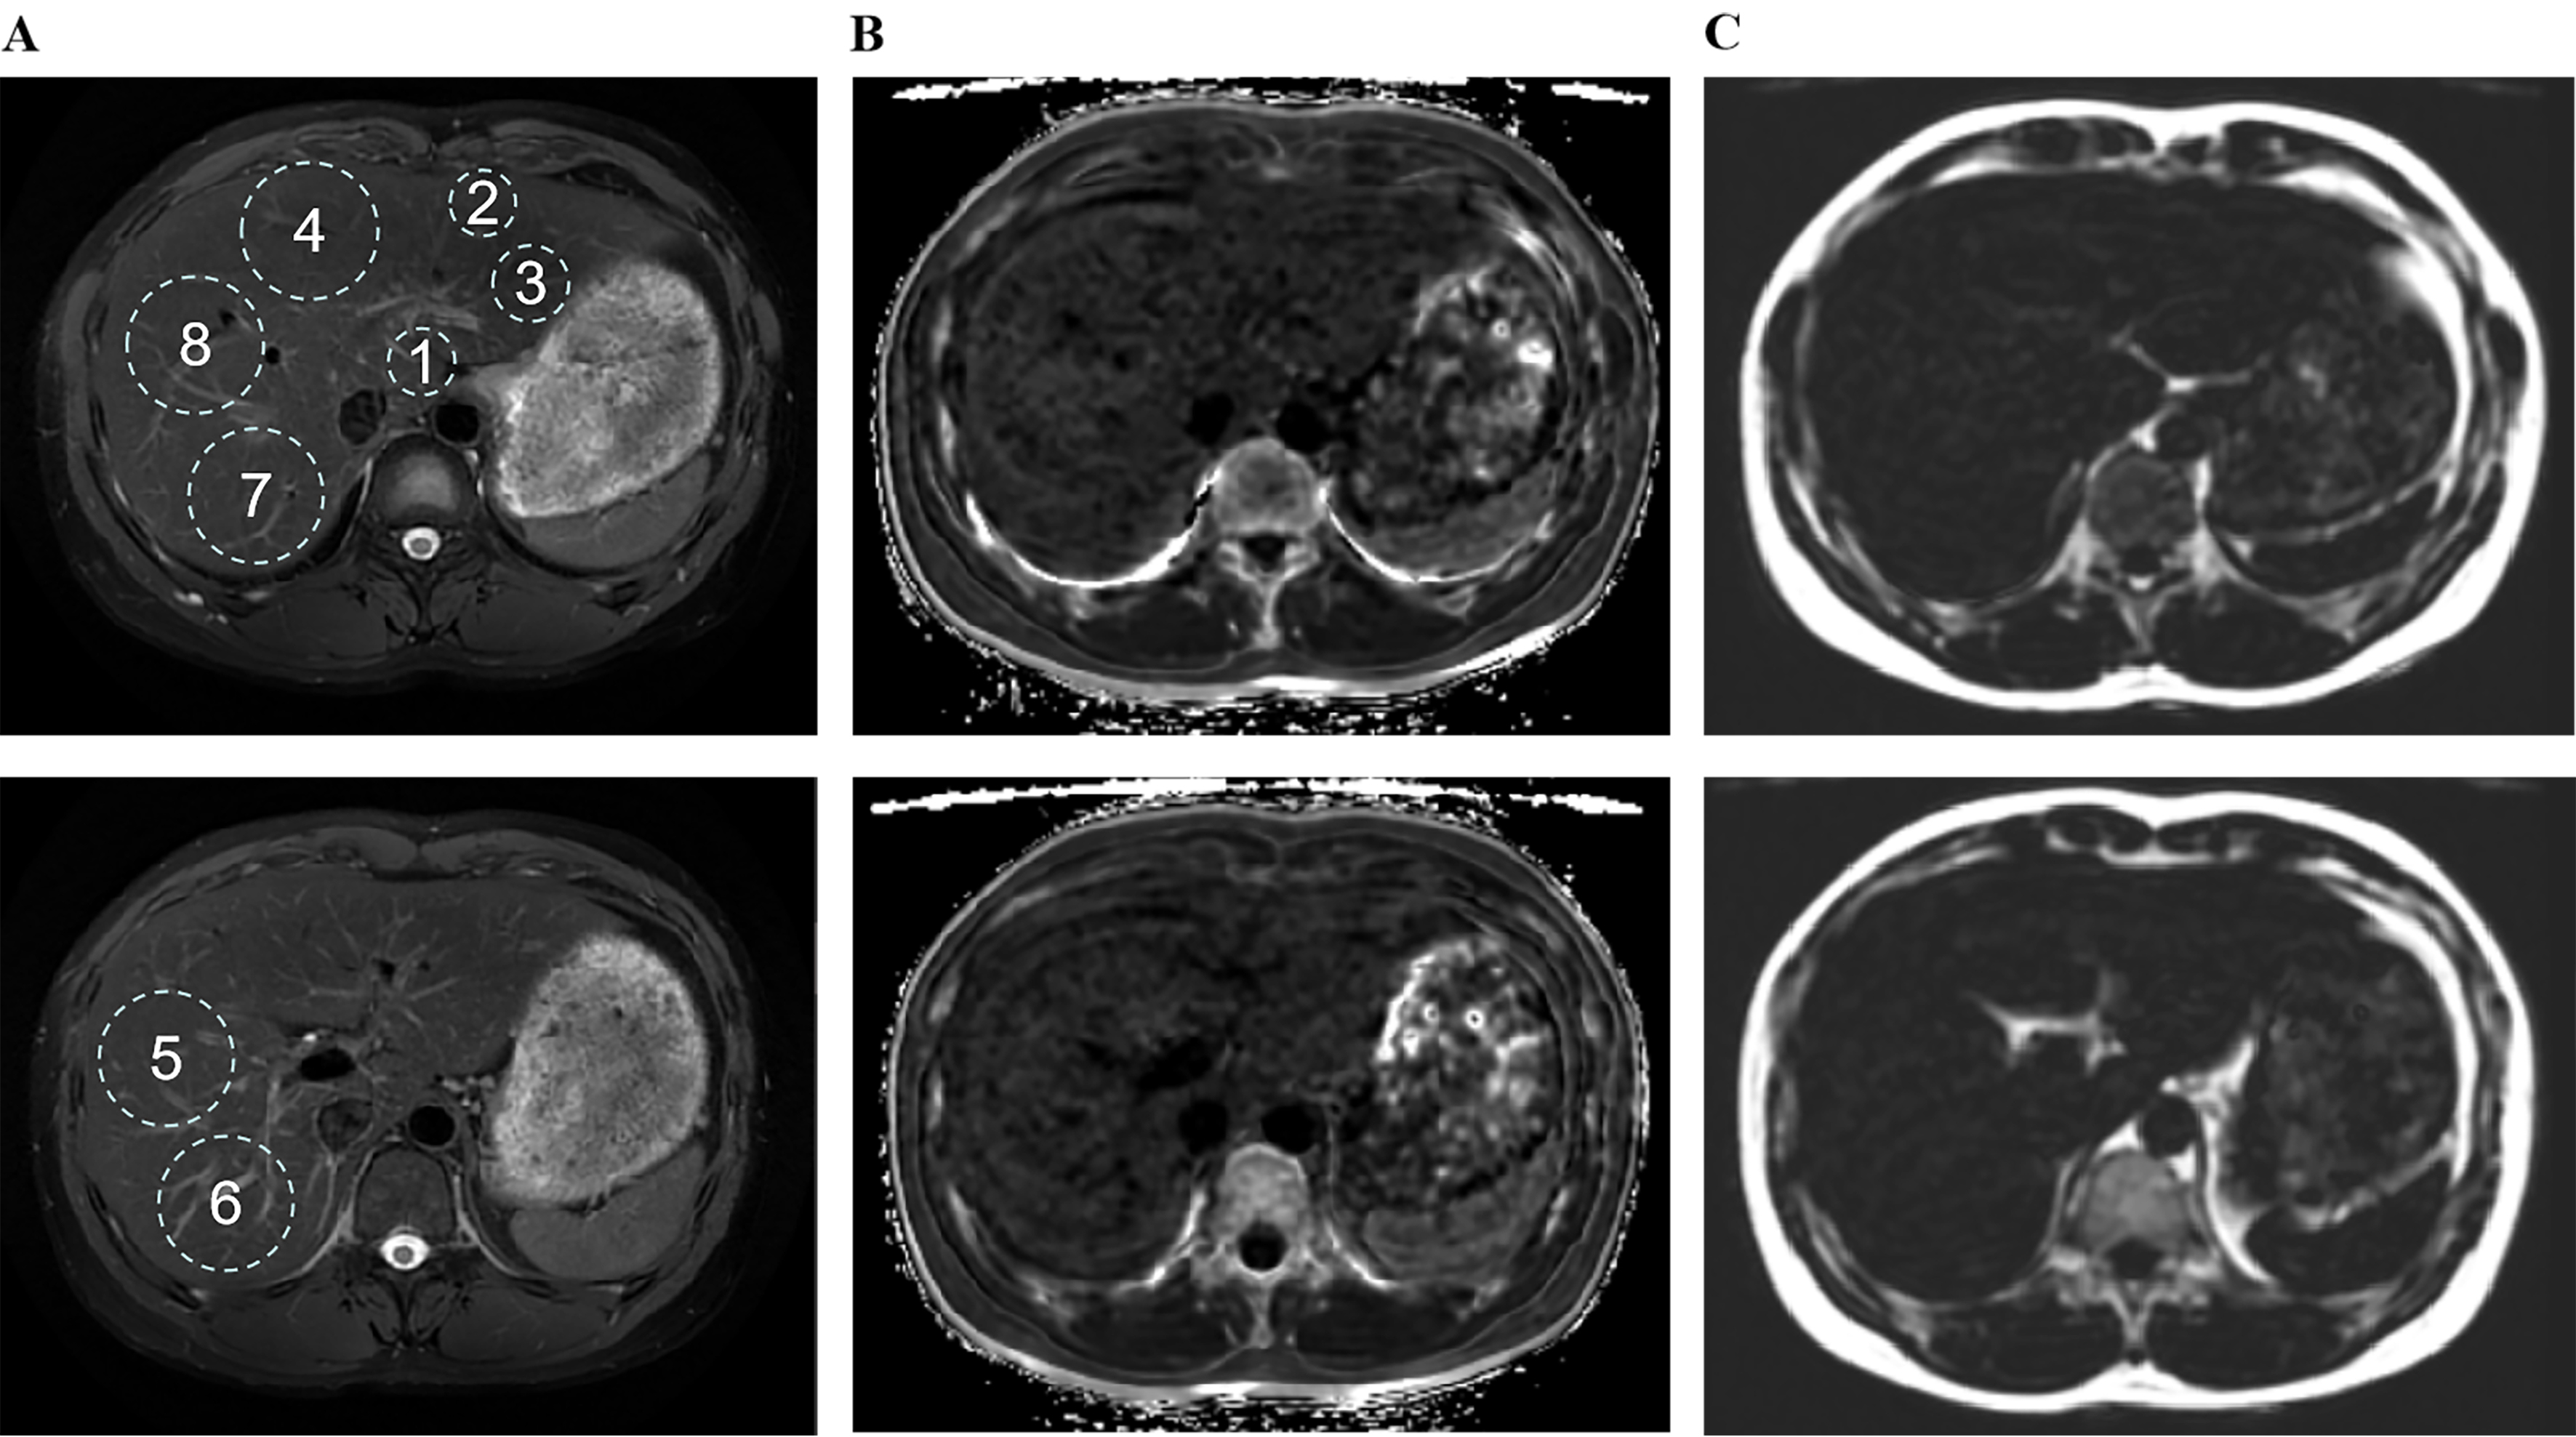
Figure 2. Size, location, and quantity of ROIs numbered 1 to 8 in liver magnetic resonance imaging, using Wilson’s disease patients as a representative example. ROIs for paradigms 1-8 were placed in the largest fit, respectively. (A) RTr-Ax-T2-fs-Prop is utilized to identify anatomical structures; (B) R2 star-BH-IDEAL-IQ is employed for the quantification of iron; (C) FatFrac-BH-IDEAL-IQ is applied for the quantification of fat. ROIs: Region of interest; RTr-Ax-T2-fs-Prop: (specific MRI sequence, name retained from original); R2: the rate of signal decay caused by the combined effects of intrinsic tissue properties and magnetic field inhomogeneities, and were generated to quantify iron deposition; BH: breath hold; IDEAL-IQ: iterative decomposition of water and fat with echo asymmetry and least-squares estimation-iron quantification; FatFrac: fat fraction.
For brain MRI, a 3.0T scanner (Trio; Siemens) was used [Figure 3A and B]. Volumetric analysis (mm3) was conducted using Voxel-based morphometry-the methods[20]. QSM (ppm) was performed using a 3D axial multi-echo GRE sequence to assess iron deposition in specific brain regions[21]. Individualized brain masks were extracted from T1-weighted structural images and then registered to the QSM image space. The QSMbox toolbox (https://gitlab.com/acostaj/QSMbox) was used to compute QSM. Finally, statistical analysis was performed using susceptibility maps referenced to cerebrospinal fluid (CSF). Both the brain volume and QSM analyses encompassed 17 regions, including the left and right cerebellum cortex, thalamus proper, caudate, putamen, pallidum, hippocampus, amygdala, accumbens area, and brainstem.
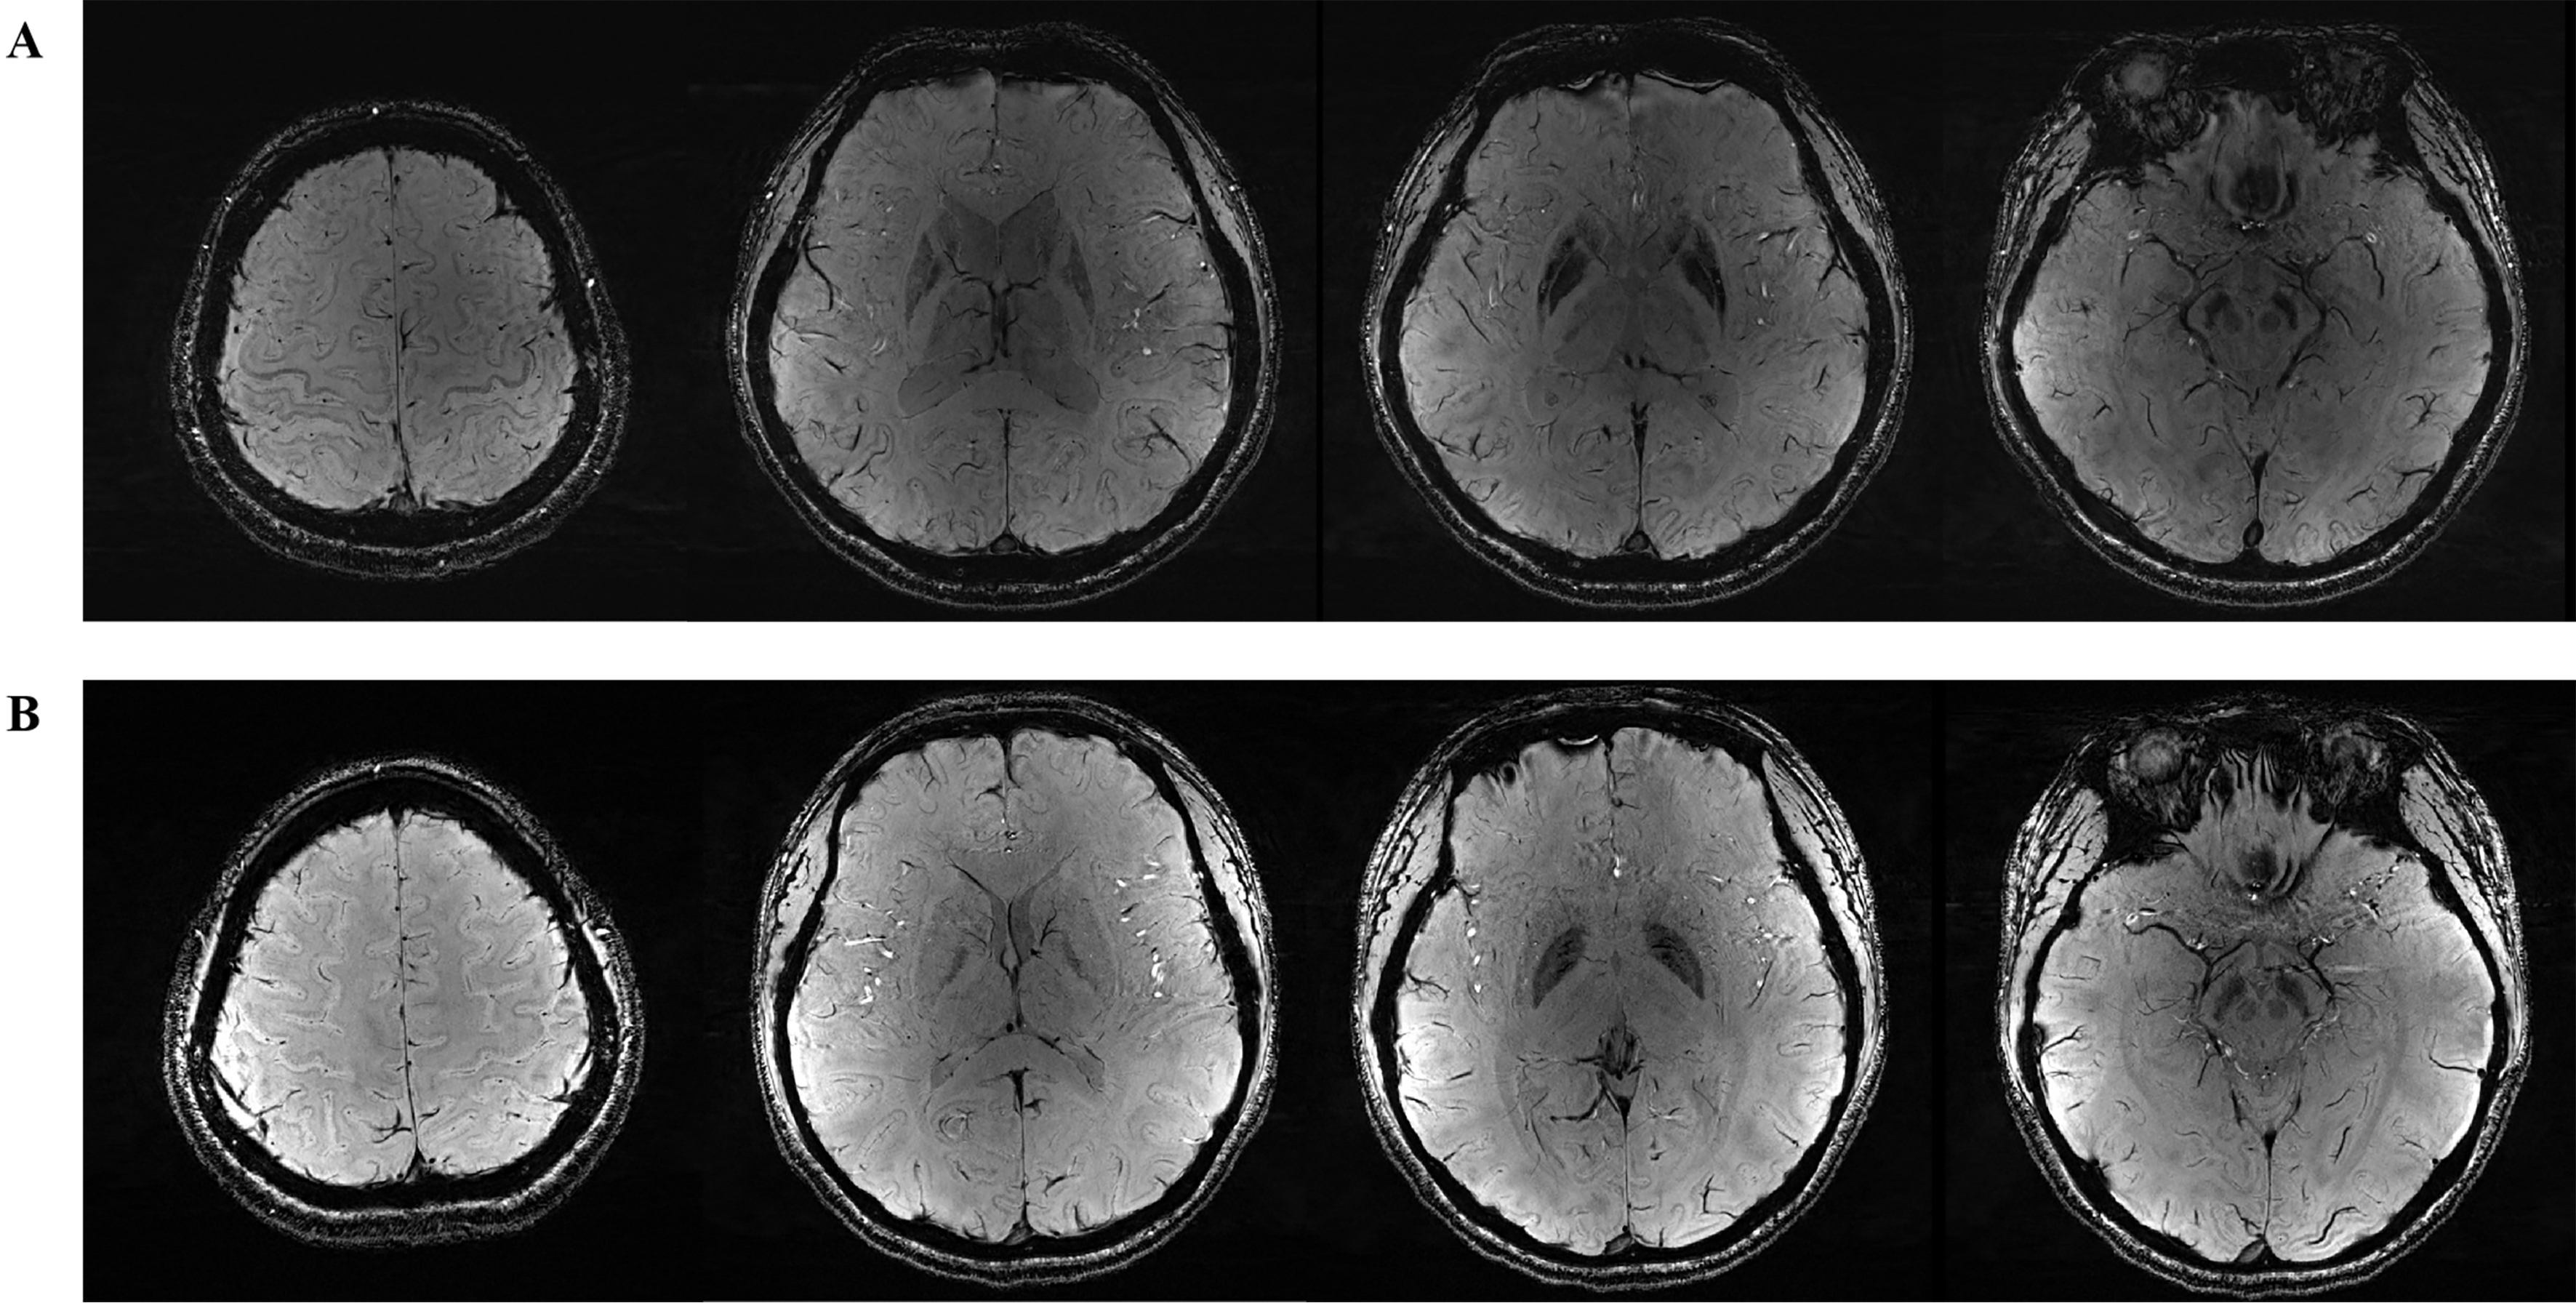
Figure 3. SWI in brain magnetic resonance imaging. (A) Wilson’s disease patient; (B) Healthy control. SWI: Susceptibility weighted imaging.
The brain QSM values, regional brain volumes, liver fat content, and liver iron quantifications were compared and analyzed among the WD, HWD, NWD, and HC groups.
Statistical analysis
For continuous variables, the distribution characteristics were first assessed using the Shapiro-Wilk (S-W) test. Data with P > 0.05 were considered to follow a normal distribution and are presented as mean ± standard error (SEM), with inter-group comparisons conducted using the independent samples t test. For data not conforming to a normal distribution (P ≤ 0.05), the median [interquartile range, M (Q1-Q3)] was used for representation, and the Mann-Whitney U test was applied for inter-group comparisons. Categorical variables were analyzed using the chi-square test. Categorical variables were described using frequency and proportion to characterize the features of different groups, with inter-group comparisons performed using the chi-square test or Fisher’s exact test when appropriate. Moreover, diagnostic variable selection was performed using LASSO regression, and the diagnostic power of selected variables was subsequently evaluated through ROC curves, and the AUC was calculated. Additionally, correlation analysis was conducted to explore the relationship between MRI-related metrics and neuropsychiatric scores. All statistical analyses were performed using SPSS software (Statistical Package for the Social Sciences, version 26.0) and R Studio (version 4.4), and P < 0.05 was considered statistically significant.
RESULTS
Demographic and clinical characteristics of study subjects
Ultimately, 38 cases were enrolled into this study, comprising 17 cases of HWD, 10 cases of NWD and 11 cases of HC. There were 4 cases of untreated WD patients: 3 cases of HWD and 1 case of NWD. No significant differences were observed in demographic characteristics (including age, gender, and education level) among the groups (All P > 0.05) [Table 1]. In addition, patients with HWD and NWD exhibited similar features in MMSE scores, MOCA scores, age of onset, disease duration, presence of KF ring, therapeutic drugs, treatment duration and CP levels (All P > 0.05). Among the parameters related to liver function and blood routine tests, only direct bilirubin (P < 0.05) and platelets (P < 0.01) showed differences between the NWD and the HWD; however, the median values for direct bilirubin and platelet count remained within the normal range [Table 1].
Demographic characteristics of neurological WD, hepatic Wilson’s disease and healthy controls
| Characteristics | WD (n = 27) | NWD (n = 10) | HWD (n = 17) | HC (n = 11) |
| Age (years) | 29.3 ± 7.92 | 30.80 ± 6.00 | 28.41 ± 8.91 | 30.64 ± 6.27 |
| Male, n (%) | 15 (55.6%) | 8 (80%) | 7 (41.2%) | 5 (45.5%) |
| Educational years | 13.85 ± 3.45 | 14.6 ± 3.20 | 13.41 ± 3.61 | 15.82 ± 3.60 |
| MMSE | 29.52 ± 0.80 | 29.40 ± 0.84 | 29.59 ± 0.80 | 29.55 ± 0.82 |
| MOCA | 27.3 ± 2.13 | 26.90 ± 1.66 | 27.53 ± 2.38 | 28.36 ± 2.54 |
| Age of onset (years) | 22.81 ± 8.28 | 22.30 ± 7.38 | 23.12 ± 8.98 | |
| Disease duration (years) | 3.00 (1.25, 8.00) | 3.00 (1.13, 11.50) | 3.00 (2.00, 8.00) | |
| De-copper treatment duration (year) | 1.50 (0.60, 6.00) | 1.09 (0.19, 8.50) | 1.75 (0.88, 5.50) | |
| Drug naive | 4 (14.8%) | 1 (10.0%) | 3 (17.6%) | |
| Penicillamine | 22 (81.5%) | 9 (90%) | 13 (76.5%) | |
| Zinc agent | 18 (66.7%) | 5 (50%) | 13 (76.5%) | |
| KF ring | 19 (70.4%) | 9 (90%) | 10 (58.8%) | |
| GAS for WD**** | 0.00 (0.00, 7.00) | 10.50 (3.00, 17.00) | 0.00 (0.00, 0.00) | |
| UWDRS*** | 5.00 (4.00, 10.00) | 12.00 (8.50, 13.50) | 4.00 (3.00, 5.00) | |
| Ceruloplasmin | 50.00 (32.33, 100.70) | 61.48 (34.12, 112.97) | 48.94 (28.06, 90.65) | |
| ALT | 29.10 (23.40, 45.00) | 32.25 (26.63, 39.68) | 28.00 (21.25, 48.45) | |
| AST | 27.40 (23.40, 32.30) | 27.95 (19.93, 37.60) | 26.50 (23.70, 33.55) | |
| TP | 71.16 ± 7.79 | 68.16 ± 10.03 | 72.92 ± 5.76 | |
| ALB | 44.60 (41.50, 47.30) | 43.70 (34.45, 47.10) | 45.50 (42.70, 47.55) | |
| GLB | 27.26 ± 4.26 | 26.59 ± 4.51 | 27.65 ± 4.19 | |
| A/G | 1.64 ± 0.24 | 1.59 ± 0.18 | 1.68 ± 0.27 | |
| TBil | 13.30 (8.70, 24.40) | 11.21 (8.19, 18.05) | 17.40 (9.63, 24.75) | |
| DBil* | 4.35 (2.57, 8.61) | 3.50 (3.03, 5.75) | 5.30 (2.49, 8.66) | |
| IBil | 9.60 (6.00, 15.70) | 7.20 (5.13, 11.78) | 13.00 (7.25, 16.45) | |
| WBC | 5.13 (3.52, 6.12) | 5.17 (3.25, 6.90) | 5.13 (3.62, 5.89) | |
| LY | 1.56 (1.14, 2.01) | 1.48 (0.97, 1.95) | 1.58 (1.16, 2.05) | |
| MONO | 0.30 (0.25, 0.41) | 0.29 (0.28, 0.39) | 0.34 (0.24, 0.42) | |
| NEUT | 2.62 (2.00, 3.67) | 2.63 (1.87, 4.15) | 2.62 (2.23, 3.48) | |
| LY (%) | 31.70 ± 8.13 | 29.86 ± 8.33 | 32.78 ± 8.06 | |
| MO (%) | 6.78 ± 1.31 | 6.81 ± 1.78 | 6.76 ± 1.01 | |
| GR (%) | 58.60 ± 8.30 | 59.43 ± 9.11 | 58.11 ± 8.04 | |
| RBC | 4.75 ± 0.44 | 4.73 ± 0.52 | 4.69 ± 0.41 | |
| HGB | 140.52 ± 17.45 | 143.80 ± 20.19 | 138.59 ± 15.95 | |
| PLT** | 135.00(77.00, 185.00) | 132.50 (100.00, 155.50) | 165.00 (68.00, 211.00) |
Comparison of imaging signatures in liver and brain MRI between WD and HCs
In this study, we quantified and compared R2 values and fat deposition in liver MRI, as well as QSM values and volume of brain regions in brain MRI between WD (n = 27) and HCs (n = 11) [Supplementary Table 1]. Compared with the HCs, the liver fat content in WD patients showed a slight increase, although no statistically significant difference was observed. In contrast, the R2 values of the V segments in the liver of WD patients were significantly higher than those of HCs (P < 0.05). Additionally, the R2 value in the seventh couinaud liver demonstrated an elevated tendency (P = 0.05) [Figure 4A]. In brain MRI, WD patients manifested significantly increased QSM values in the bilateral caudate and accumbens area (all P < 0.05) [Figure 4B], and significantly decreased brain volumes in the bilateral cerebellum cortex, thalamus proper, caudate, putamen, pallidum, hippocampus and brainstem (all P < 0.05) [Figure 4C]. Notably, in the brain MRI of WD, only the bilateral caudate showed the coexistence of an increase in QSM values and a decrease in brain volume. Therefore, we evaluated the diagnostic performance of liver segments V and VII, as well as the QSM values and volume in the brain for WD. These indices exhibited high diagnostic performance with an AUC of 0.82 [95% confidence interval (CI): 0.71-0.93] [Supplementary Table 2]. Remarkably, except for the previously reported reduction in brain QSM values and the degree of brain volume, the UWDRS score was found to be positively correlated with liver iron quantification [correlation (r) = 0.635, P = 0.048]
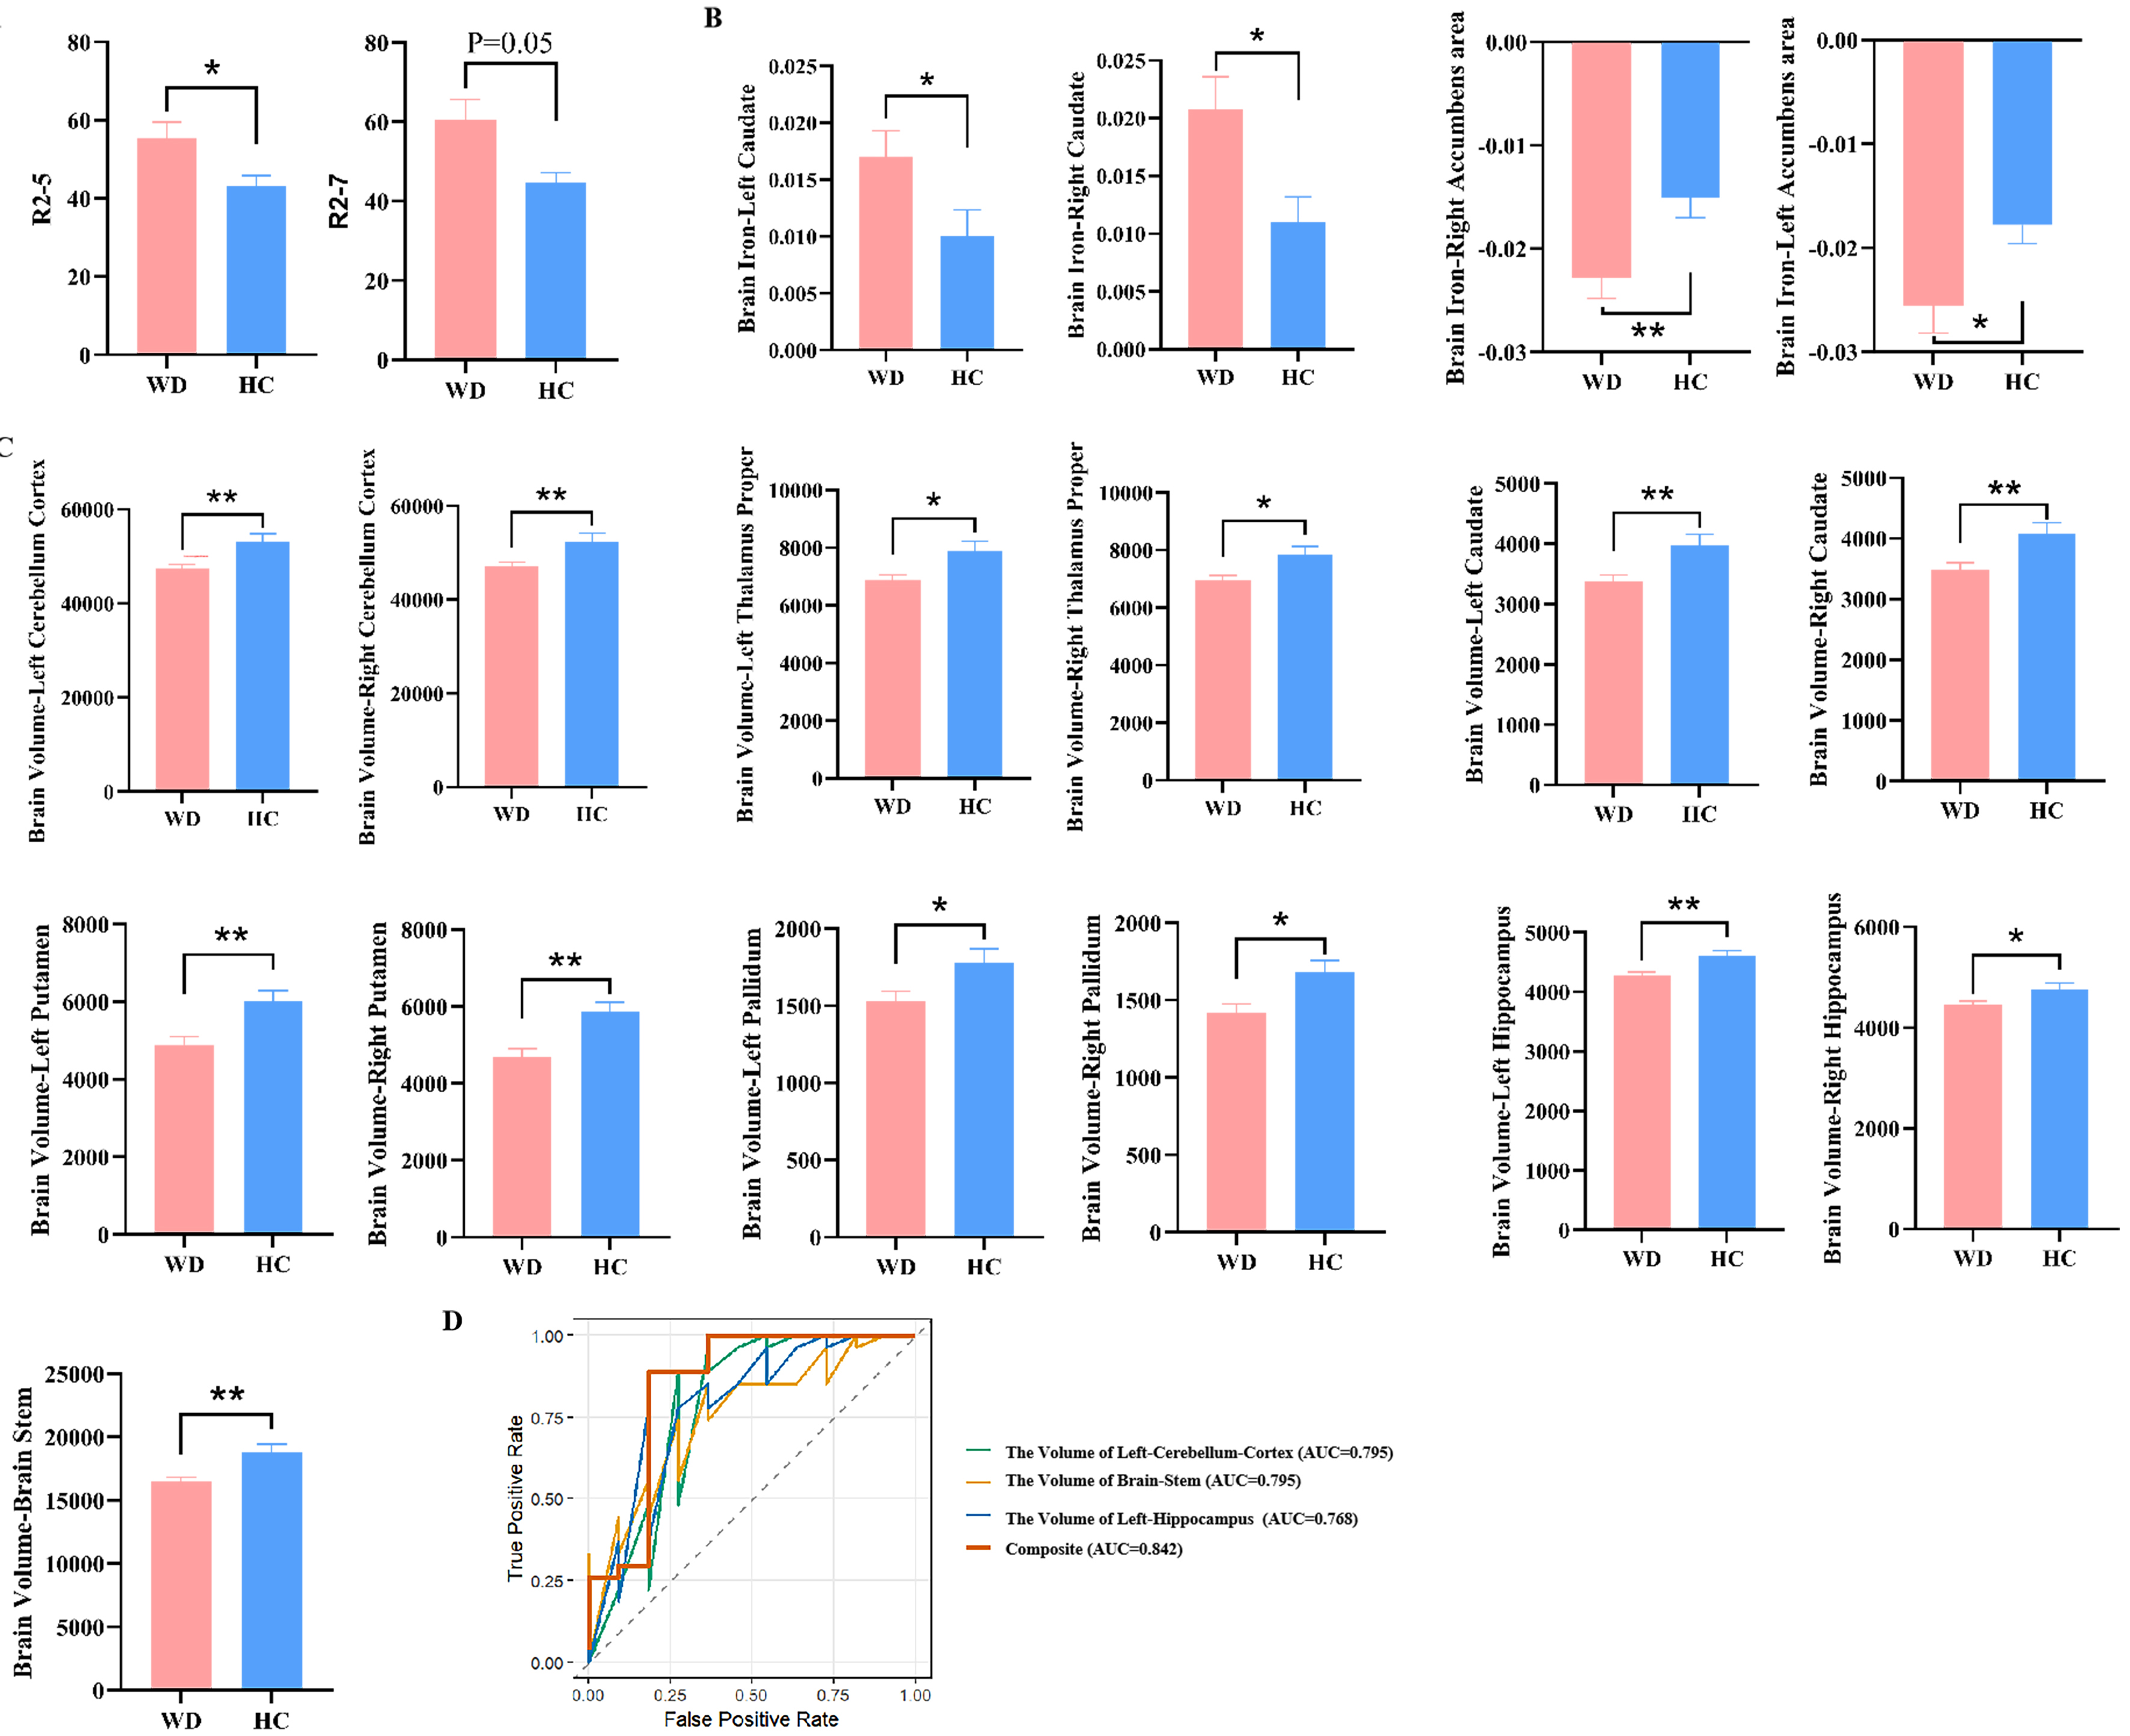
Figure 4. Comparison of neuroimaging and hepatic imaging characteristics of WD and HCs. (A) Difference in liver R2 values between WD and HC; (B) Difference in brain QSM value in WD and HC; (C) Difference in Brain volumes in WD and HC. “R2” denotes the quantified iron deposition measured within the ROIs in the eight Couinaud liver segments. “Brain iron” indicates the assessment of iron deposition in specific brain regions using QSM; (D) The ROC curves and AUC values illustrating the diagnostic performance of the selected variables using LASSO regression to distinguish between WD and HCs. Results are expressed as mean ± SEM. ****P < 0.0001;
To identify the key variables that can differentiate WD patients from HCs accurately, LASSO regression was employed. As a result, only three MRI indicators, namely, the volume of the left cerebellum cortex, brainstem, and left hippocampus, were screened out. The apparent AUC was 0.842 (95%CI: 0.664-1.000) when these three indicators were combined, indicating that the model has a good discriminative performance within the training set [Figure 4D]. However, after internal validation using 100 bootstrap resamples, the corrected AUC decreased to 0.693 (95%CI: 0.462-0.929).
Comparison of imaging signatures in liver and brain MRI between NWD and HCs
Compared to the HC group (n = 11), the NWD group (n = 10) exhibited significant iron deposition in liver segments V, VI, and VII (P < 0.05) [Supplementary Table 4 and Figure 5A], while no significant differences were observed in liver fat content. Additionally, the QSM values of the bilateral caudate, putamen, pallidus and accumbens area were significantly increased (P < 0.05) [Supplementary Table 4 and Figure 5B]. Furthermore, the volumes of bilateral caudate, putamen and pallidus were significantly reduced (P < 0.05). In addition, the volumes of the bilateral cerebellum cortex, thalamus proper, hippocampus, brainstem, and right amygdala were also remarkably decreased (P < 0.05) [Supplementary Table 4 and Figure 5C]. We also assessed the diagnostic value of the aforementioned indicators for WD, and the AUC was higher than 0.7, suggesting a satisfactory diagnostic performance [Supplementary Table 5].
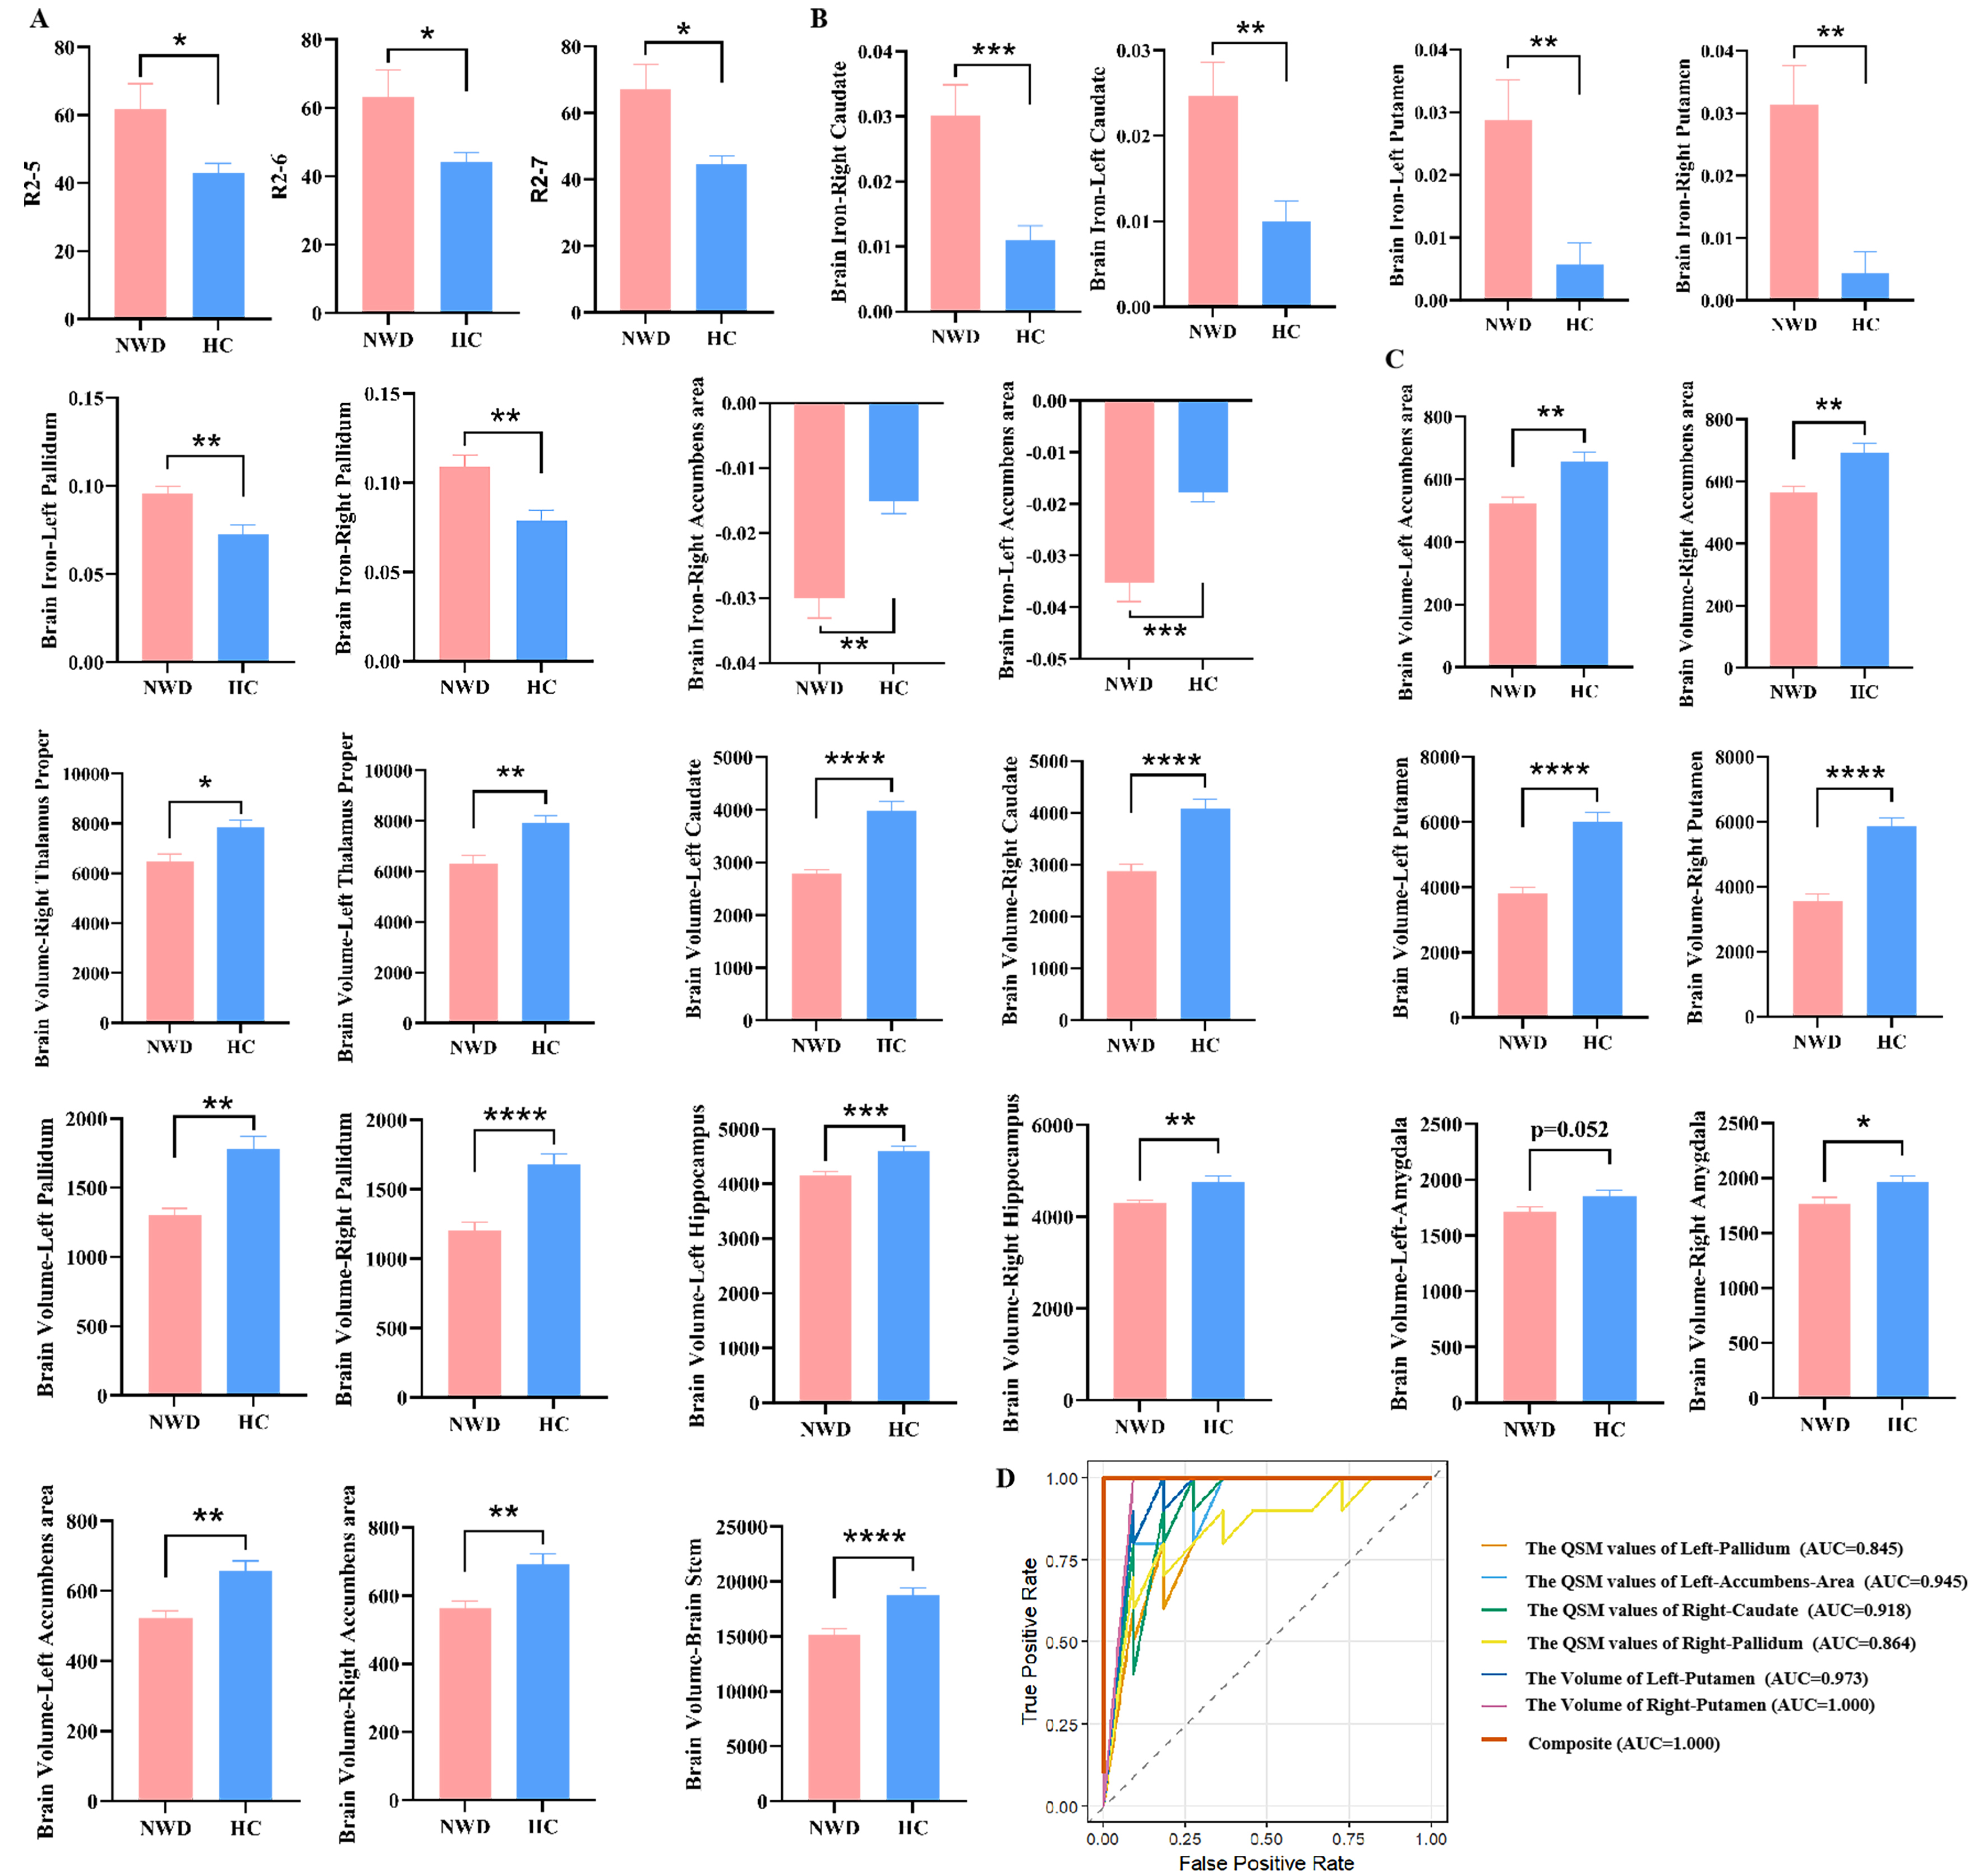
Figure 5. Comparison of neuroimaging and hepatic imaging characteristics of NWD and HCs. (A) Difference in liver R2 values between NWD and HC; (B) Difference in the brain QSM value in NWD and HC; (C) Difference in Brain volumes in NWD and HC. “R2” denotes the quantified iron deposition measured within the ROIs in the eight Couinaud liver segments. “Brain iron” indicates the assessment of iron deposition in specific brain regions using QSM; (D) ROC curves and AUC values illustrating the diagnostic performance of the selected variables using LASSO regression to distinguish between NWD and HCs. Results are expressed as mean ± SEM. ****P < 0.0001; ***P < 0.001; **P < 0.01; *P < 0.05. NWD: Neurological Wilson’s disease; HCs: healthy controls; QSM: quantitative susceptibility mapping; ROIs: regions of interest; ROC: receiver operating characteristic; AUC: area under the curve; LASSO: Least Absolute Shrinkage and Selection Operator; SEM: standard error of measurement.
After LASSO regression analysis, six MRI indicators were identified: the QSM values of the bilateral pallidum, left accumbens area, right caudate, and the volumes of the bilateral putamen. The apparent AUC was 1.000 (95%CI: 1.000-1.000) when these indicators were combined, indicating an excellent diagnostic power within the training set [Figure 5D]. Following 100 iterations of internal validation via bootstrap resampling, the model retained a corrected AUC of 0.932 (95%CI: 0.667-1.000).
Comparison of imaging signatures in liver and brain MRI between HWD and HCs
In the HWD group, significant atrophy was observed in the bilateral cerebellum cortex, left hippocampus, and brainstem (P < 0.05) [Figure 6A and Supplementary Table 6]. The AUC values for brain volume in the left cerebellum cortex and brainstem were both above 0.7, indicating acceptable diagnostic performance (P < 0.05) [Supplementary Table 7]. There were no significant differences in liver fat content and liver iron quantification (all P > 0.05).
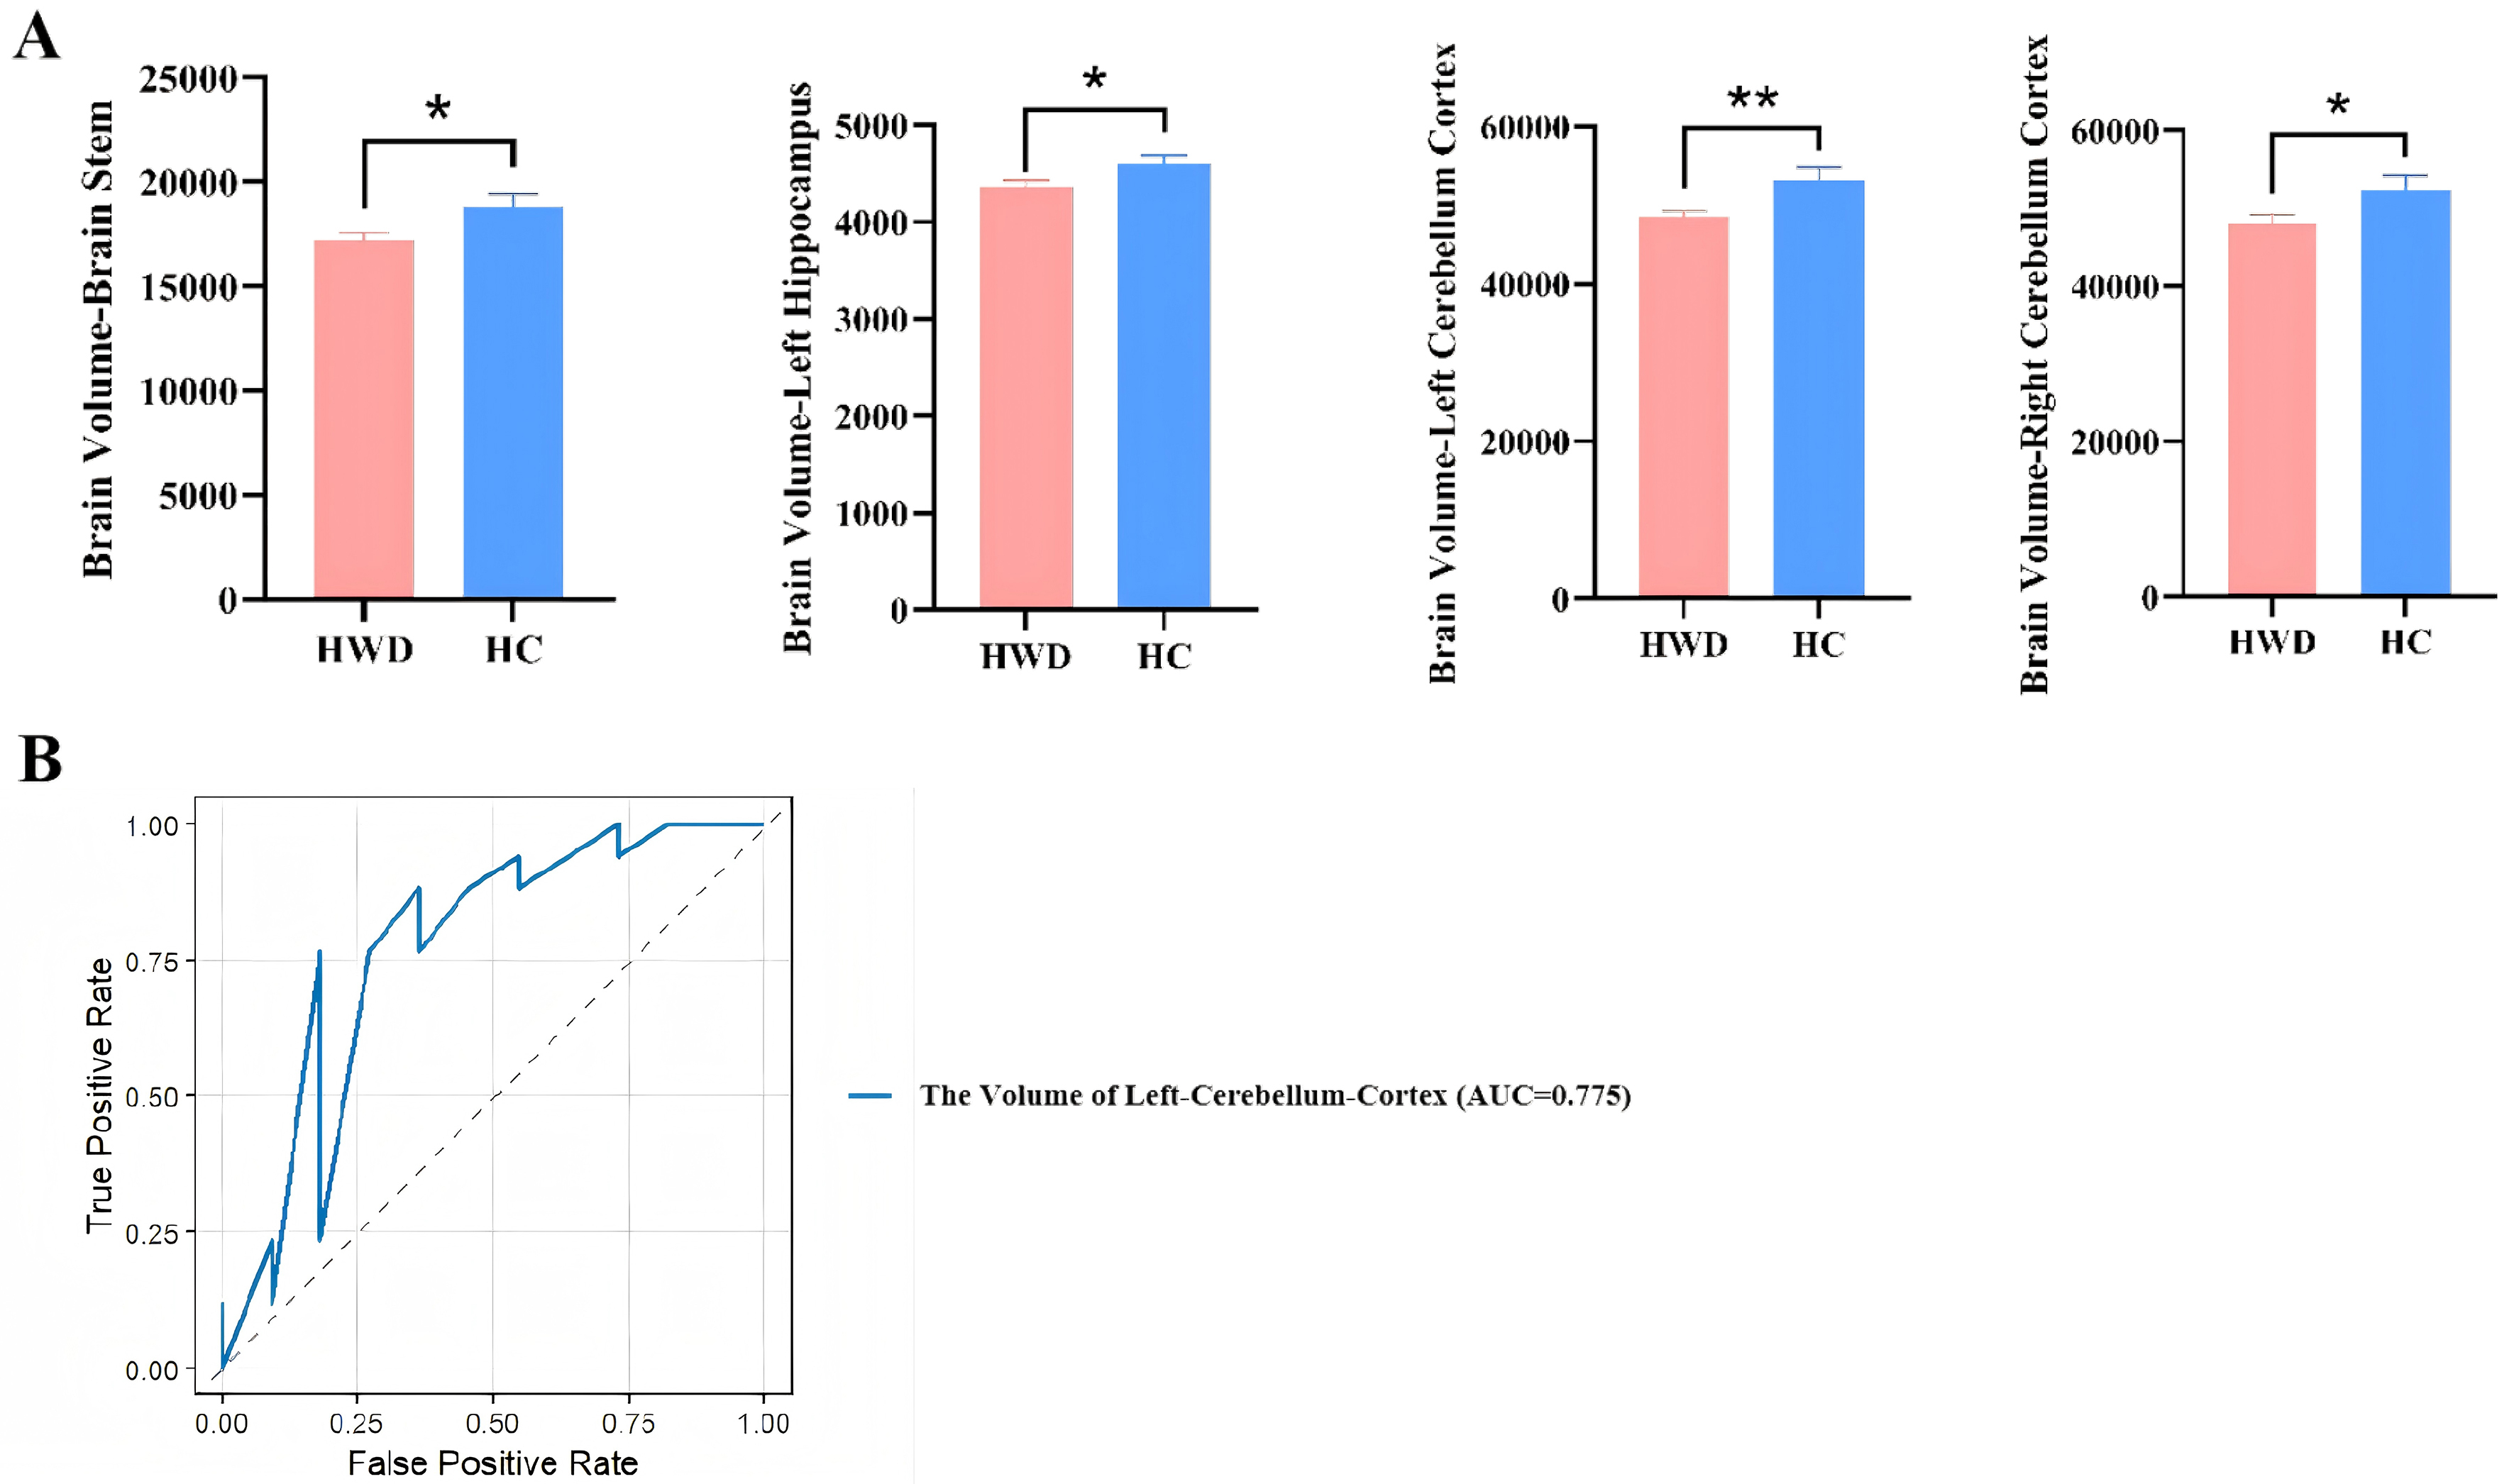
Figure 6. Comparison of neuroimaging and hepatic imaging characteristics of HWD and HCs. (A) Difference in brain volumes in HWD and HC; (B) ROC curves and AUC values illustrating the diagnostic performance of the selected variables using LASSO regression to distinguish between HWD and HCs. Results are expressed as mean ± SEM. ****P < 0.0001; ***P < 0.001; **P < 0.01; *P < 0.05. HWD: Hepatic Wilson’s disease; HCs: healthy controls; ROC: receiver operating characteristic; AUC: area under the curve; LASSO: Least Absolute Shrinkage and Selection Operator; SEM: standard error of measurement.
Similarly, no significant differences were detected in regional brain QSM values between the two groups (P > 0.05) [Supplementary Table 6].
After LASSO regression analysis, only one MRI index (the volume of the left cerebellum cortex) was retained. The apparent AUC of this single index, based on a sample of 28 subjects (HWD = 17, HC = 11), was 0.775 (95%CI: 0.573-0.978], indicating a moderate level of discriminatory ability within the training set [Figure 6B]. However, after conducting 100 bootstrap resamples for internal validation, the corrected AUC decreased to 0.627 (95%CI: 0.434-0.874).
Comparison of imaging signatures in liver and brain MRI between HWD and NWD
Compared with the HWD group, NWD patients exhibited significantly increased QSM values in the bilateral caudate, pallidus, putamen and accumbens area [Figure 7A and Supplementary Table 8]. Additionally, the volumes of regions including the bilateral thalamus proper, caudate, pallidus, putamen, accumbens, brainstem, and right hippocampus were significantly reduced [Figure 7B and Supplementary Table 8]. These changes manifested good diagnostic values with AUC values greater than 0.7
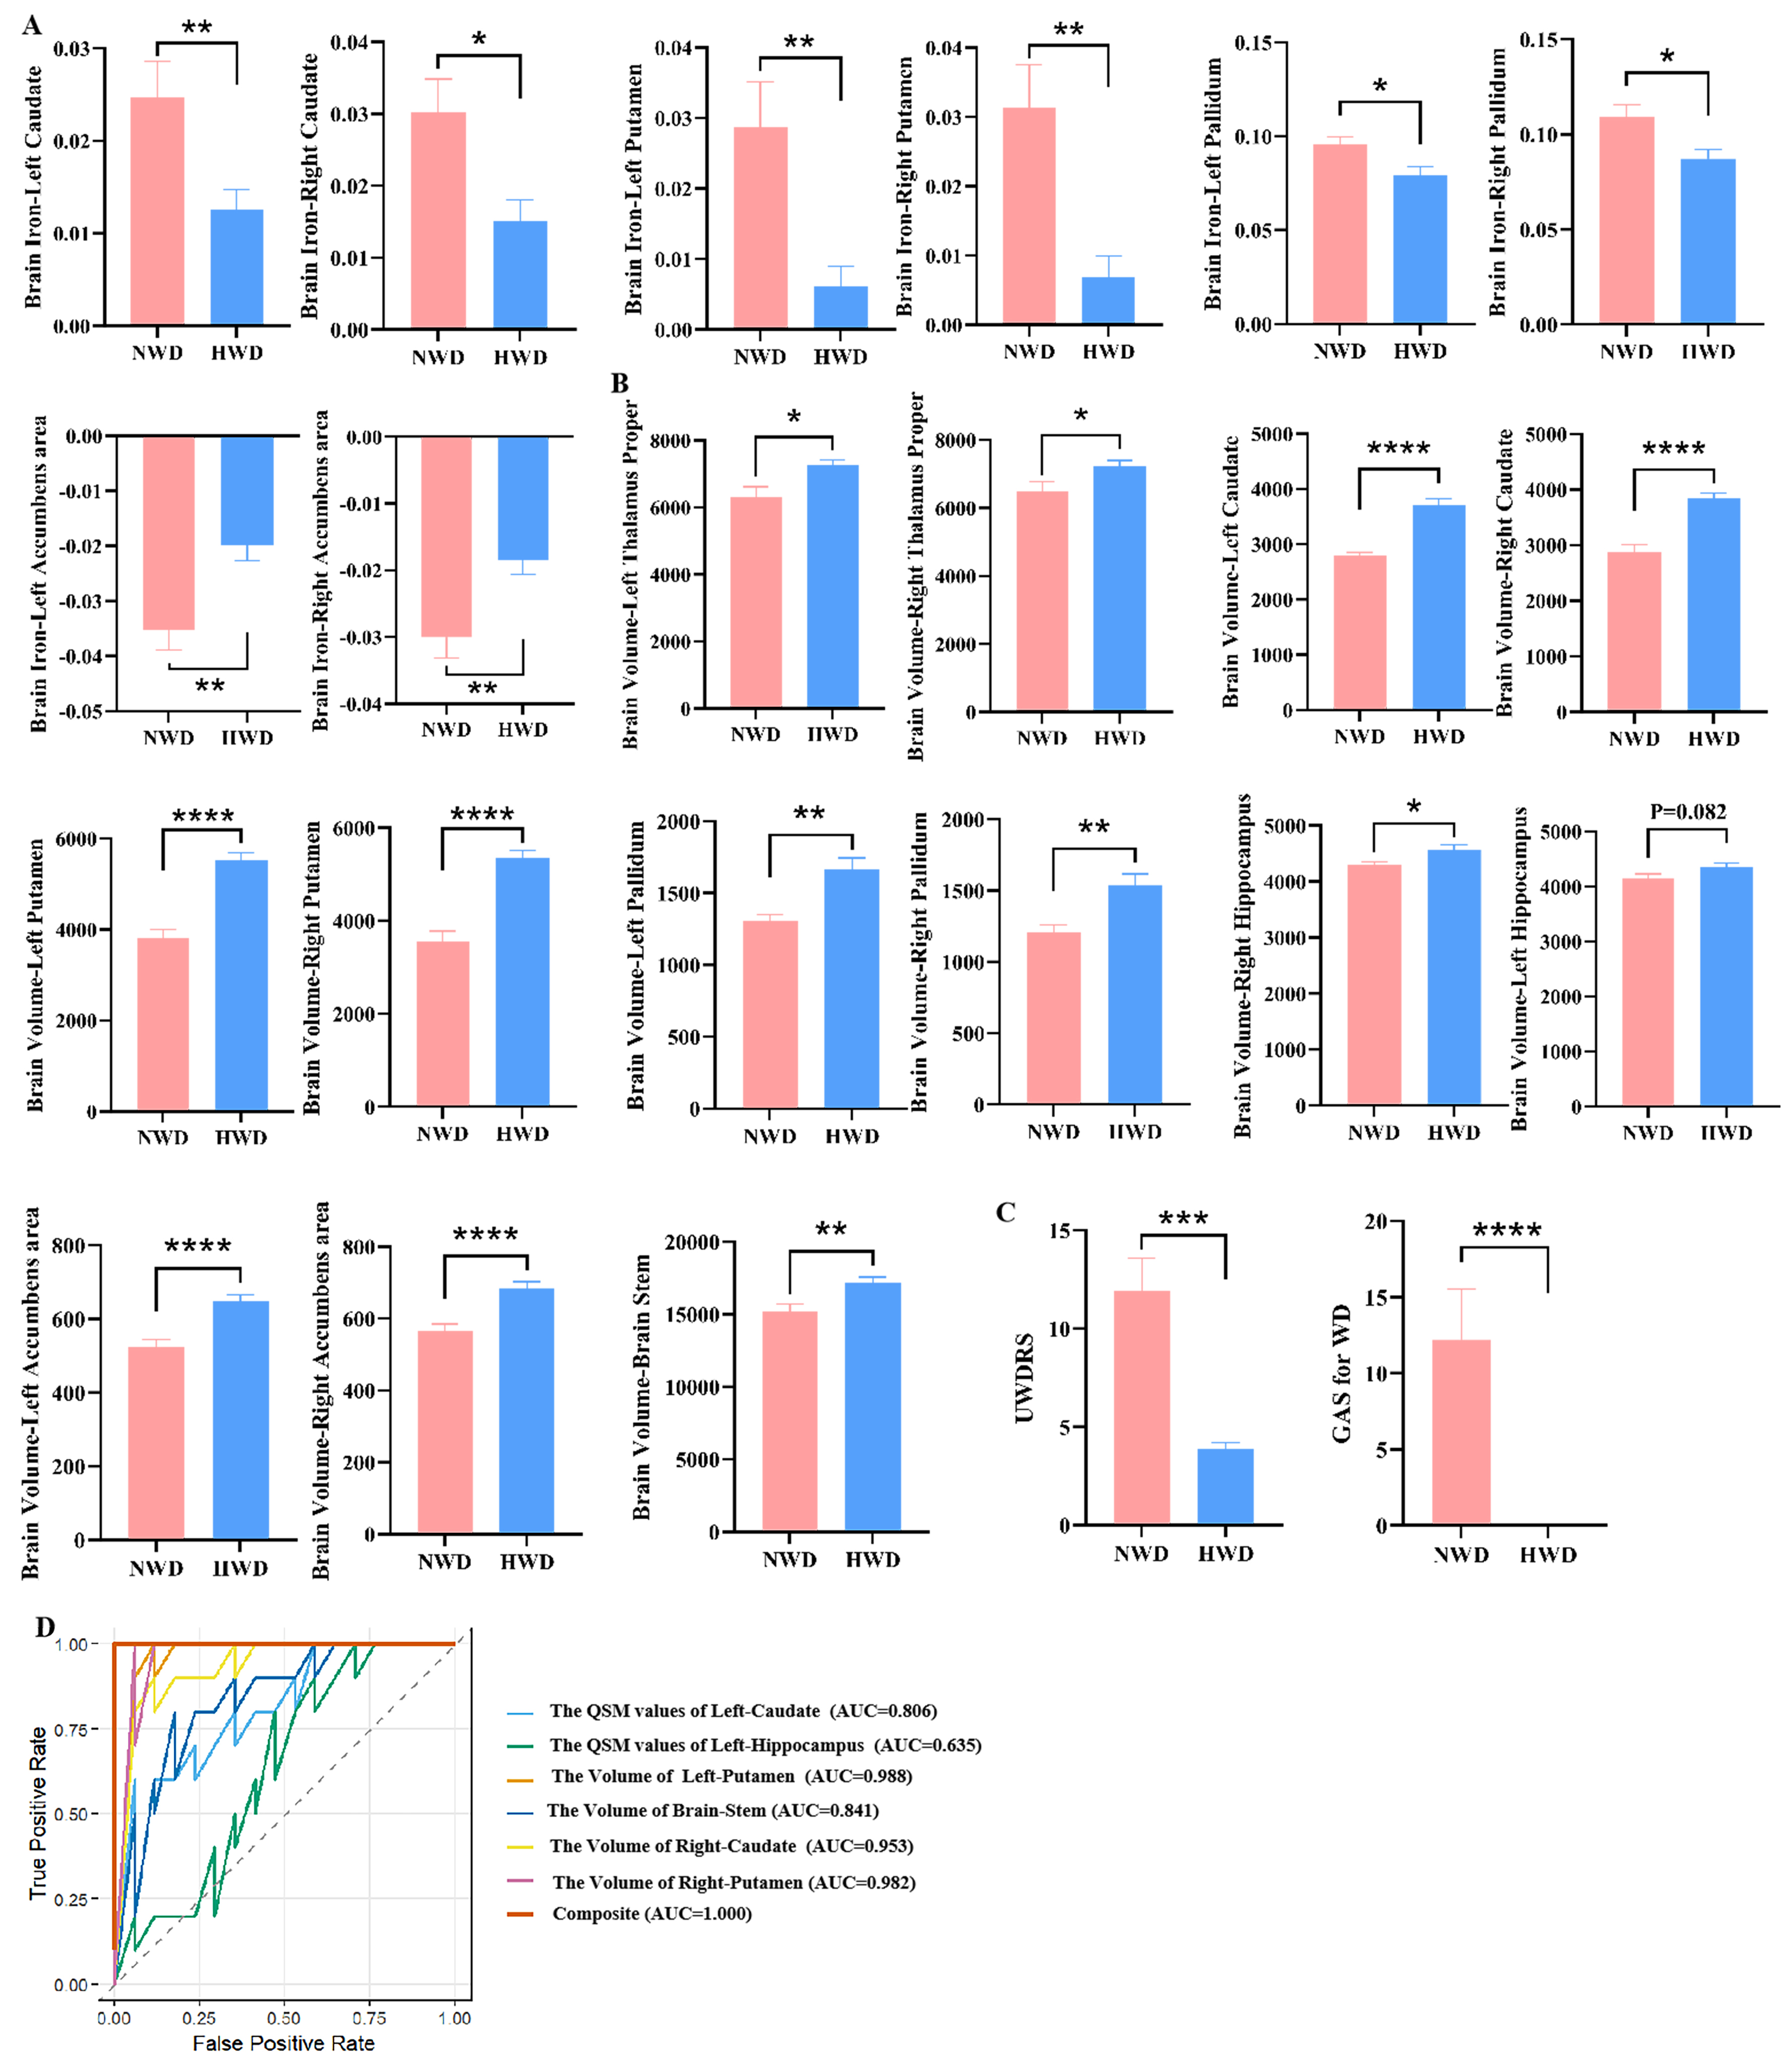
Figure 7. Comparison of neuroimaging and hepatic imaging characteristics of NWD and HWD. (A) Difference in brain QSM value in NWD and HWD. (B) Difference in Brain volumes in NWD and HWD. (C) Difference in UWDRS score and GAS for WD score in NWD and HWD. “Brain iron” indicates the assessment of iron deposition in specific brain regions using QSM. (D) ROC curves and AUC values illustrating the diagnostic performance of the selected variables using LASSO regression to distinguish between NWD and HWD. Results are expressed as mean ± SEM. ****P < 0.0001; ***P < 0.001; **P < 0.01; *P < 0.05. NWD: Neurological Wilson’s disease; HWD: hepatic Wilson’s disease; QSM: quantitative susceptibility mapping; UWDRS: Unified Wilson’s Disease Rating Scale; GAS: Global Assessment Scale; WD: Wilson’s disease; ROC: receiver operating characteristic; AUC: area under the curve; LASSO: Least Absolute Shrinkage and Selection Operator; SEM: standard error of measurement.
After LASSO regression analysis, six key indicators - namely, the QSM values of Left-Caudate and Left-Hippocampus, the volume of Left-Putamen, Brainstem, Right-Caudate and Right-Putamen - were identified. Based on the complete sample (NWD = 10, HWD = 17, total n = 27), the apparent AUC was 1.000 (95%CI: 1.000-1.000) when these six indicators were combined, indicating an excellent discrimination ability within the training set [Figure 7D]. Following 100 bootstrap internal validations, the corrected AUC decreased slightly to 0.920 (95%CI: 0.667-1.000).
DISCUSSION
In the present work, we conducted a multimodal neuroimaging and hepatic imaging analysis to systematically evaluate fat content, iron deposition, and brain atrophy in WD with distinct subtypes. We found that: (1) iron deposition in the liver can be detected and quantified by hepatic MRI; (2) liver iron quantification exhibits a positive correlation with UWDRS score in NWD; and (3) the extent of hepatic and cerebral iron deposition, as well as localized brain atrophy, can serve as predictive markers for the onset of WD, particularly in cases of NWD. To our knowledge, this is the first time to quantify iron deposition in the liver by hepatic MRI and assess its clinical significance for WD. Importantly, our data provide strong evidence for refining the clinical guidelines for WD, and we recommend conducting both hepatic and brain MRI for HWD and NWD.
The baseline features were similar between the NWD and HWD groups, suggesting that baseline data have no influence on subsequent analysis results. Neuro-psychiatric symptom scores in WD patients are commonly used to assess disease severity and treatment efficacy. Two widely adopted scoring scales for WD are UWDRS and GAS for WD. While GAS for WD is suitable for rapid clinical assessment, it lacks sufficient detail[15]. In contrast, UWDRS provides a more comprehensive and standardized evaluation of WD[16]. Our data demonstrated that both UWDRS and GAS for WD were significantly higher in the NWD group compared to the HWD group, indicating their utility in evaluating patient conditions and assisting in clinical classification. Although the GAS scores for WD and UWDRS scores demonstrate superior diagnostic performance compared to volume and QSM values of certain brain regions, MRI findings remain relatively objective. Furthermore, the assessment procedures for GAS and UWDRS scores are time-consuming and may be influenced by factors such as the patient’s educational level and cognitive comprehension. These clinical scales can only indicate a positive correlation between symptom severity and neurological or mental manifestations; they do not precisely reflect the extent of cerebral lesions, nor can they exclude alternative etiologies of neurological or psychiatric symptoms. In addition, current clinical guidelines recommend the use of brain MRI in evaluating brain injury severity. Therefore, enhancing the application of brain MRI in clinical practice is warranted.
However, fat deposition within the liver is not uniformly distributed. Studies investigating the effects of varying sizes and numbers of ROIs on measurement outcomes have revealed that the highest repeatability is achieved when maximal ROIs are placed in each Couinaud segment according to the Couinaud segmentation method[17]. Therefore, this study utilized the non-invasive reference index MRI-PDFF to measure the liver fat fraction across different Couinaud segments in WD patients and assessed liver iron content using R2* relaxation maps[17,19]. Compared with traditional liver pathological methods, this technique provides a non-invasive and convenient means to reflect the distribution of fat and iron content in distinct liver regions. The results indicate that the liver fat content of WD patients, particularly those with HWD, is slightly higher than that of the HCs in any Couinaud segment, though the difference is not statistically significant. We speculate that this outcome may be attributed to the limited sample size. Most of the patients included in this study had received treatment for many years, and their liver functions were relatively stable. Additionally, there was a lack of WD patients at different clinical stages (such as simple steatosis, liver fibrosis, and liver cirrhosis).
Mild iron deposition was detected in the livers of WD patients, particularly in the NWD subgroup. Notably, we demonstrated for the first time that the extent of liver iron deposition is positively correlated with the severity of neuropsychiatric symptoms in NWD. According to previous guidelines, liver MRI is recommended as a tool to assess the extent of liver fibrosis or cirrhosis and to rule out alternative liver diseases[1-4]. A typical liver MRI in WD often reveals multiple low-signal nodules on T2-weighted images interspersed with high-signal septa, creating a distinctive “honeycomb” imaging pattern. This characteristic change is observed in approximately 42% to 62% of patients. However, the sensitivity and specificity of this feature are limited, and its diagnostic value must be evaluated in conjunction with clinical findings[22]. Therefore, based on our new findings, it is recommended that all suspected WD patients, regardless of the presence or absence of hepatic or neurologic manifestations, undergo routine liver MRI examinations to determine the R2 value and assess the degree of iron deposition. This approach facilitates the diagnosis of WD, the assessment of disease severity, and subsequent treatment monitoring.
Brain MRI QSM values, which reflect brain iron accumulation, were significantly elevated in the WD group (bilateral caudate and accumbens area) compared to HCs, particularly in the NWD subgroup (bilateral caudate, putamen, pallidum, and accumbens area). These findings suggest that the severity of cerebral iron deposition is greater in patients with NWD. Therefore, QSM values obtained from brain MRI demonstrate potential diagnostic utility for WD, particularly in distinguishing NWD from other subtypes. A similar result was reported by Su et al., who showed that elevated QSM values in specific brain regions (putamen, pallidum, caudate, and thalamus) of WD patients reflect increased iron deposition[23]. However, they did not classify WD patients according to phenotypic subtypes such as NWD and HWD[10,24], indicating that NWD exhibited no significant or only minimal increase in QSM values within the caudate. The discrepancies observed across studies may be attributed to variations in disease severity and treatment duration among different patient populations. Remarkably, the present study controlled for such confounding factors by enrolling WD patients with comparable baseline characteristics, such as age at onset. In this context, our data are more reliable and credible.
Accumulating evidence indicates a pronounced interaction between copper and iron metabolism, particularly in WD[8,11]. Notably, the paramagnetism of intracellularly stored ferric ions (Fe3+) is significantly greater than that of copper ions (Cu+)[23,25,26]. Previous investigations[10] have established that the R2* value correlates with the iron concentration in the pallidum and putamen, rather than with the copper concentration. Moreover, the iron concentration in the subcortical nuclei is significantly higher than the copper concentration in NWD. In cases where patients present with more severe pathological damage to the putamen, there is an increase in iron concentration. Therefore, the increased susceptibility of the subcortical nuclei may be mainly attributed to excessive iron deposition. Our previous research[14] has revealed that the magnetic susceptibility values in the lenticular nucleus (especially the lateral part of the globus pallidum and the medial part of the putamen) of NWD are significantly increased. Furthermore, Shiono et al. revealed the abnormalities in iron metabolism-related parameters among male WD patients, with more pronounced alterations in those who were untreated[27]. Notably, evidence supports the efficacy of copper chelation therapy in ameliorating iron metabolic disturbances. Our findings further confirm the existence of iron metabolism dysfunction in WD. Importantly, we demonstrated for the first time that elevated QSM values from brain MRI can serve as an excellent biomarker for predicting the onset of neurological symptoms. Brain MRI not only allows assessment of regional iron deposition in the brain, thereby aiding in the differentiation of HWD from NWD, but also shows strong potential in predicting the transition from hepatic to neurological phenotypes.
Previous studies have confirmed that the extent of brain atrophy observed in brain MRI scans for patients with NWD is positively correlated with the severity of neurological clinical symptoms[28-32]. However, only a limited number of studies have evaluated the brain atrophy occurring in patients with HWD[33,34].
Currently, both the AASLD[1] and the 2022 Chinese[7] WD guidelines suggest that if neurological evaluations reveal abnormalities, brain imaging - preferably using MRI - should be considered to establish baseline status, rule out other potential causes, and assess disease severity while monitoring treatment response. However, for HWD, there is no mention of the need for routine brain MRI screening and follow-up. The European Association for the Study of the Liver (EASL) guidelines[14] recommend that all patients undergo brain MRI screening to detect abnormal lesions. However, they do not explicitly state whether brain MRI should be included as part of the routine follow-up for WD. Our data indicate that, regardless of WD subtype, baseline brain MRI should be routinely performed, and the timing and frequency of subsequent MRI scans should be determined according to the individual clinical conditions of patients. In light of these findings, it is essential to update current guidelines to incorporate standard brain MRI protocols (e.g., QSM values and volumetric measurements of specific brain regions) and liver MRI protocols (e.g., fat content quantification and iron deposition analysis). For patients with HWD and NWD, brain and liver MRI examinations should be performed before starting treatment to establish baseline data. Regular follow-up evaluations should be conducted throughout the treatment process to monitor therapeutic effects and prognosis, and to determine whether the condition is progressing.
This study has several limitations that should be acknowledged. First, the sample size is relatively small, and patients at different clinical and treatment stages were not included. Second, to more precisely identify imaging differences, patients with mixed-type WD were excluded from the current imaging analysis. Third, we did not conduct longitudinal imaging assessments during the treatment process to validate the observed outcomes. In future studies, longitudinal follow-up imaging evaluations should be conducted throughout the treatment course to explore causal relationships, predict or monitor disease progression, and assess the potential impact of continuous therapy on imaging biomarkers. Furthermore, multicenter collaboration and the inclusion of patients at different clinical stages and phenotypes are recommended.
In conclusion, our study underscores the value of multimodal neuro-hepatic imaging in unraveling the complexities of NWD and HWD. By correlating imaging findings with clinical subtypes, we found that iron deposition in the liver and brain, along with the degree of regional cerebral atrophy, may serve as a biomarker for identifying disease onset and evaluating therapeutic effectiveness in WD, particularly in NWD. This approach can facilitate a more precise and personalized strategy for the diagnosis, management, and monitoring of this copper disorder.
DECLARATIONS
Acknowledgments
The authors acknowledge that the Graphical Abstract was created using Biorender (https://biorender.com).
Authors’ contributions
Conceived and designed the study: Liang C, Bai L, Zheng S
interpreted the results and generated the figures and tables: Chen L, Bai L, Su D
wrote the manuscript: Liang C, Bai L
collected and performed the imaging analysis: Hou W, Zhao J, Su D, Feng T
provided imaging analysis support: Su D, Song W
provided analysis support and supervised the study: Liu H
obtained funding and supervised the overall execution of this work: Liang C, Bai L, Zheng S.
All authors read and approved the manuscript.
Availability of data and materials
The dataset generated during the current study is available from the corresponding author upon reasonable request.
Financial support and sponsorship
This work was supported by grants from the Beijing Municipal Administration of Hospitals Clinical Medicine Development Special Funding Support (ZYLX202125), the High-Level Public Health Technical Talents Program of the Beijing Municipal Health Commission (Academic Leader-02-14), the National Key Research and Development Program of the Ministry of Science and Technology (2022YFC2304400), the Cross-Cooperation Project of the Beijing Science and Technology New Star Program (20230484455), the Beijing Municipal Natural Science Foundation (7222093 and 7222094), and the 2025 Beijing Jishuitan Hospital Youth Fund (QN202515), and the Beijing Hospitals Authority’s Ascent Plan (DFL20241701).
Conflicts of interest
All authors declared that there are no conflicts of interest.
Ethical approval and consent to participate
This study was conducted in accordance with the Declaration of Helsinki and approved by the Ethics Committee of Beijing You’An Hospital, Capital Medical University, Beijing, China (Ethical Approval Number: LL-2019-029-K). All participants provided written informed consent.
Consent for publication
Not applicable.
Copyright
© The Author(s) 2025.
Supplementary Materials
REFERENCES
1. Schilsky ML, Roberts EA, Bronstein JM, et al. A multidisciplinary approach to the diagnosis and management of Wilson disease: 2022 Practice Guidance on Wilson disease from the American Association for the Study of Liver Diseases. Hepatology. 2025;82:E41-90.
2. Nagral A, Sarma MS, Matthai J, et al. Wilson’s disease: Clinical Practice Guidelines of the Indian National Association for Study of the Liver, the Indian Society of Pediatric Gastroenterology, Hepatology and Nutrition, and the Movement Disorders Society of India. J Clin Exp Hepatol. 2019;9:74-98.
3. Association for Study of Liver. EASL Clinical Practice Guidelines: Wilson’s disease. J Hepatol. 2012;56:671-85.
4. Roberts EA, Schilsky ML; American Association for Study of Liver Diseases (AASLD). Diagnosis and treatment of Wilson disease: an update. Hepatology. 2008;47:2089-111.
6. Alqahtani SA, Chami R, Abuquteish D, et al. Hepatic ultrastructural features distinguish paediatric Wilson disease from NAFLD and autoimmune hepatitis. Liver Int. 2022;42:2482-91.
7. Inherited Metabolic Liver Disease Collaboration Group, Chinese Society of Hepatology, Chinese Medical Association. [Guidelines for the diagnosis and treatment of hepatolenticular degeneration (2022 edition)]. Zhonghua Gan Zang Bing Za Zhi. 2022;30:9-20.
8. Doguer C, Ha J HandCollins J F. Intersection of iron and copper metabolism in the mammalian intestine and liver. Compr Physiol. 2018;8:1433-61.
9. Pak K, Ordway S, Sadowski B, Canevari M, Torres D. Wilson’s disease and iron overload: pathophysiology and therapeutic implications. Clin Liver Dis. 2021;17:61-6.
10. Dusek P, Bahn E, Litwin T, et al. Brain iron accumulation in Wilson disease: a post mortem 7 Tesla MRI - histopathological study. Neuropathol Appl Neurobiol. 2017;43:514-32.
11. Teschke R, Eickhoff A. Wilson disease: copper-mediated cuproptosis, iron-related ferroptosis, and clinical highlights, with comprehensive and critical analysis update. Int J Mol Sci. 2024;25:4753.
12. Su D, Zhang Z, Zhang Z, et al. Distinctive pattern of metal deposition in neurologic Wilson disease: insights from 7T susceptibility-weighted imaging. Neurology. 2024;102:e209478.
13. Ferenci P, Caca K, Loudianos G, et al. Diagnosis and phenotypic classification of Wilson disease. Liver Int. 2003;23:139-42.
14. European Association for the Study of the Liver. EASL-ERN Clinical Practice Guidelines on Wilson’s disease. J Hepatol. ;2025:690-728.
15. Aggarwal A, Aggarwal N, Nagral A, Jankharia G, Bhatt M. A novel Global Assessment Scale for Wilson’s Disease (GAS for WD). Mov Disord. 2009;24:509-18.
16. Czlonkowska A, Tarnacka B, Moller J C, et al. Unified Wilson’s Disease Rating Scale - a proposal for the neurological scoring of Wilson’s disease patients. Neurol Neurochir Pol. 2007;41:1-12.
17. Campo CA, Hernando D, Schubert T, Bookwalter CA, Pay AJV, Reeder SB. Standardized approach for ROI-based measurements of proton density fat fraction and R2* in the liver. AJR Am J Roentgenol. 2017;209:592-603.
18. Verlhac S, Morel M, Bernaudin F, Béchet S, Jung C, Vasile M. Liver iron overload assessment by MRI R2* relaxometry in highly transfused pediatric patients: an agreement and reproducibility study. Diagn Interv Imaging. 2015;96:259-64.
19. Bannas P, Kramer H, Hernando D, et al. Quantitative magnetic resonance imaging of hepatic steatosis: validation in ex vivo human livers. Hepatology. 2015;62:1444-55.
21. Acosta-Cabronero J, Milovic C, Mattern H, Tejos C, Speck O, Callaghan MF. A robust multi-scale approach to quantitative susceptibility mapping. Neuroimage. 2018;183:7-24.
22. Dohan A, Vargas O, Dautry R, et al. MR imaging features of focal liver lesions in Wilson disease. Abdom Radiol. 2016;41:1811-24.
23. Su D, Zhang Z, Zhang Z, et al. Microstructural and functional impairment of the basal ganglia in Wilson’s disease: a multimodal neuroimaging study. Front Neurosci. 2023;17:1146644.
24. Fritzsch D, Reiss-Zimmermann M, Trampel R, Turner R, Hoffmann KT, Schäfer A. Seven-tesla magnetic resonance imaging in Wilson disease using quantitative susceptibility mapping for measurement of copper accumulation. Invest Radiol. 2014;49:299-306.
25. Dlouhy AC, Outten CE. The iron metallome in eukaryotic organisms. Met Ions Life Sci. 2013;12:241-78.
26. Scheiber IF, Bruha Rand Dusek P. Pathogenesis of Wilson disease. Handb Clin Neurol. 2017;142:43-55.
27. Shiono Y, Wakusawa S, Hayashi H, et al. Iron accumulation in the liver of male patients with Wilson’s disease. Am J Gastroenterol. 2001;96:3147-51.
28. Shribman S, Bocchetta M, Sudre CH, et al. Neuroimaging correlates of brain injury in Wilson’s disease: a multimodal, whole-brain MRI study. Brain. 2022;145:263-75.
29. Du J, Bydder GM. Brain atrophy is a better biomarker than susceptibility for evaluating clinical severity in Wilson disease. Radiology. 2021;299:673-4.
30. Dusek P, Lescinskij A, Ruzicka F, et al. Associations of brain atrophy and cerebral iron accumulation at MRI with clinical severity in Wilson disease. Radiology. 2021;299:662-72.
31. Jing XZ, Yuan XZ, Li GY, et al. Increased magnetic susceptibility in the deep gray matter nuclei of Wilson’s disease: have we been ignoring atrophy? Front Neurosci. 2022;16:794375.
32. Smolinski L, Ziemssen T, Akgun K, et al. Brain atrophy is substantially accelerated in neurological Wilson’s disease: a longitudinal study. Mov Disord. 2022;37:2446-51.
33. Rahimi P, Mareček S, Brůha R, et al. Brain morphometry in hepatic Wilson disease patients. J Inherit Metab Dis. 2025;48:e12814.
Cite This Article
How to Cite
Download Citation
Export Citation File:
Type of Import
Tips on Downloading Citation
Citation Manager File Format
Type of Import
Direct Import: When the Direct Import option is selected (the default state), a dialogue box will give you the option to Save or Open the downloaded citation data. Choosing Open will either launch your citation manager or give you a choice of applications with which to use the metadata. The Save option saves the file locally for later use.
Indirect Import: When the Indirect Import option is selected, the metadata is displayed and may be copied and pasted as needed.
About This Article
Special Topic
Copyright

Data & Comments
Data
0


Comments
Comments must be written in English. Spam, offensive content, impersonation, and private information will not be permitted. If any comment is reported and identified as inappropriate content by OAE staff, the comment will be removed without notice. If you have any queries or need any help, please contact us at [email protected].