


fig2
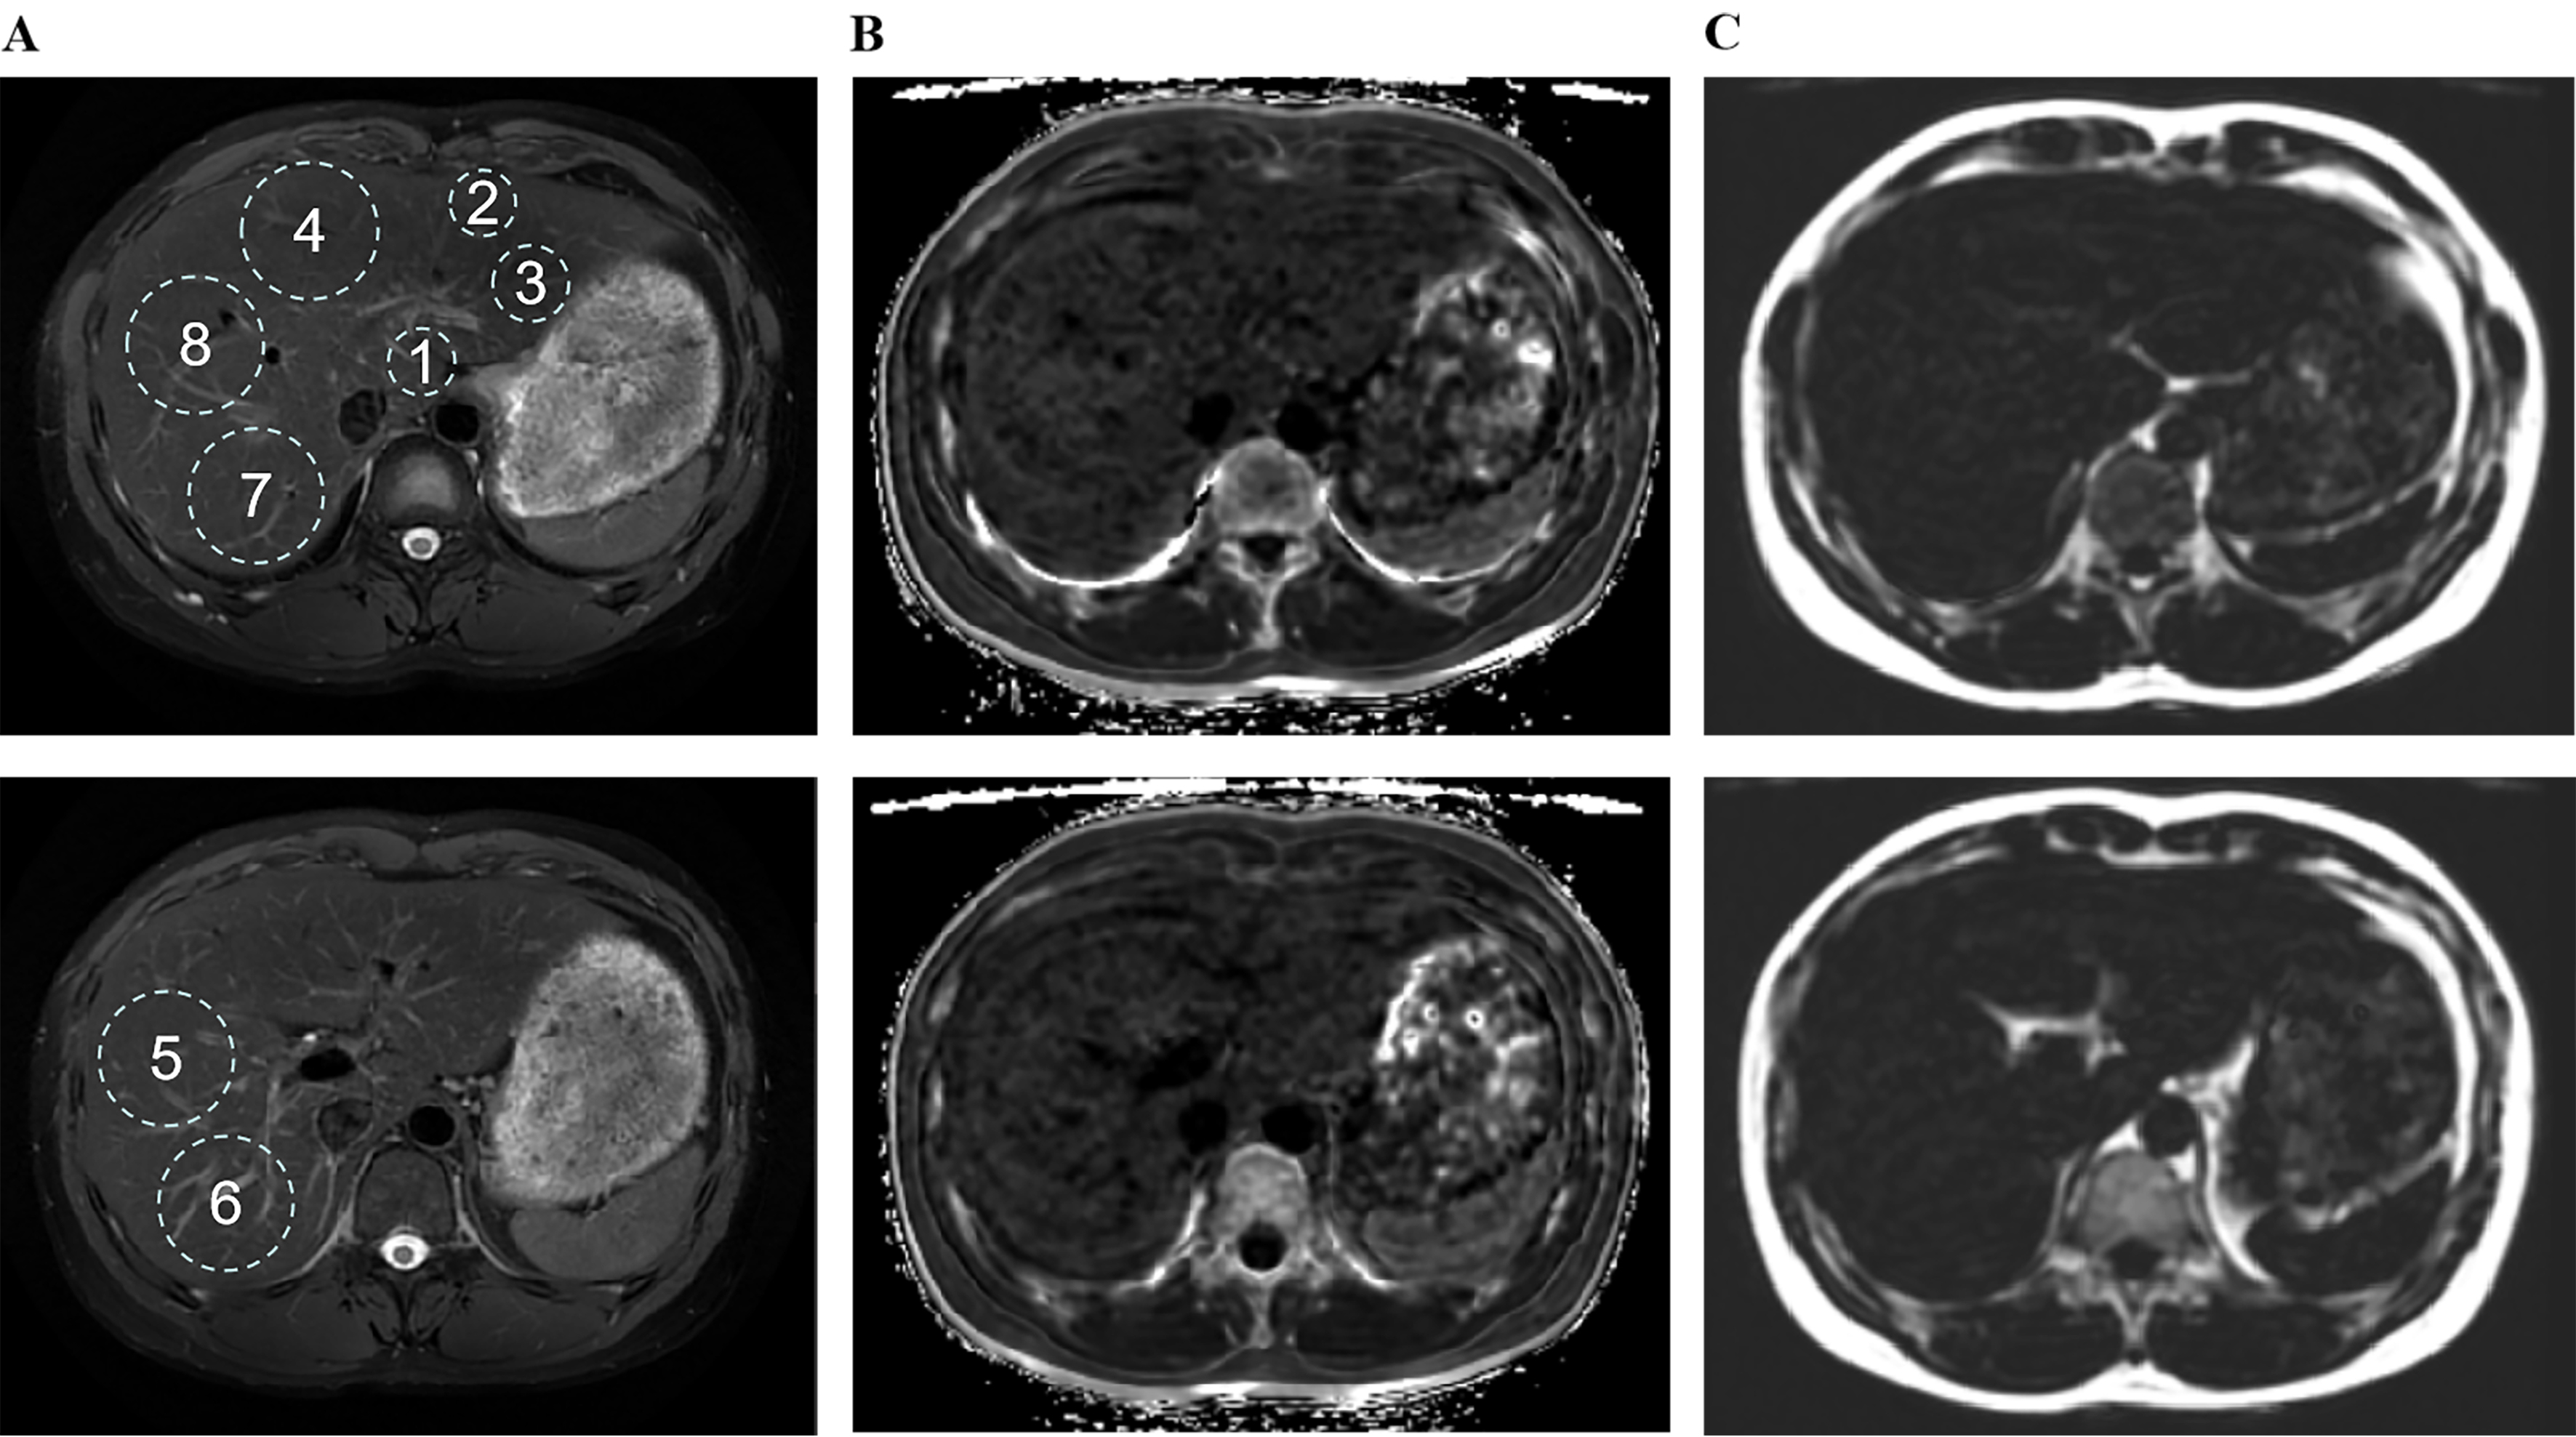
Figure 2. Size, location, and quantity of ROIs numbered 1 to 8 in liver magnetic resonance imaging, using Wilson’s disease patients as a representative example. ROIs for paradigms 1-8 were placed in the largest fit, respectively. (A) RTr-Ax-T2-fs-Prop is utilized to identify anatomical structures; (B) R2 star-BH-IDEAL-IQ is employed for the quantification of iron; (C) FatFrac-BH-IDEAL-IQ is applied for the quantification of fat. ROIs: Region of interest; RTr-Ax-T2-fs-Prop: (specific MRI sequence, name retained from original); R2: the rate of signal decay caused by the combined effects of intrinsic tissue properties and magnetic field inhomogeneities, and were generated to quantify iron deposition; BH: breath hold; IDEAL-IQ: iterative decomposition of water and fat with echo asymmetry and least-squares estimation-iron quantification; FatFrac: fat fraction.


