


fig7
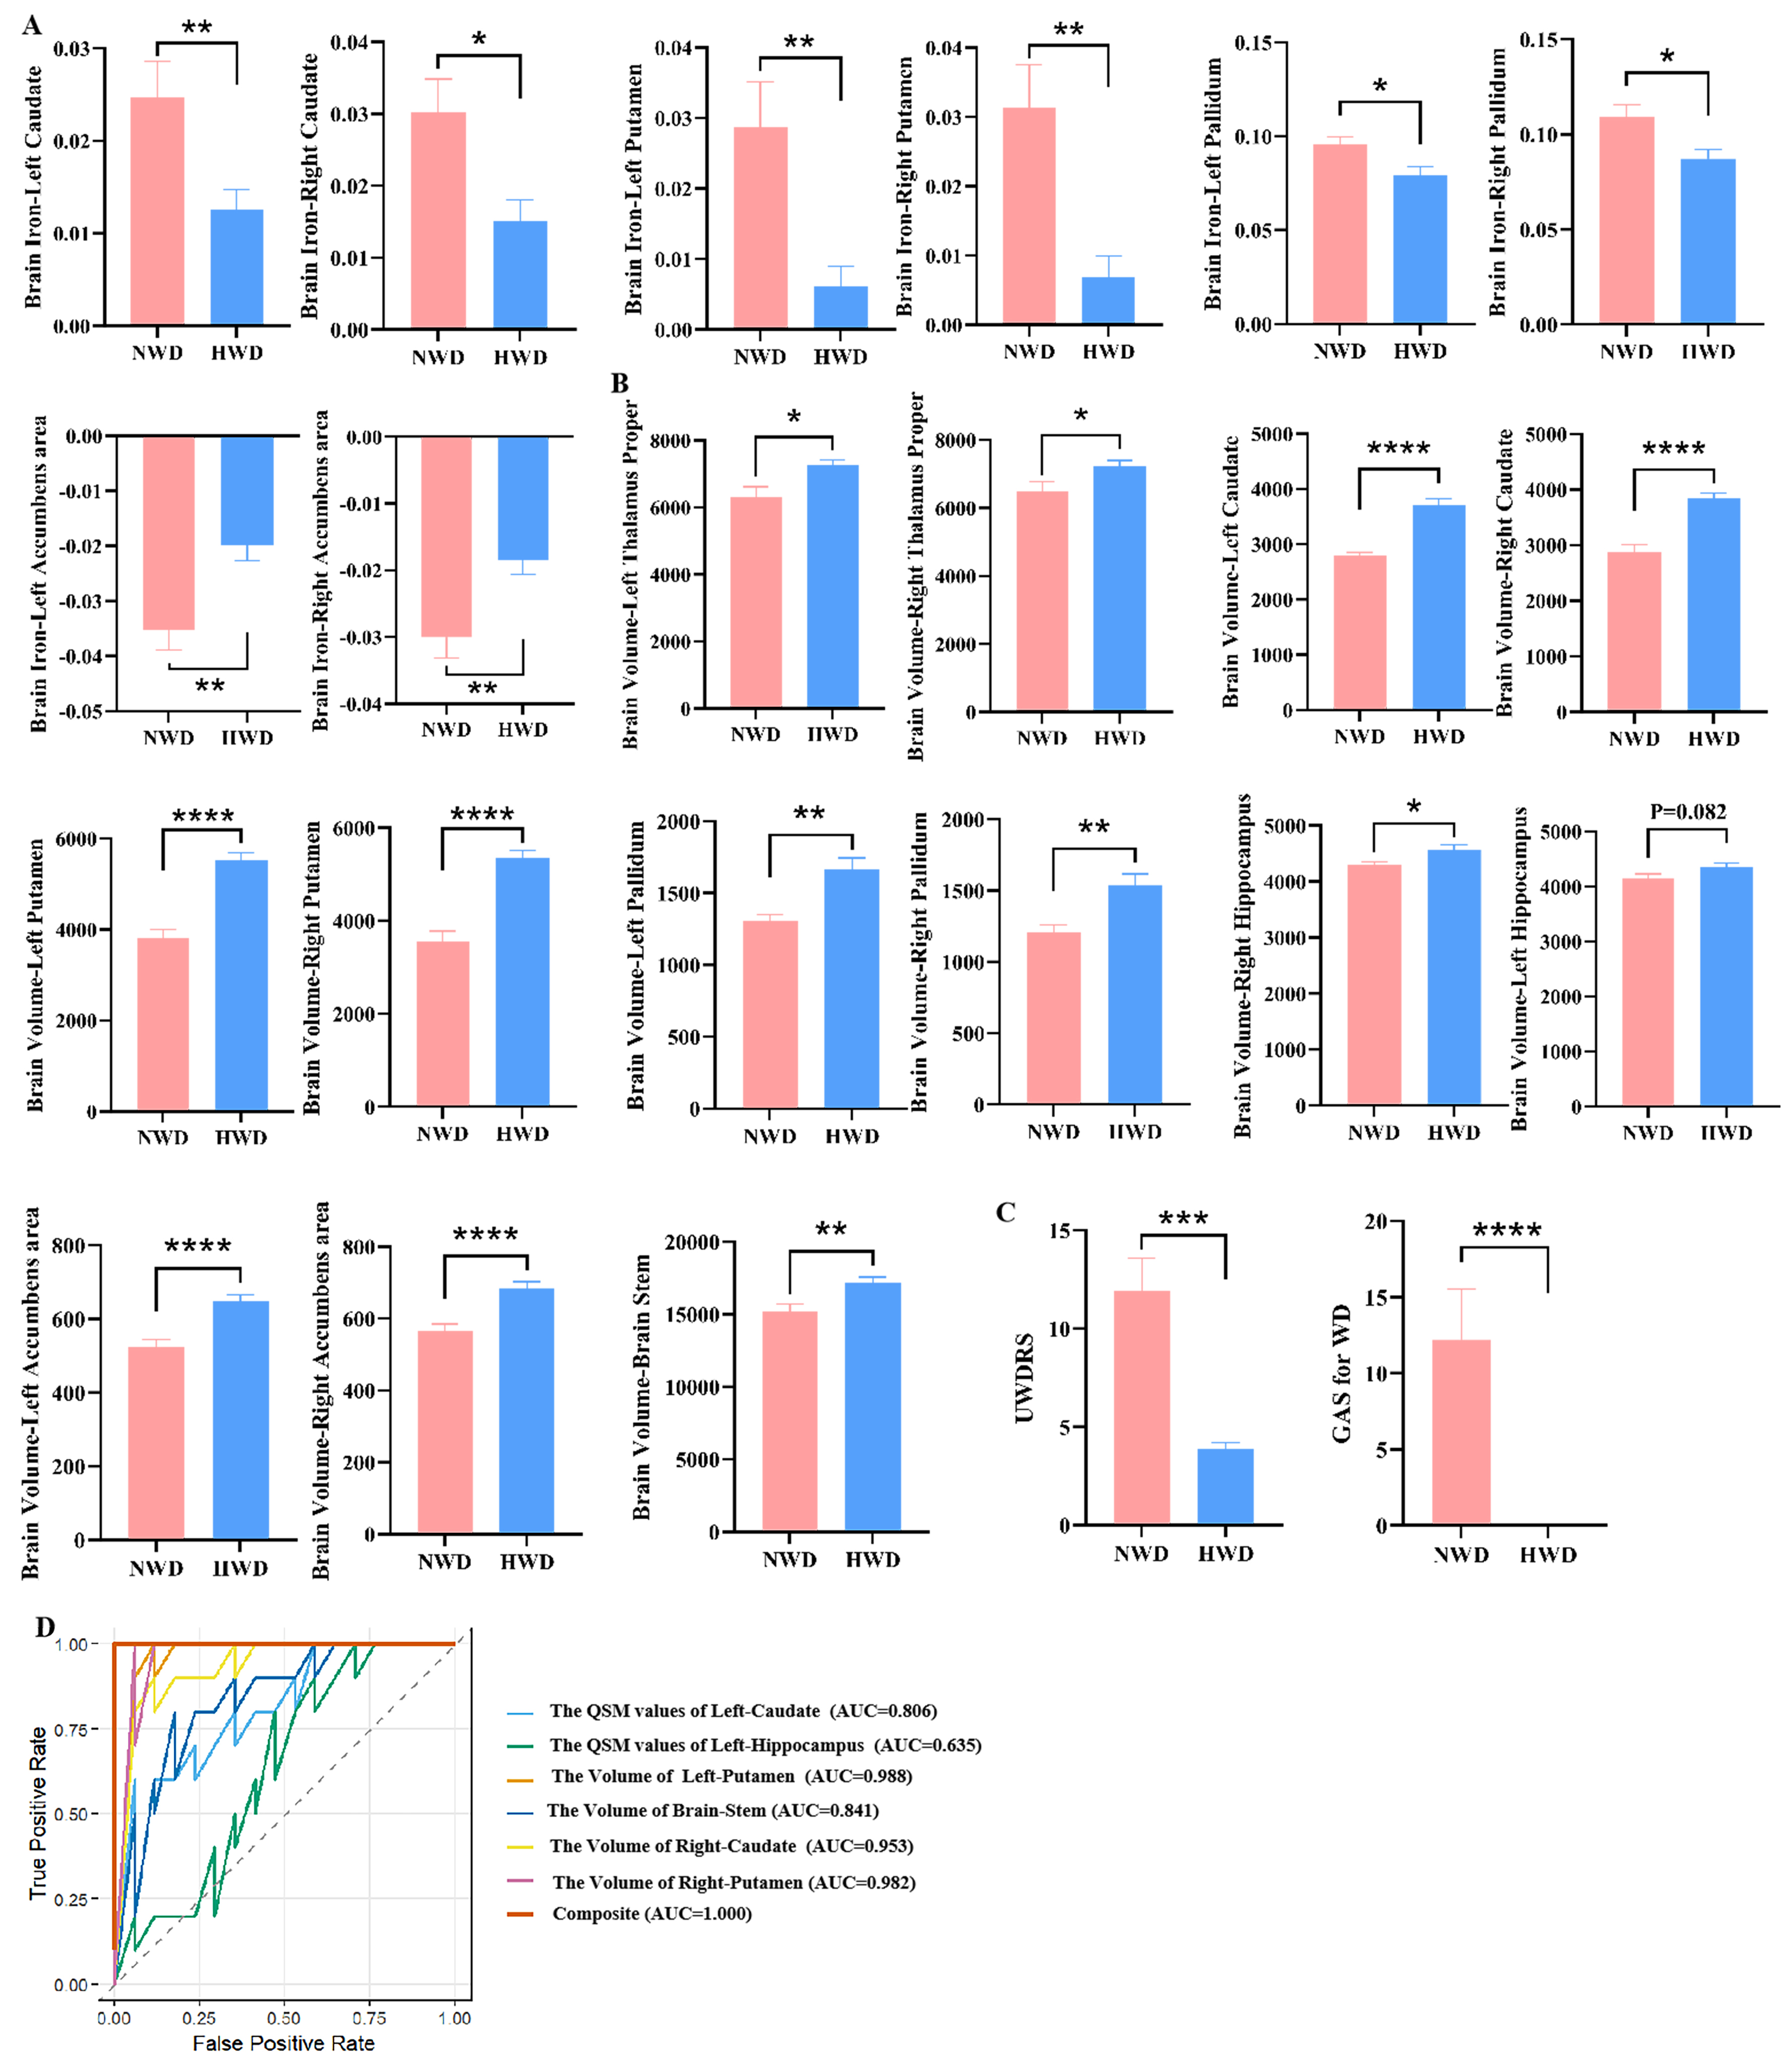
Figure 7. Comparison of neuroimaging and hepatic imaging characteristics of NWD and HWD. (A) Difference in brain QSM value in NWD and HWD. (B) Difference in Brain volumes in NWD and HWD. (C) Difference in UWDRS score and GAS for WD score in NWD and HWD. “Brain iron” indicates the assessment of iron deposition in specific brain regions using QSM. (D) ROC curves and AUC values illustrating the diagnostic performance of the selected variables using LASSO regression to distinguish between NWD and HWD. Results are expressed as mean ± SEM. ****P < 0.0001; ***P < 0.001; **P < 0.01; *P < 0.05. NWD: Neurological Wilson’s disease; HWD: hepatic Wilson’s disease; QSM: quantitative susceptibility mapping; UWDRS: Unified Wilson’s Disease Rating Scale; GAS: Global Assessment Scale; WD: Wilson’s disease; ROC: receiver operating characteristic; AUC: area under the curve; LASSO: Least Absolute Shrinkage and Selection Operator; SEM: standard error of measurement.


