fig4

A multimodal neuroimaging and hepatic imaging analysis for hepatic-type and neurological-type Wilson’s disease

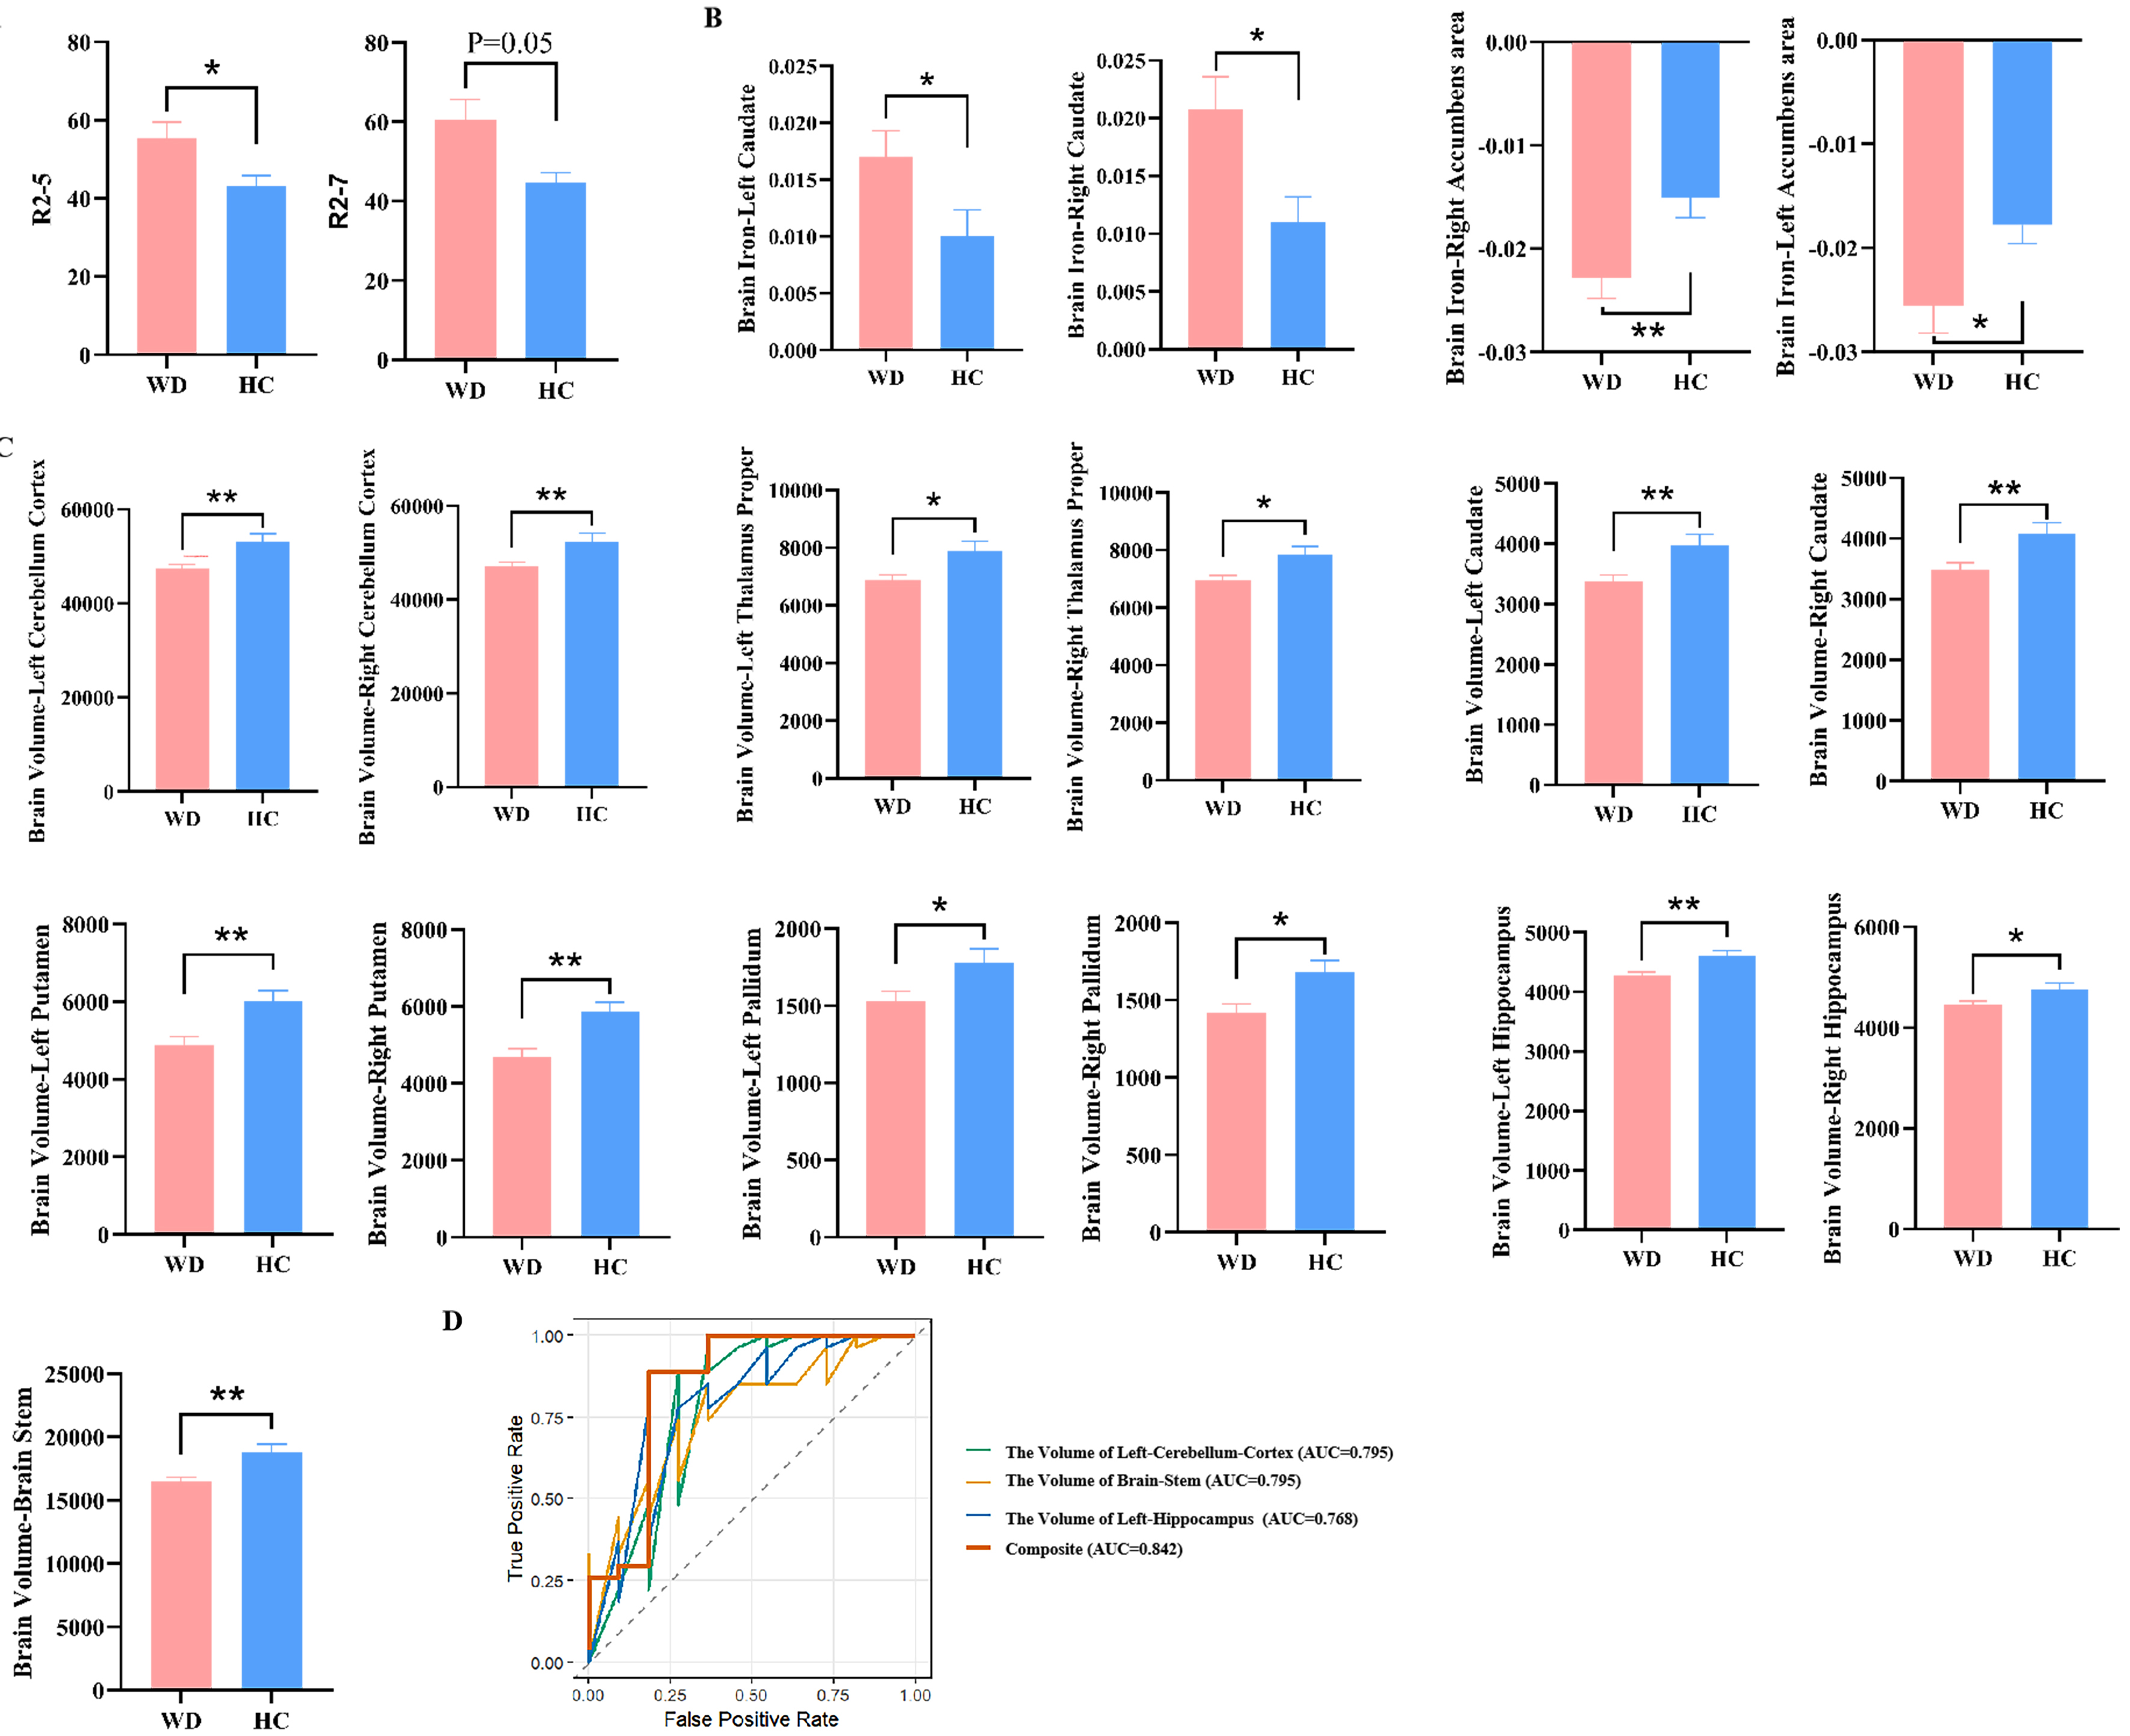
Figure 4. Comparison of neuroimaging and hepatic imaging characteristics of WD and HCs. (A) Difference in liver R2 values between WD and HC; (B) Difference in brain QSM value in WD and HC; (C) Difference in Brain volumes in WD and HC. “R2” denotes the quantified iron deposition measured within the ROIs in the eight Couinaud liver segments. “Brain iron” indicates the assessment of iron deposition in specific brain regions using QSM; (D) The ROC curves and AUC values illustrating the diagnostic performance of the selected variables using LASSO regression to distinguish between WD and HCs. Results are expressed as mean ± SEM. ****P < 0.0001; ***P < 0.001; **P < 0.01; *P < 0.05. WD: Wilson’s disease; HCs: healthy controls; QSM: quantitative susceptibility mapping; ROIs: regions of interest; SEM: standard error of measurement; ROC: receiver operating characteristic; AUC: area under the curve; LASSO: Least Absolute Shrinkage and Selection Operator.

Metabolism and Target Organ Damage
ISSN 2769-6375 (Online)
Follow Us

Portico

All published articles are preserved here permanently:

https://www.portico.org/publishers/oae/

Portico

All published articles are preserved here permanently:

https://www.portico.org/publishers/oae/