


fig5
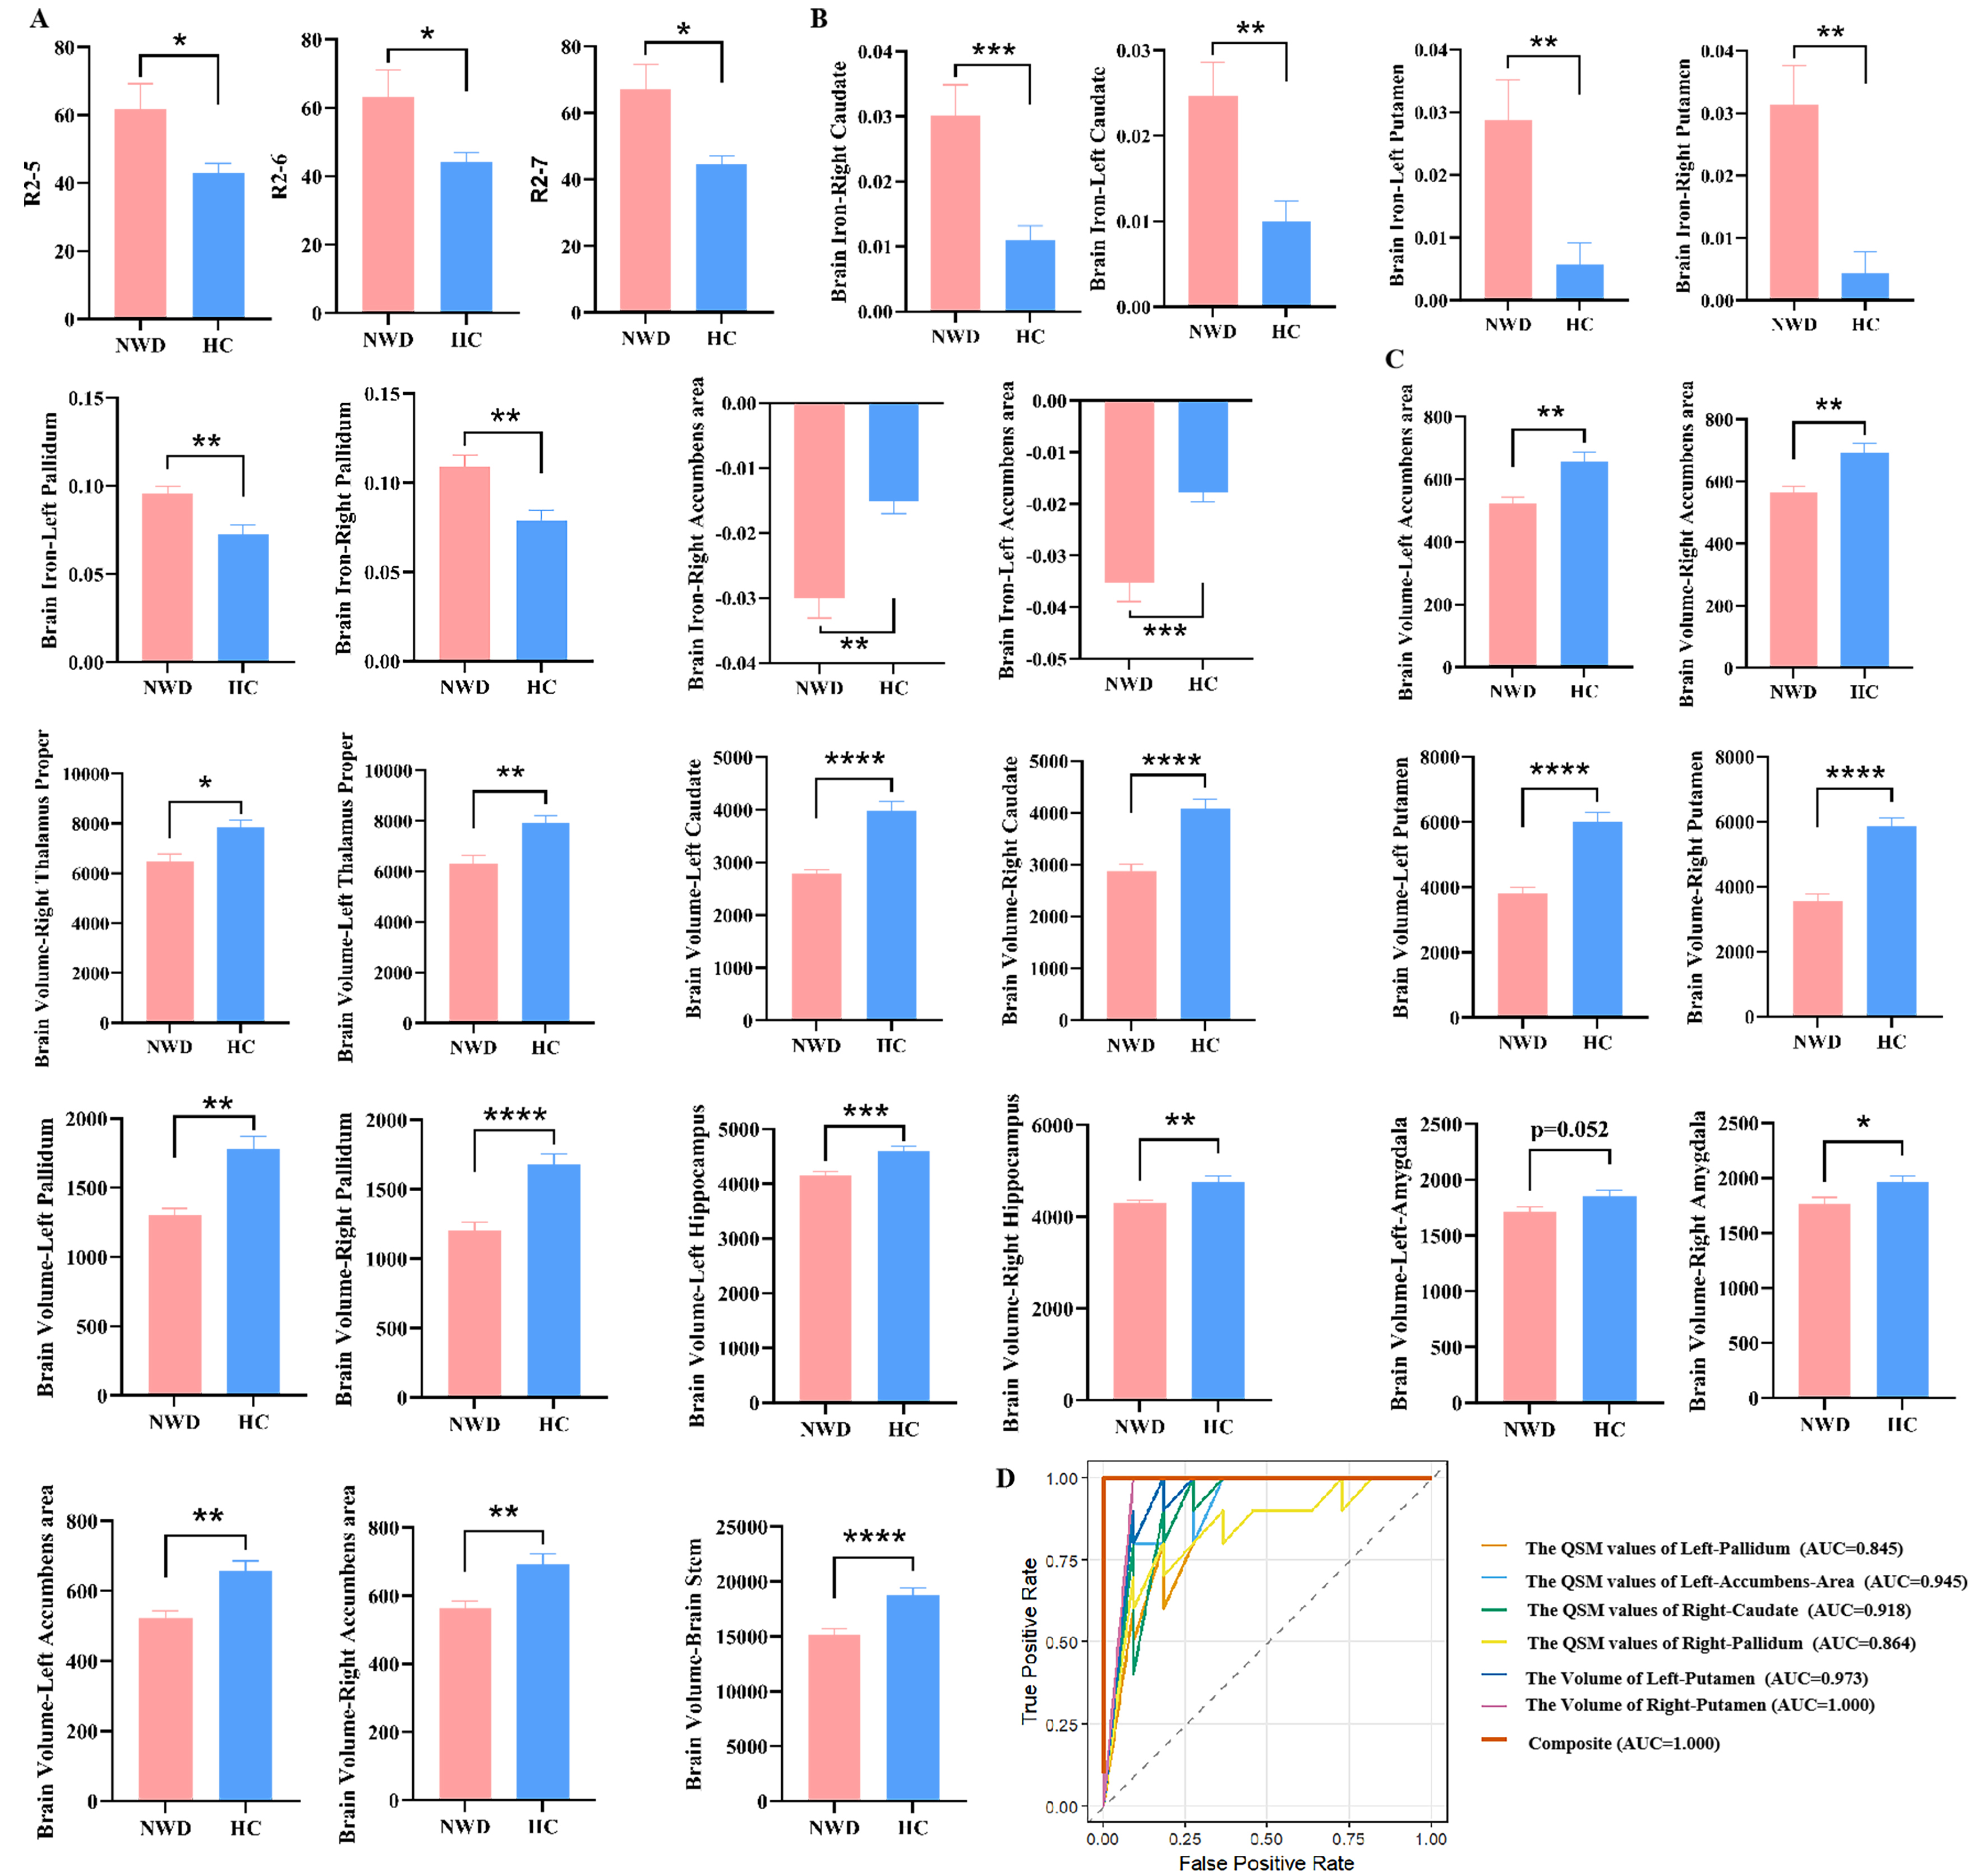
Figure 5. Comparison of neuroimaging and hepatic imaging characteristics of NWD and HCs. (A) Difference in liver R2 values between NWD and HC; (B) Difference in the brain QSM value in NWD and HC; (C) Difference in Brain volumes in NWD and HC. “R2” denotes the quantified iron deposition measured within the ROIs in the eight Couinaud liver segments. “Brain iron” indicates the assessment of iron deposition in specific brain regions using QSM; (D) ROC curves and AUC values illustrating the diagnostic performance of the selected variables using LASSO regression to distinguish between NWD and HCs. Results are expressed as mean ± SEM. ****P < 0.0001; ***P < 0.001; **P < 0.01; *P < 0.05. NWD: Neurological Wilson’s disease; HCs: healthy controls; QSM: quantitative susceptibility mapping; ROIs: regions of interest; ROC: receiver operating characteristic; AUC: area under the curve; LASSO: Least Absolute Shrinkage and Selection Operator; SEM: standard error of measurement.


