


fig6
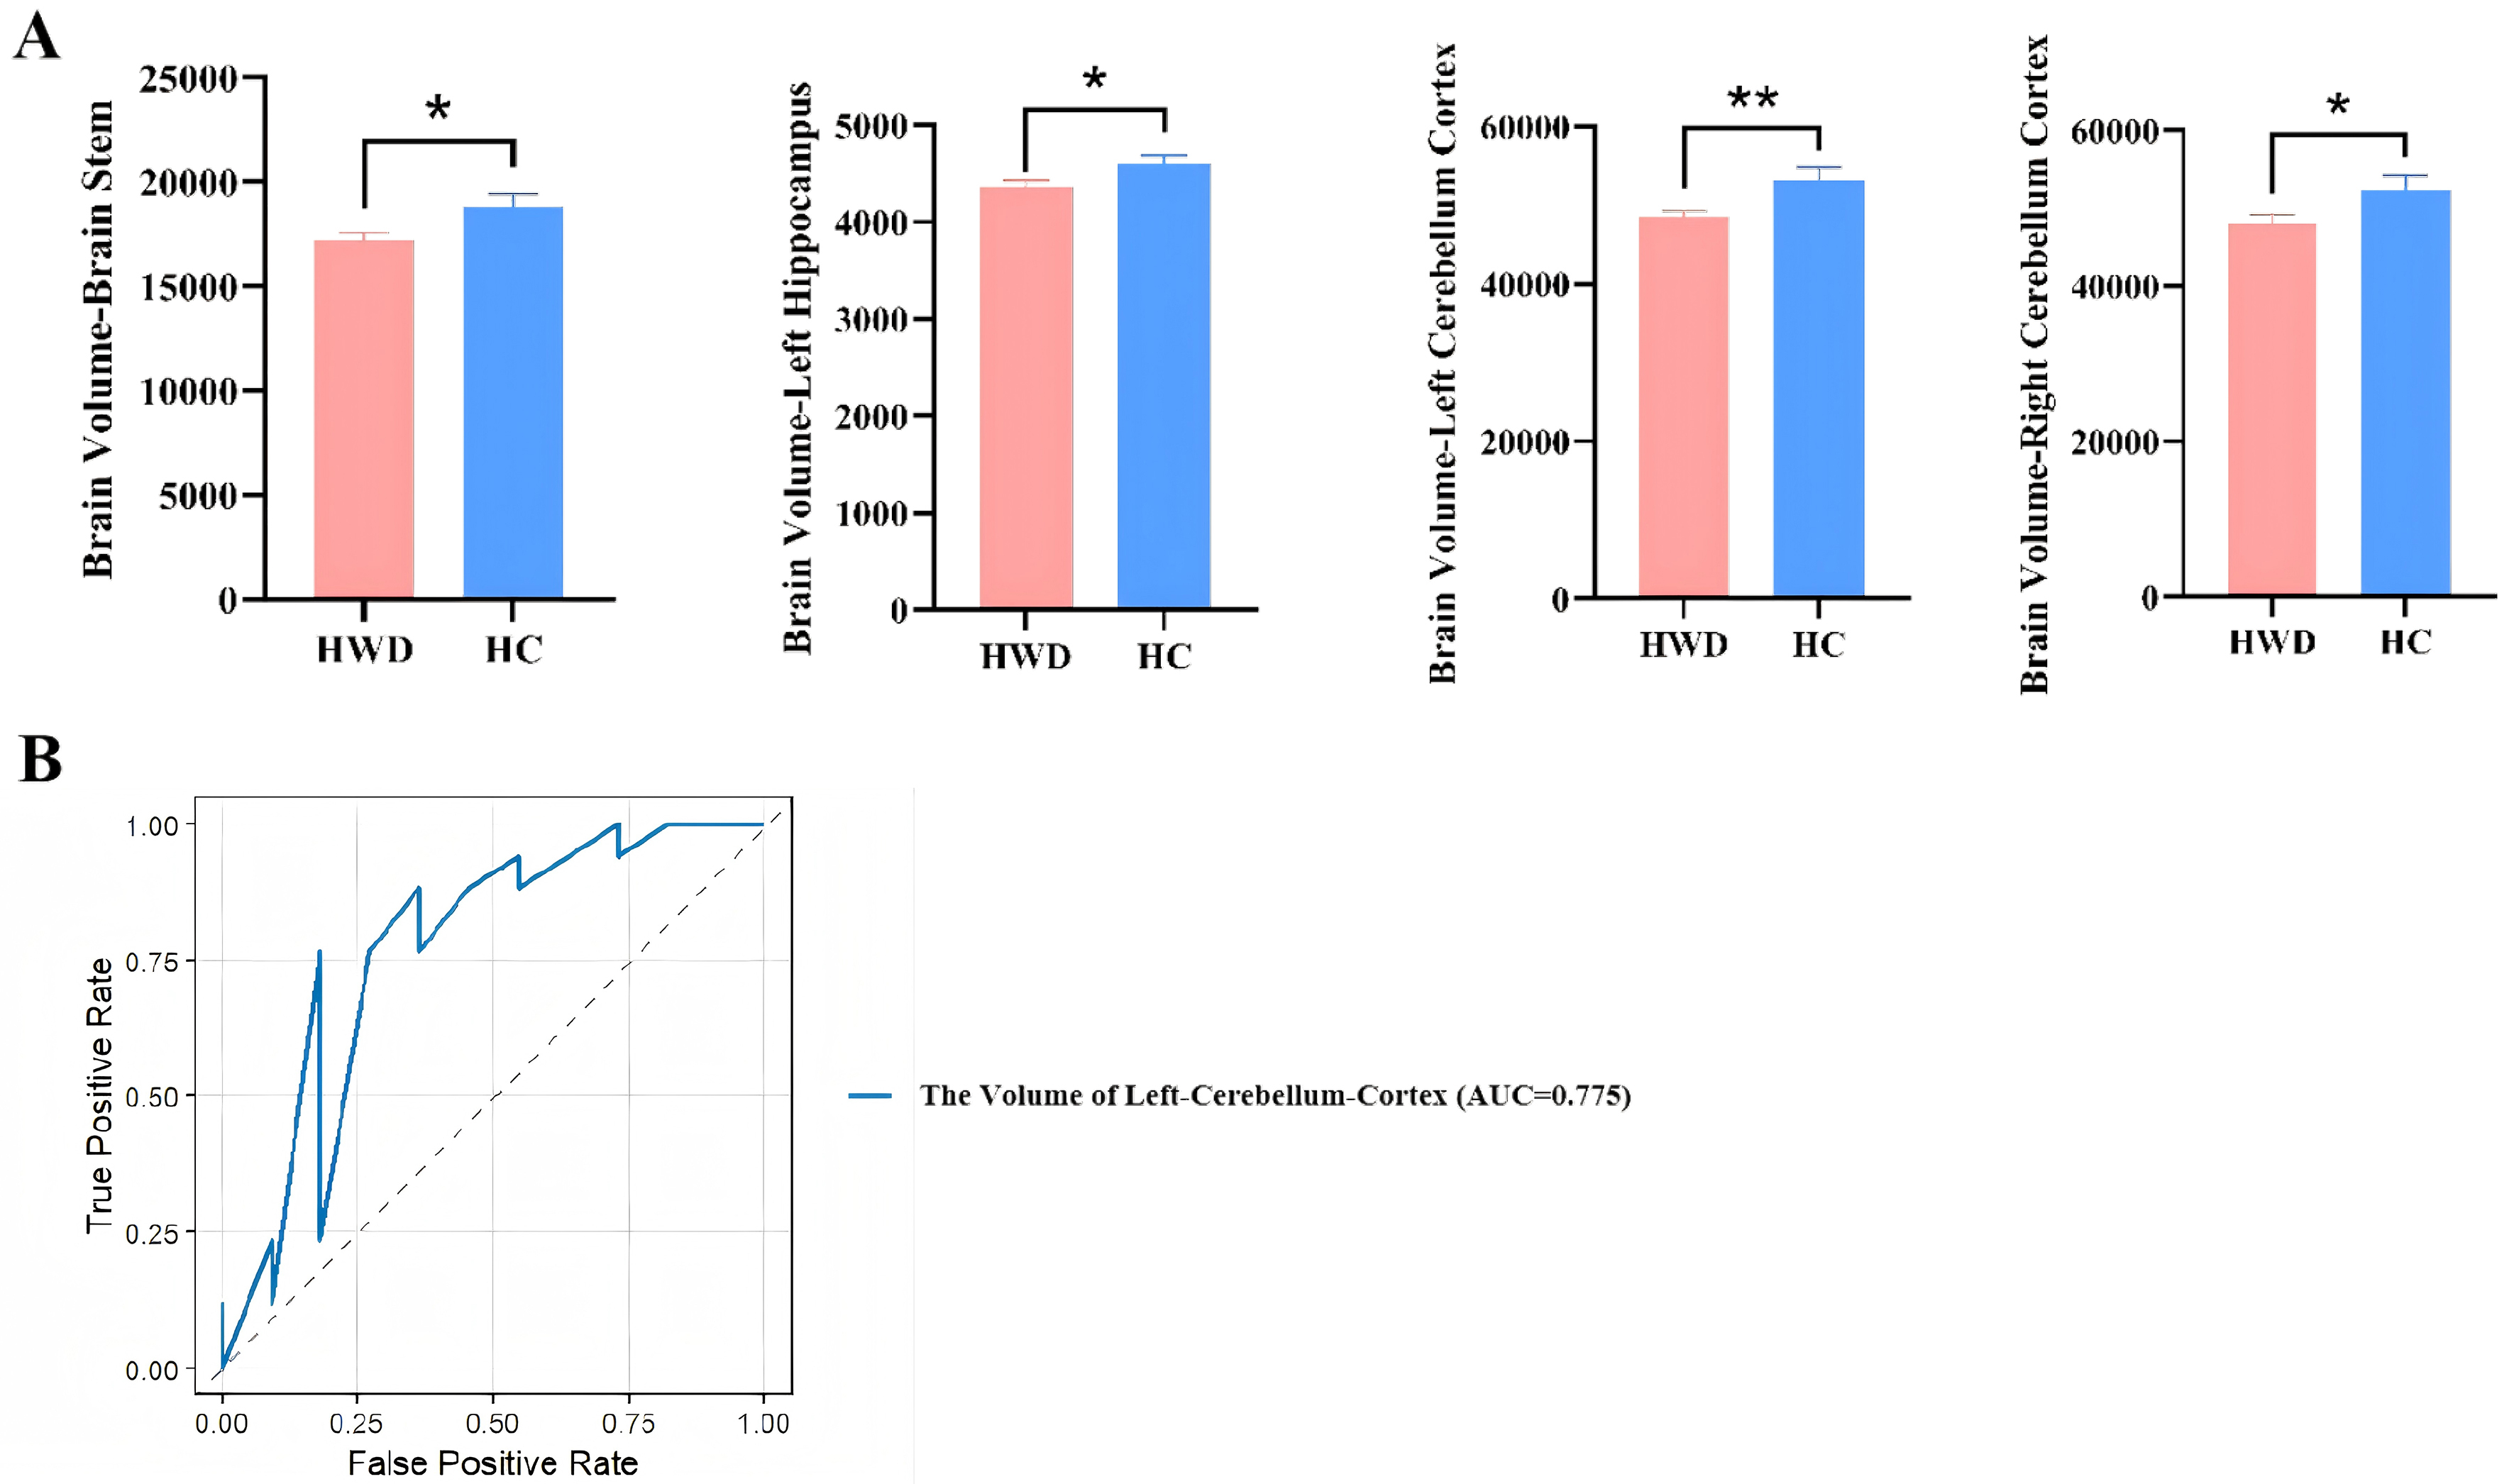
Figure 6. Comparison of neuroimaging and hepatic imaging characteristics of HWD and HCs. (A) Difference in brain volumes in HWD and HC; (B) ROC curves and AUC values illustrating the diagnostic performance of the selected variables using LASSO regression to distinguish between HWD and HCs. Results are expressed as mean ± SEM. ****P < 0.0001; ***P < 0.001; **P < 0.01; *P < 0.05. HWD: Hepatic Wilson’s disease; HCs: healthy controls; ROC: receiver operating characteristic; AUC: area under the curve; LASSO: Least Absolute Shrinkage and Selection Operator; SEM: standard error of measurement.


