


fig1
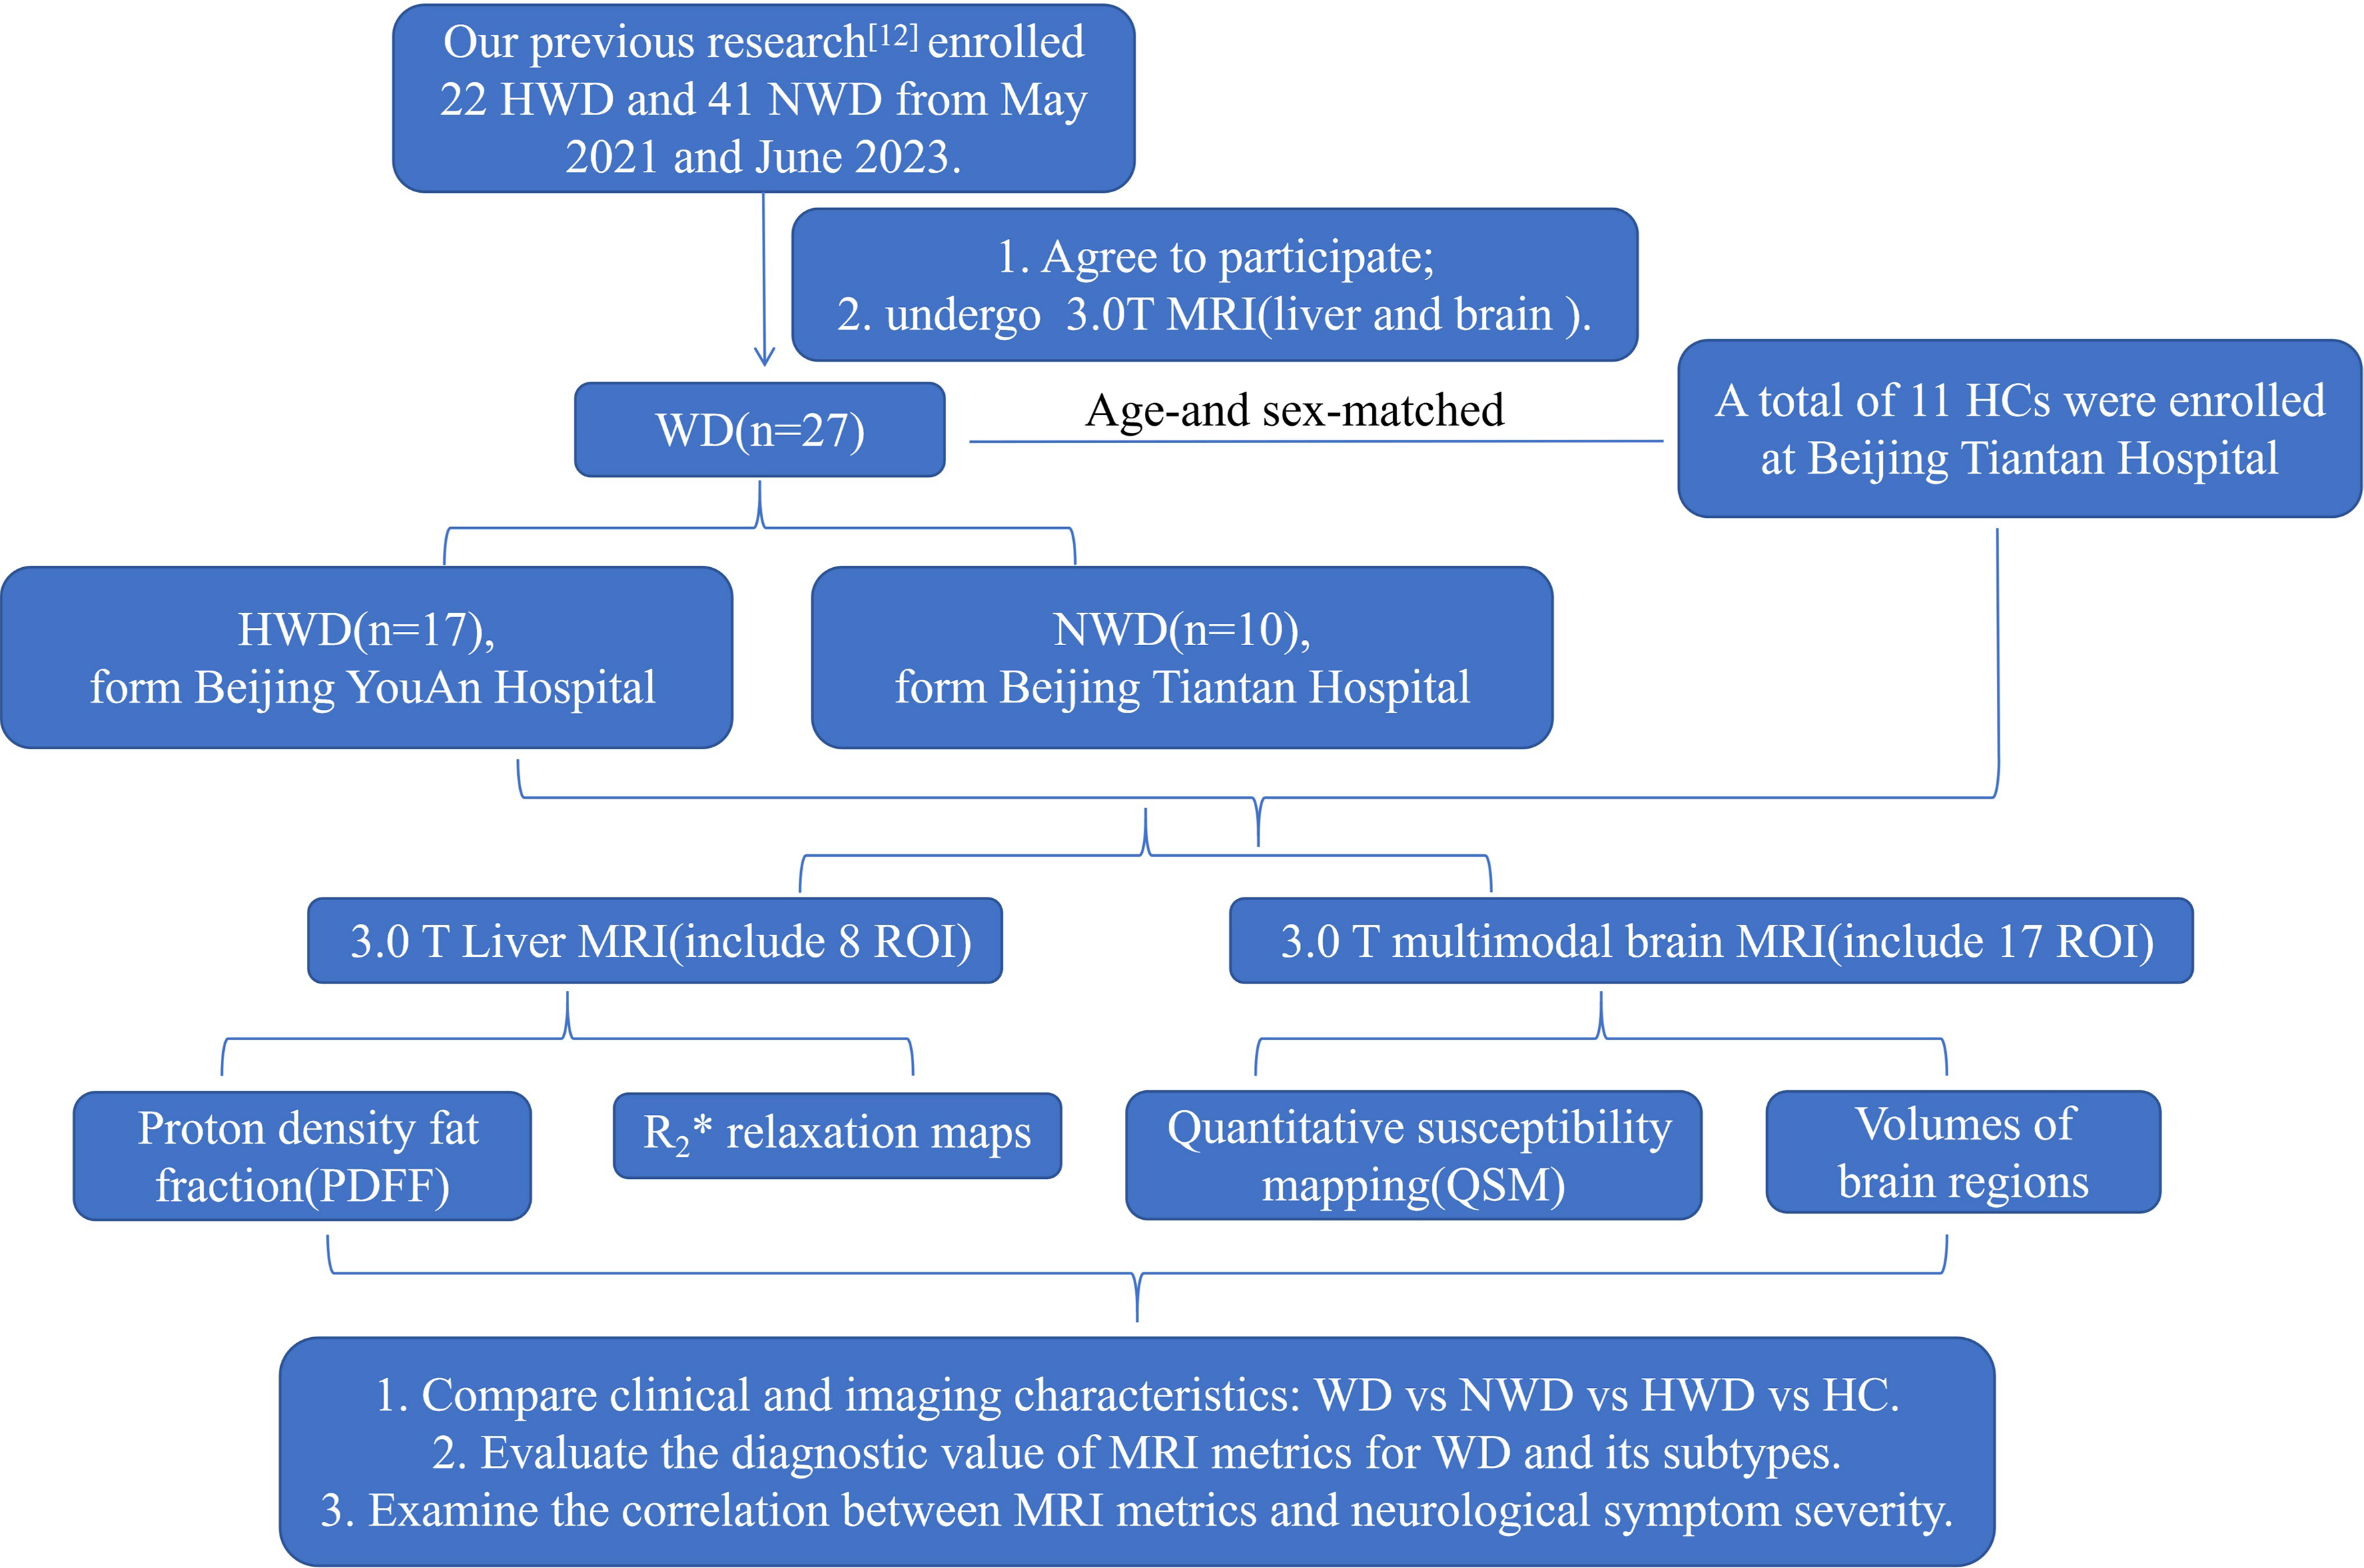
Figure 1. Flowchart of the study design. WD: Wilson’s disease; NWD: neurological Wilson’s disease; HWD: hepatic Wilson’s disease; HCs: healthy controls; ROI: region of interest; MRI: magnetic resonance imaging; R2*: the rate of signal decay caused by the combined effects of intrinsic tissue properties and magnetic field inhomogeneities, and were generated to quantify iron deposition.


