


A target extraction method for 3D pig point clouds from a top-down perspective
 0
0 Abstract
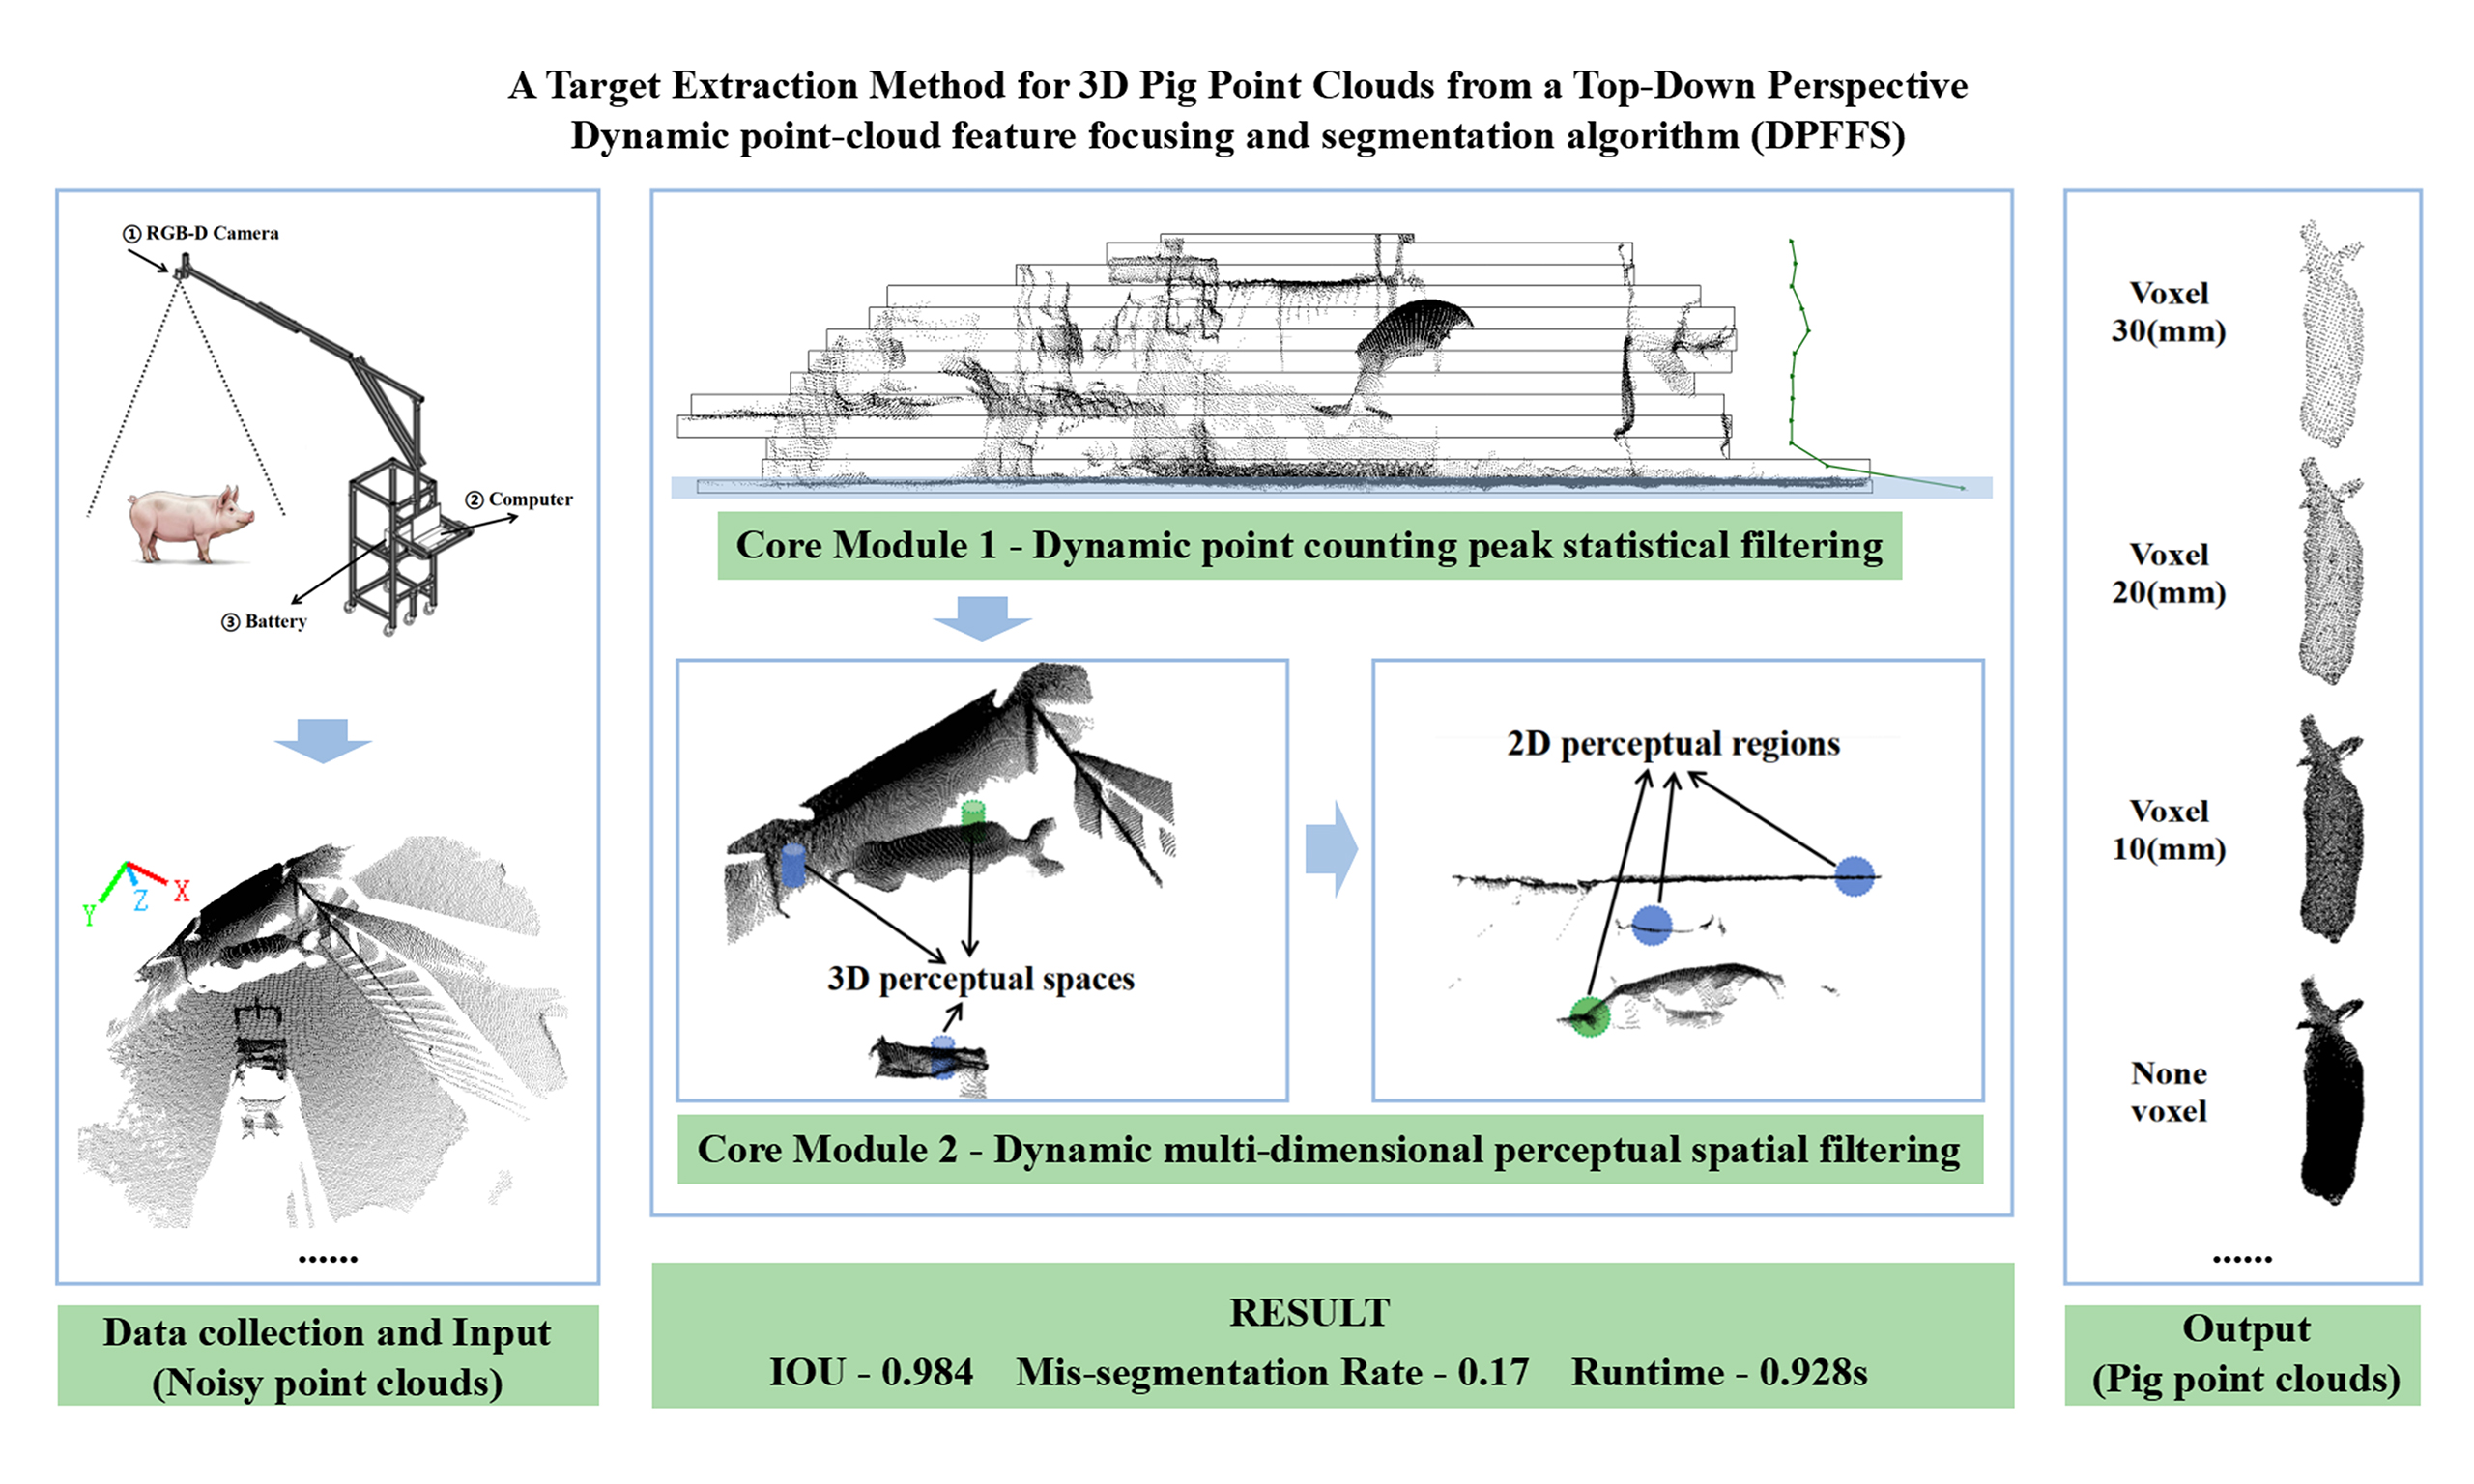
Currently, there are many studies focusing on keypoint extraction, weight estimation, and pose assessment using point clouds from pig backs. But extracting point clouds from complex environments remains challenging, especially when the data collection environment, location and height are changing. This study addresses the challenge of extracting 3D point clouds of pig in complex environments with variable heights and severe interference from a bird’s-eye perspective by proposing a target extraction method based on a single Time-of-Flight (TOF) depth camera. A custom-designed pushcart-based data acquisition equipment was utilized to collect 987 point cloud datasets under diverse conditions, encompassing three height levels to accommodate various pig body sizes and postures. A dynamic algorithm, dynamic point-cloud feature focusing and segmentation (DPFFS), was developed, which integrates a point counting peak statistical filtering module and a multi-dimensional perceptual spatial filtering module to remove ground point clouds and other interfering noise. This way of extracting target does not require pigs to move through specific channels and is also transferable to the segmentation of multiple targets, and other animals, and varied scenes. Experimental results show that the pig body point clouds were highly consistent with the ground truth, as represented by the manual segmentation results, with an average intersection over union (IoU) of 0.984, considering the erroneous segmentation caused by clustering, the IoU is 0.836, mis-segmentation rate is 0.17. After voxel grid downsampling, the DPFFS algorithm achieved an average running time of 0.928 s. It can serve as a pre-processing module for point cloud target extraction in various application scenario, providing accurate preliminary results for tasks such as individual identification, body size measurement, and pig weight estimation, etc.
Keywords
1. INTRODUCTION
The phenotypic data of pigs, including body size, body conformation traits, and body weight among other core parameters[1], play a crucial role in pig breeding and production. These data serve as a foundation for various aspects and stages, such as breeding, genetic selection[2], reproductive management[3], and scientific research[4]. The accumulation of phenotypic data in pig farming guides the adjustments, operation and decision-making of the breeding processes. Currently, the acquisition of body size data primarily relies on manual measurements[5], body conformation traits and appearance scoring rely on experienced professionals, while the weighing of pigs using animal scales relies on manual driving away pigs. These methods are time-consuming, labor-intensive, hazardous, and prone to causing personnel injuries. Moreover, these methods may negatively impact animal welfare, potentially inducing stress responses and consequently impairing productivity, fertility, and growth rates[6].
To overcome the challenges associated with manual measurement and production processes, a range of recent studies have been developed that leverage artificial intelligence and computer vision technologies to solve these problems. The fundamental principle of these technologies is the utilization of Red-Green-Blue (RGB) cameras or depth cameras for acquiring animal images (2D)[7-11] or point clouds (3D)[12-17]. Based on these collection method, image segmentation[18], 3D reconstruction techniques[19,20], and deep learning methods are subsequently used to process single-dimensional or multi-modal data, typically gathering key points to assist in calculating animal body size or estimating weight based on area and volume. The use of these technologies and intelligent electronic devices enables the effective mitigation of stress responses and adverse effects associated with direct animal contact, while simultaneously improving operational efficiency, an advantage that is especially significant in large-scale production. Compared to 2D image information, depth camera can measure the distance to objects (3D), thereby better capturing animal contours. In recent years, 3D pig back point clouds have been well used in many studies, such as estimating pig weight and key point detection for body size measurements. Nevertheless, challenges persist in the pre-processing stage of acquiring pig point clouds.This is mainly manifested in the fact that it becomes particularly difficult when the environment, location, and height of the dataset collection change, as well as when the target point cloud and noise point cloud are integrated.
Currently, there are two main point cloud segmentation (PCS) approaches, traditional PCS algorithms based on geometric or statistical principles [e.g., Region Growing, Random Sample Consensus (RANSAC), density-based spatial clustering of applications with noise (DBSCAN), etc.] and deep learning methods[21-23] (e.g., MVCNN, FGPointKAN++, PointNet, PointNet++, etc.). For PCS approaches, most of the research utilizing PCS are constrained to specific or fixed scenarios, which typically confine pigs within fixed passageways, requiring them to remain in or move through these channels, or to collect data in designated areas such as feeding or weighing zones. At the same time, when the environment, acquisition location, and height change, it is necessary to manually adjust the filtering parameters or simply use software for segmentation, the segmentation results are often suboptimal, particularly in cases where animals are closely adjacent to railings or walls. For deep learning approaches, a substantial amount of data is required for model training. However, obtaining livestock point cloud data is highly challenging for two main reasons: firstly, publicly accessible livestock point cloud datasets are scarce. Secondly, data acquisition is difficult, and generating point cloud datasets is both time-consuming and labor-intensive. Okayama et al. (2021) utilized a top-view Kinect v2 camera to collect data for estimating pig weight based on the volume of pig back point clouds[24]. However, the segmentation method for pig back point clouds was not explicitly mentioned in their study. Based on data analysis, it can be inferred that the extraction was conducted within fixed pig passageways. Similarly, Li et al. (2022) employed a Kinect v2 camera positioned in the drinking area to capture pig back point clouds for body parameter measurements[25]. In their research, ground point clouds were chosen as the reference coordinate system, and a variance classification algorithm was applied to distinguish between pig bodies and noise points. In this algorithm, points with higher variances were deemed as noise, while those with lower variances were classified as the pig body. Subsequently, a top-down region growth method was employed for segmentation under conditions of adhesion. Liu et al. (2023) captured pig back data using an Intel RealSense D435i camera positioned above pig weighing scales, they employed statistical filtering and DBSCAN to separate pigs from the background[26]. Wang et al. (2024) designed the Pig Back Transformer model using pig back point clouds, the point cloud data of pig backs were obtained from cameras positioned above stationary pig passageways, with background noise removed in the fixed scenes[27]. In a word, the aforementioned studies almost uniformly confine pigs to a fixed area for point cloud preprocessing and the two preprocessing segmentation methods in the existing research generally have the following limitations, the PCS method requires adjusting a large number of parameters in complex situations, while deep learning methods require preparing a large amount of training data in advance for training, which can be quite troublesome in practical engineering applications.
In response to these challenges, we propose a method for accurately extracting pig body point clouds in complex and dynamic livestock farm environments. Specifically, we developed a dynamic point-cloud feature focusing and segmentation (DPFFS) algorithm, the algorithm is not a particularly innovative AI model, but rather a simple, fast, and highly adaptable preprocessing method that integrates PCS techniques, such as K-dimensional (K-D) Tree, nearest neighbor radius search, spatial pass-through filtering, and Euclidean clustering. Compared to singular PCS methods, it can achieve dynamic filtering and object extraction effects without adjusting a large number of parameters, and can be applied to completely different scenarios without restricting pigs to fixed scenes or passageways, and without any manual preprocessing of the dataset. Compared with the deep learning method, this method does not require extensive training datasets, and can rapidly extract point clouds from the top region of pigs. This approach effectively isolates target point clouds under varying noise conditions, in scenario where pig bodies blend with background noise, and in both single- and multi-pig scenes. The method ensures precise extraction of pig body point clouds despite pig movement, postures variations, adjustable camera heights, and diverse environmental conditions by leveraging the geometric characteristics and spatial distribution of the point clouds. Moreover, this approach is adaptable to the extraction of point clouds for other livestock species, such as cattle.
2. MATERIALS AND METHODS
Our experiment does not involve any harm to pigs, and we have obtained permission from the person in charge of the pig farm to complete 3D point cloud data collection under their cooperation and supervision. All animal experimental procedures in this study were formally reviewed and approved by the Institutional Animal Welfare and Animal Experimental Ethical Inspection Committee of the National Engineering Research Center for Information Technology in Agriculture (NERCITA), China (Approval No. DWFL-2025-2-02). The experimental protocols strictly adhered to the “3Rs” principles (Replacement, Reduction, and Refinement) and national guidelines for animal welfare. Specifically, during the data collection process, we guided pigs to an empty enclosure and only used a Time-of-Fligh (TOF) camera for non-contact scanning, without touching the pig’s body or restricting its movement throughout the process, after the experiment was completed, the pigs were released back to their original enclosure. In the experiment, a push-cart data acquisition equipment was utilized to acquire point cloud data. Based on the distribution characteristics of the point clouds, the DPFFS method was designed and validated using 987 datasets. The overall flowchart of the DPFFS algorithm is shown in Figure 1, which includes INPUT, MODULE 1, MODULE 2, and OUTPUT four stages. The input is pig point cloud in the original environment with ground noise. In MODULE 1, these ground noise of varying heights is automatically identified and removed by analyzing the point cloud density features within this slice. After that, MODULE 2 effectively discerns and filters out noise in the vertical (Z-axis) direction such as walls and equipment, as well as noise in the horizontal plane (X-Y plane) such as railings and window sills. The output is the extracted point cloud of target pig body. These two modules demonstrate excellent target extraction capabilities even though pig body point clouds are adhered to noise.
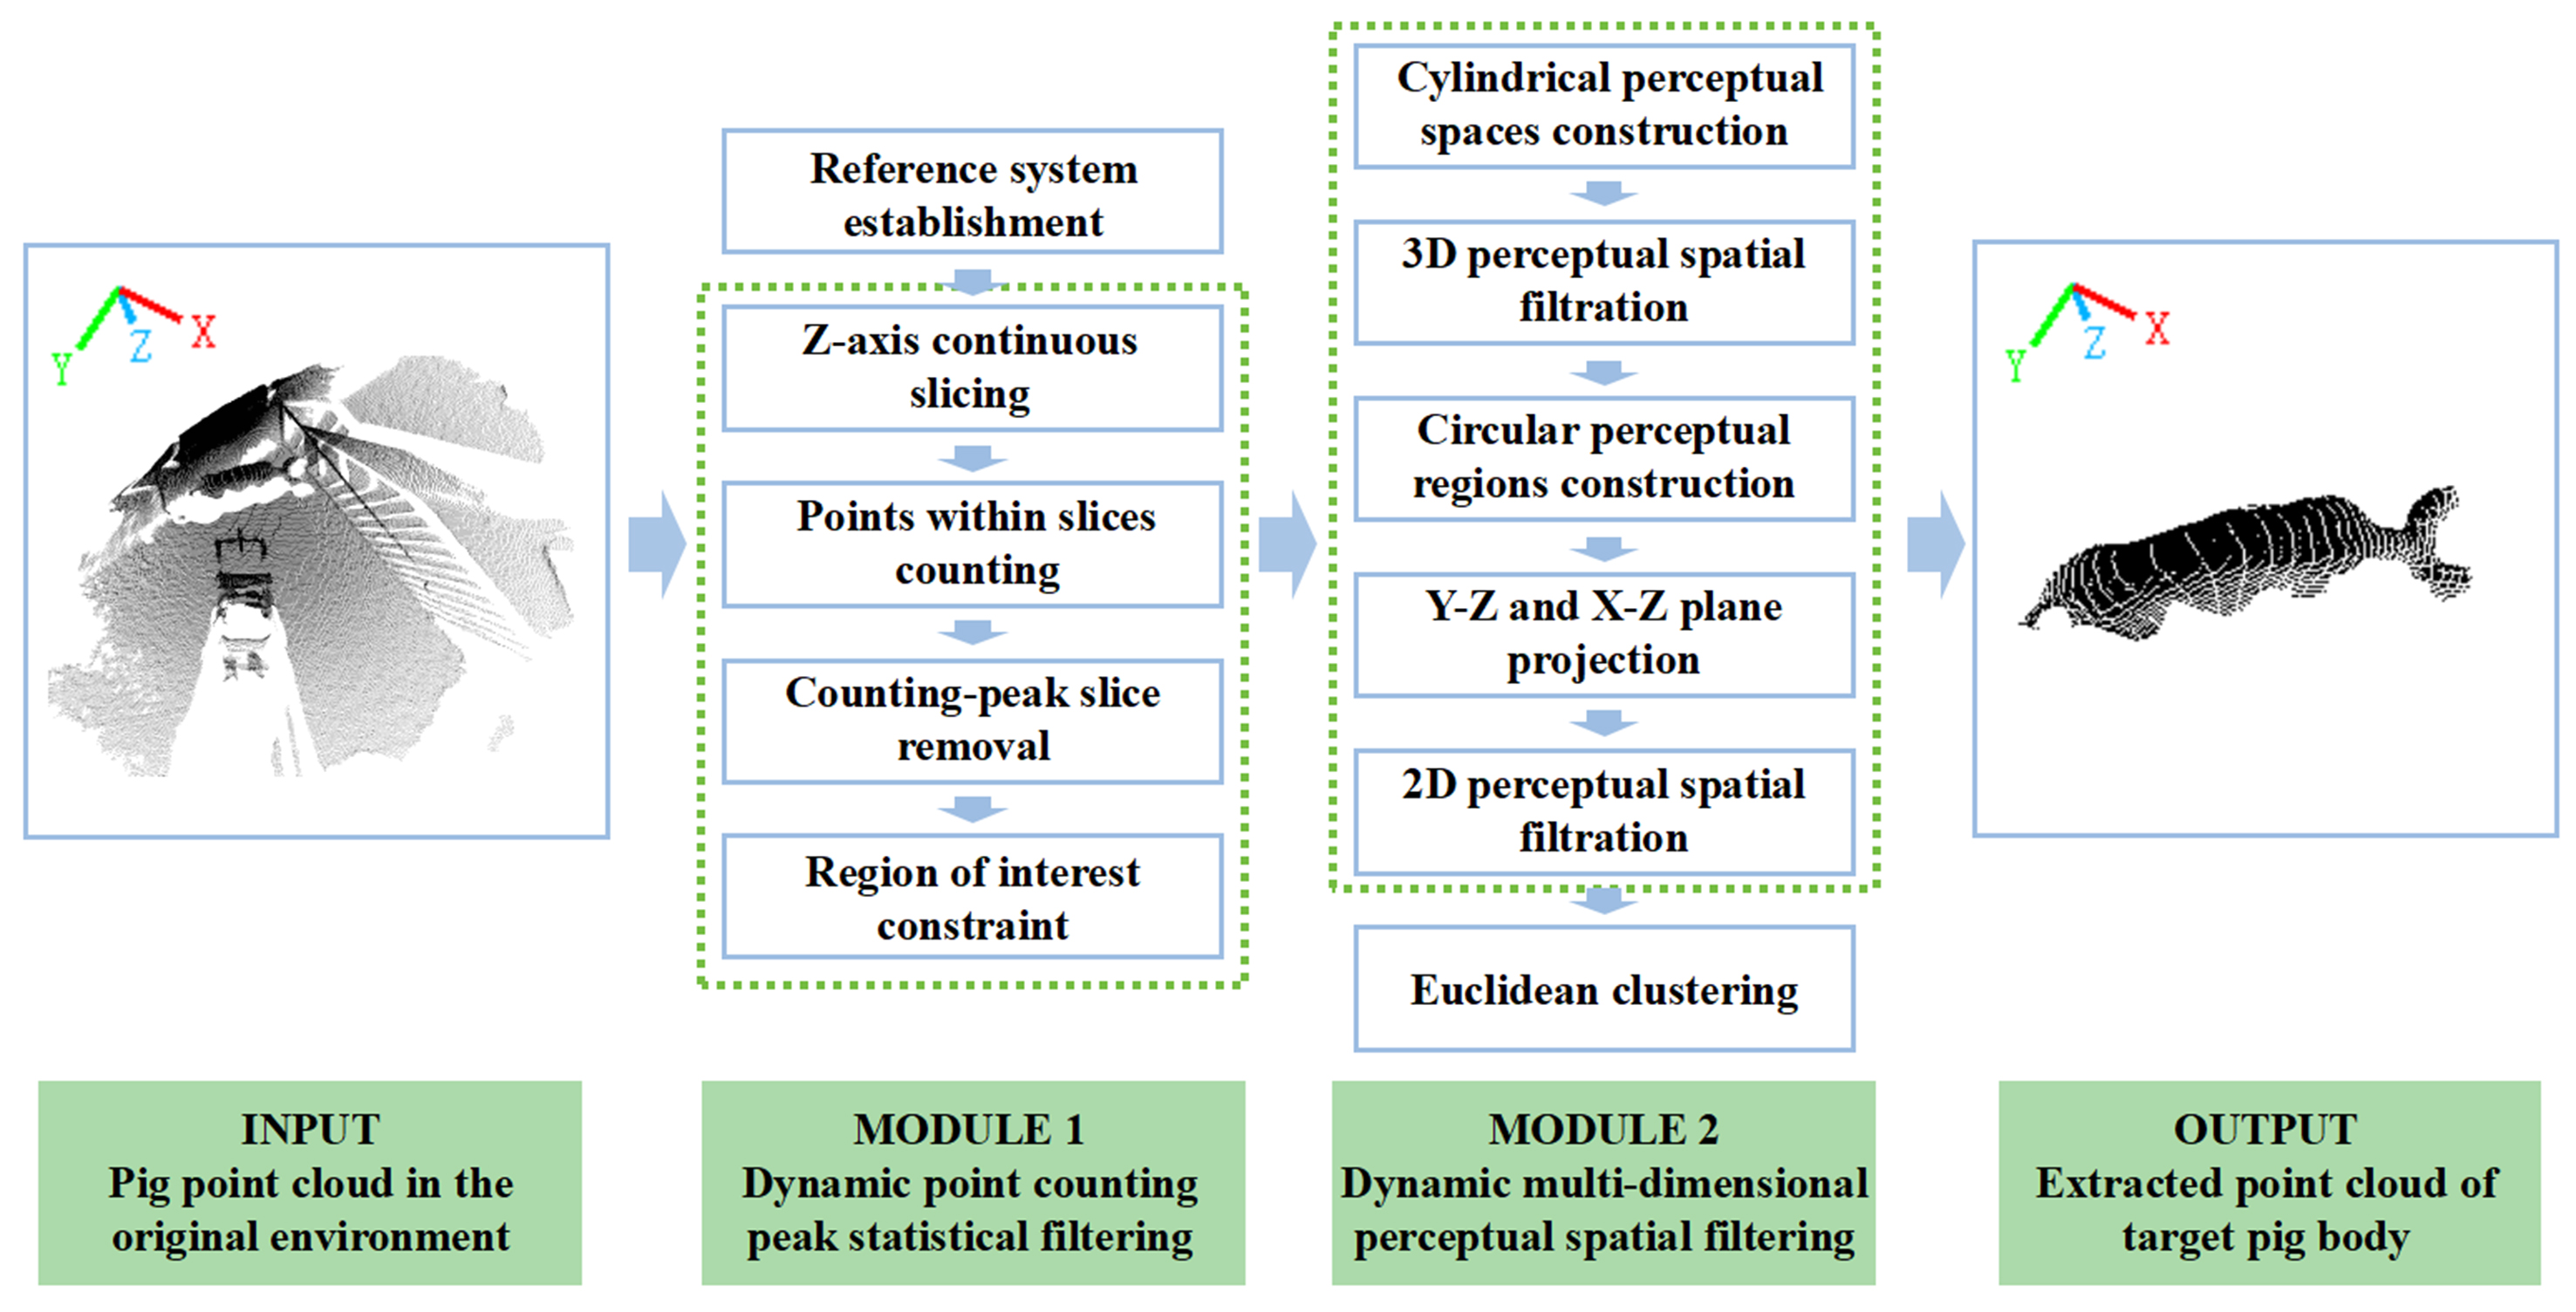
Figure 1. Flowchart of DPFFS method. DPFFS: Dynamic point-cloud feature focusing and segmentation.
2.1. Data and environment
2.1.1. Data acquisition equipment and algorithmic environment
We designed a cart-type bird’s eye perspective data acquisition equipment constructed from aluminum profiles, using a structure that reaches forward for depth camera mounting, which allows for ample movement space between the pig and the equipment. The equipment’s up aluminum boom arm is adjustable both vertically and horizontally, facilitating data collection at various heights and ranges, and includes a platform for placing a computer. Equipment includes a Microsoft Surface Book 2, an Orbbec Femto Bolt camera (TOF), and an outdoor portable battery which can supply power to the computer and camera, as illustrated in Figure 2A.
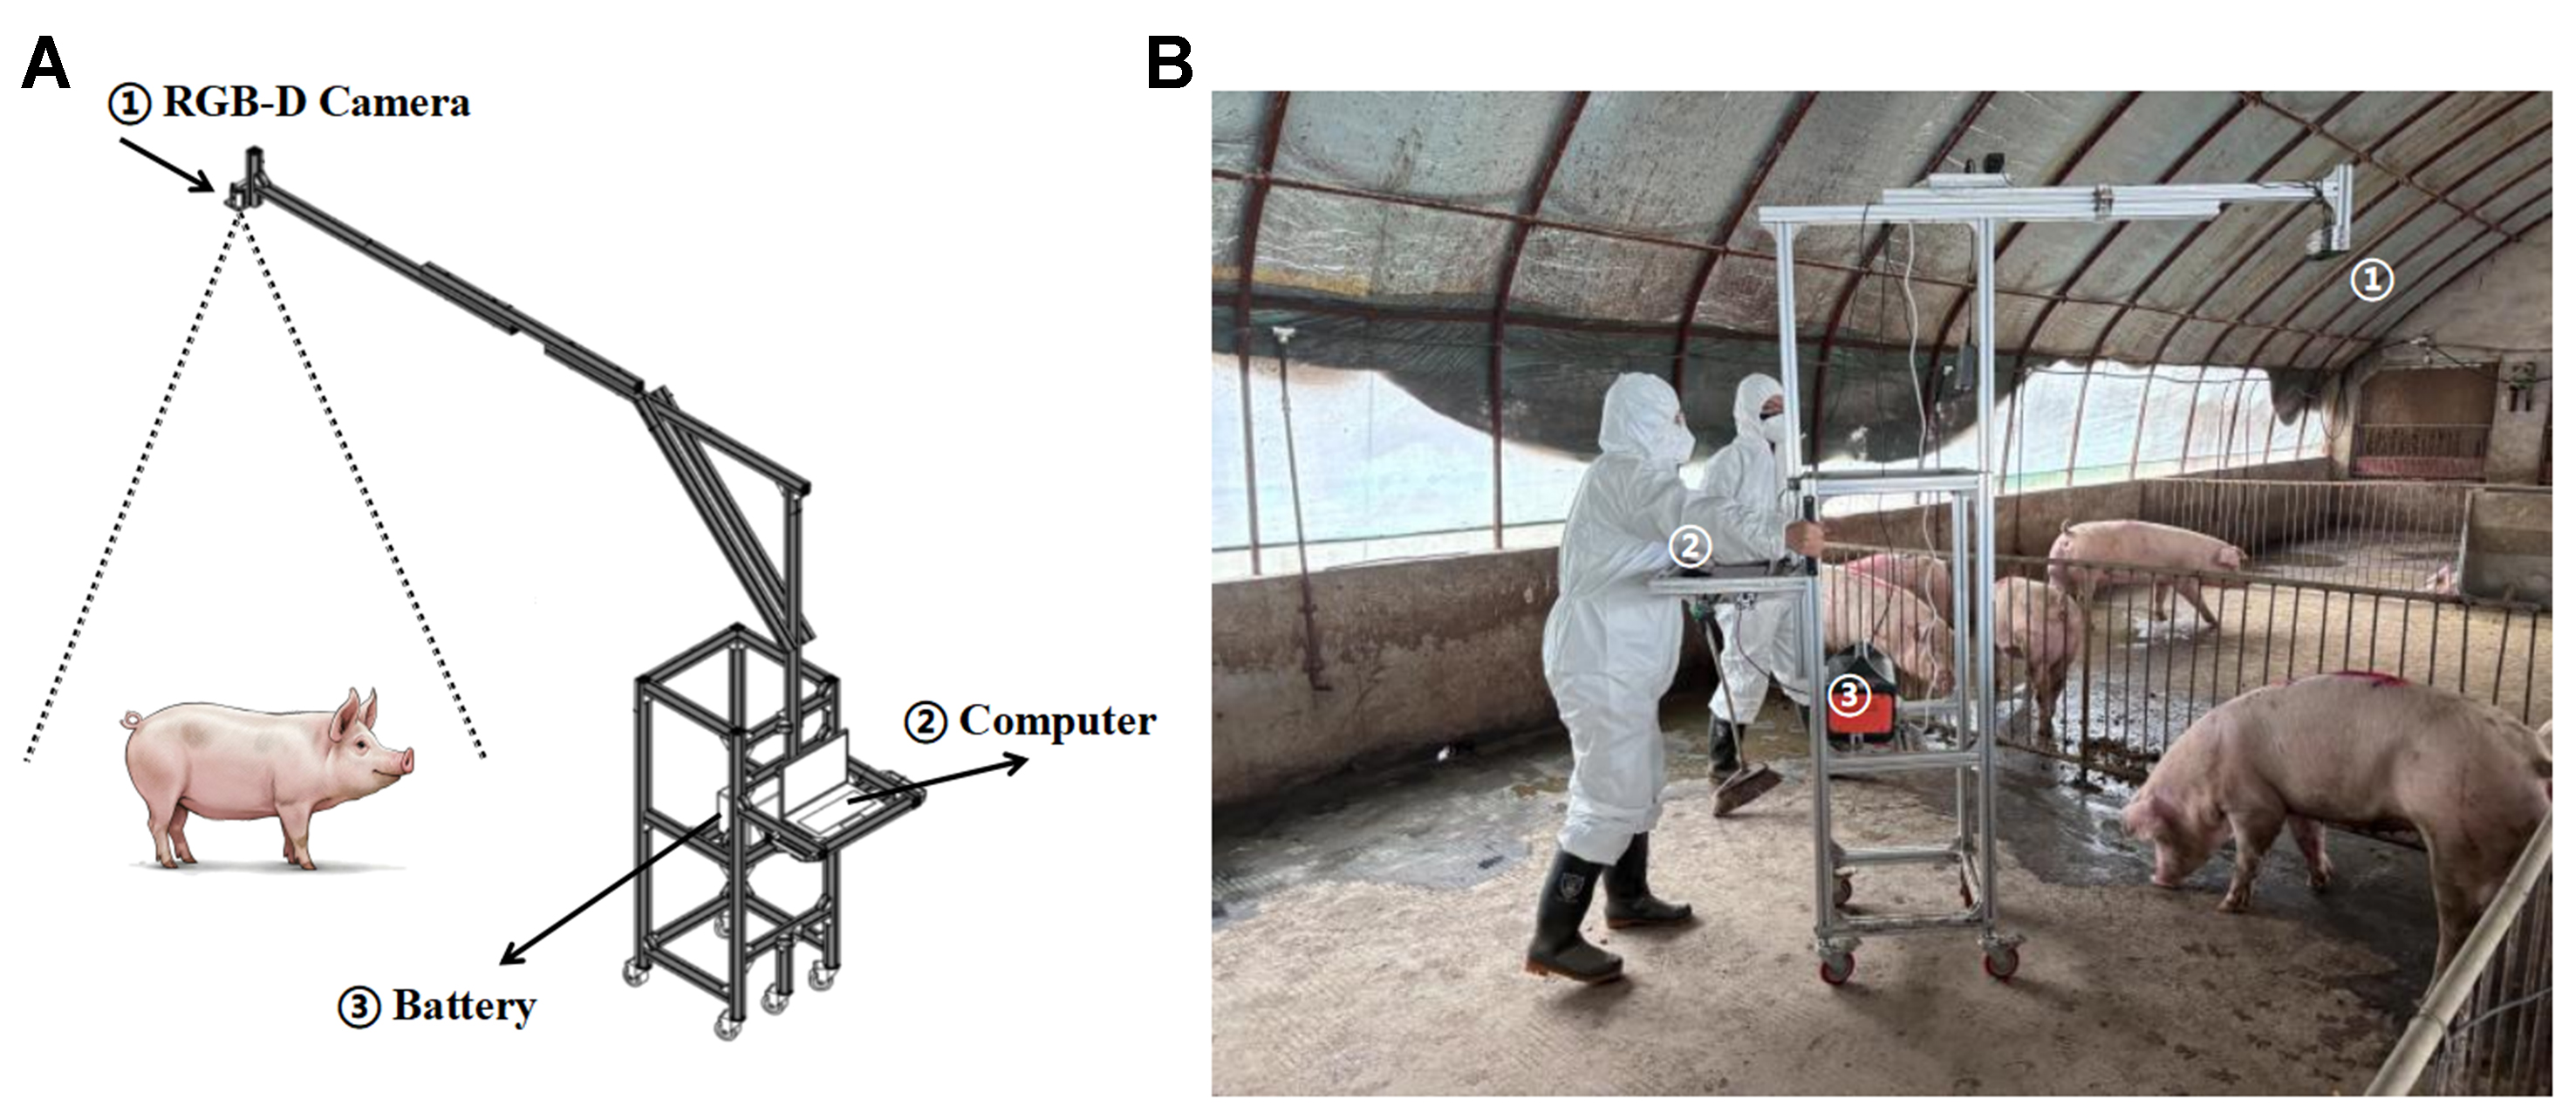
Figure 2. (A) Acquisition equipment diagram, ① Orbbec Femto Bolt (China), ② Microsoft Surface Book 2, ③ Outdoor portable battery; (B) Data acquisition method, photograph taken by the authors. RGB-D: Red-Green-Blue-depth.
During point cloud acquisition, a resolution of 512 × 512 was utilized with a wide field of view of 120° × 120°, the camera’s optical axis was oriented vertically downwards. We collected data at three heights of 1,680, 1,780, and 1,880 mm (where height refers to the vertical distance from the camera’s protective window to the ground surface), the data stream operated at a frame rate of 30 fps, with the data acquisition program set to capture data every second. During data collection, we tried to keep the pig within the camera’s field of view as much as possible.The real situation of data collection is shown in Figure 2B.
The DPFFS algorithm was developed in the Microsoft Visual Studio 2019 using C++ programming language, employed the point cloud library (PCL) 1.11.1 version of the point cloud library and the Orbbec SDK 1.9.5 Release version. The point cloud was loaded using a K-D Tree structure to speed up the process of nearest neighbor searching. The computer configuration for the algorithm design was as follows: CPU - Intel(R) Core(TM) i5-9300H, RAM - 8.00 GB, GPU - GTX 1650, Windows 11. The algorithm did not use a deep learning network and did not require dataset training. To obtain high-density original pig body point clouds or to swiftly extract simplified point clouds with almost unchanged features, we selected three sets of voxel downsampling parameters to assess the algorithm’s execution speed. The equipment parameters involved in the experiment are presented in Table 1.
Device parameters involved in the experiment
| Subject | Content | Subject | Content |
| CPU | Intel I5 9300H | RGB-D camera | Orbbec Femto Bolt |
| Cores/threads | 4 cores/8 threads | Depth technology | iTOF |
| Operating system | Windows 11 | Depth FOV | H120°V120° |
| IDE | Visual Studio 2019 | Depth resolution/FPS | 512×512@30fps |
2.1.2. Data content
The data acquisition for this study was conducted at a fattening pig farm in Longyao, Xingtai City, Hebei Province, China. During this period, a total of 40 different Duroc x Large White crossbred pigs were selected for data collection, ranging in age from 3 to 5 months. The data collection used the push-cart equipment that followed the pigs while maintaining a distance from them. In total, 1,000 sets of polygon file format (PLY) format point clouds were collected, encompassing individuals with different ages (based on body weight) and various movement postures. Among these datasets, 13 sets were considered to be erroneous due to pig moves out of the field of view. As the exposure errors lead to severe depth information and point cloud loss, these erroneous point clouds were removed from the overall dataset, leaving 987 sets of data, sows accounted for 70%, while boars constituted 30%, with body weights ranging from a minimum of 60.0 kg to a maximum of 102.3 kg. The detailed information of the data is provided in Table 2. The postures and sizes of pig body point cloud varied, with some mixed with environmental noise, while others remained unaffected by noise interference except for ground point cloud disturbances.
Data details
| Subject | Content |
| Data source location | Longyao, Xingtai City, Hebei Province, China |
| Data source and quantity | 40 Duroc x Large White crossbred pigs |
| Data format | “.PLY” point cloud |
| Age ranges | 3-5 months |
| Weight ranges | 60.0-102.3 kg |
| Proportion of sows | 70% (692 point cloud sets) |
| Proportion of boars | 30% (295 point cloud sets) |
2.2. Point cloud coordinate reference system
In order to establish the spatial reference system required for point cloud computations, 4 × 4 transformation matrix is employed to standardize the coordinate system in the pre-processing stage. In this study, the Z-axis is defined to align with the direction of gravity, perpendicular to the ground point cloud. While the plane formed by the X and Y axes is parallel to the ground, the values of the Z-axis coordinates increased from top to bottom, with the Z-axis coordinates of points near the ground corresponding to the actual distance from the camera to the ground. For instance, if 1,680 mm was selected as the data collection height in practice, the Z-axis values of points near the ground would be approximately 1,680 mm.The specific orientation of the X and Y axes is not constrained in this study, hence the Z-axis is not selected as the rotation axis, instead, the target states are calculated using the other two axes individually.
The original point cloud set is defined as POriginal {Pi|i = 1, 2, …, n}, where Pi represents index points in POriginal, each of Pi possesses three-dimensional coordinate information, i represents index value of Pi,
2.3. Dynamic point counting peak statistical filtering
Point cloud data contains distance information. When the camera’s height changes, even imaging the same scene will result in completely different depth values and point cloud coordinates. Therefore, relying solely on a single Pass-Through Filter or RANSAC[28] fitting method has certain limitations. The Pass-Through Filter requires setting coordinate parameters, changes in coordinate height deactivate the threshold, necessitating repeated calibration. While RANSAC in this study is prone to erroneously extracting other planar objects such as walls, even pig backs, furthermore, it exhibits low iterative convergence efficiency, lengthy runtime, and high misclassification rates. Hence, a key module of the algorithm named dynamic point counting peak statistical filtering was designed through continuous point cloud slicing and intra-slice quantity statistics, which removed ground noise slice containing peak point count and confines the remaining points within the region of interest. It ran faster than RANSAC in this study and did not exhibit erroneous segmentation.
The overall flowchart for module 1 is shown in Figure 3, step 1 calculates point counting peak and removes ground noise slice, based on the coordinate of the camera A0, the localized starting point A1 and region of interest can be obtained by step 2.
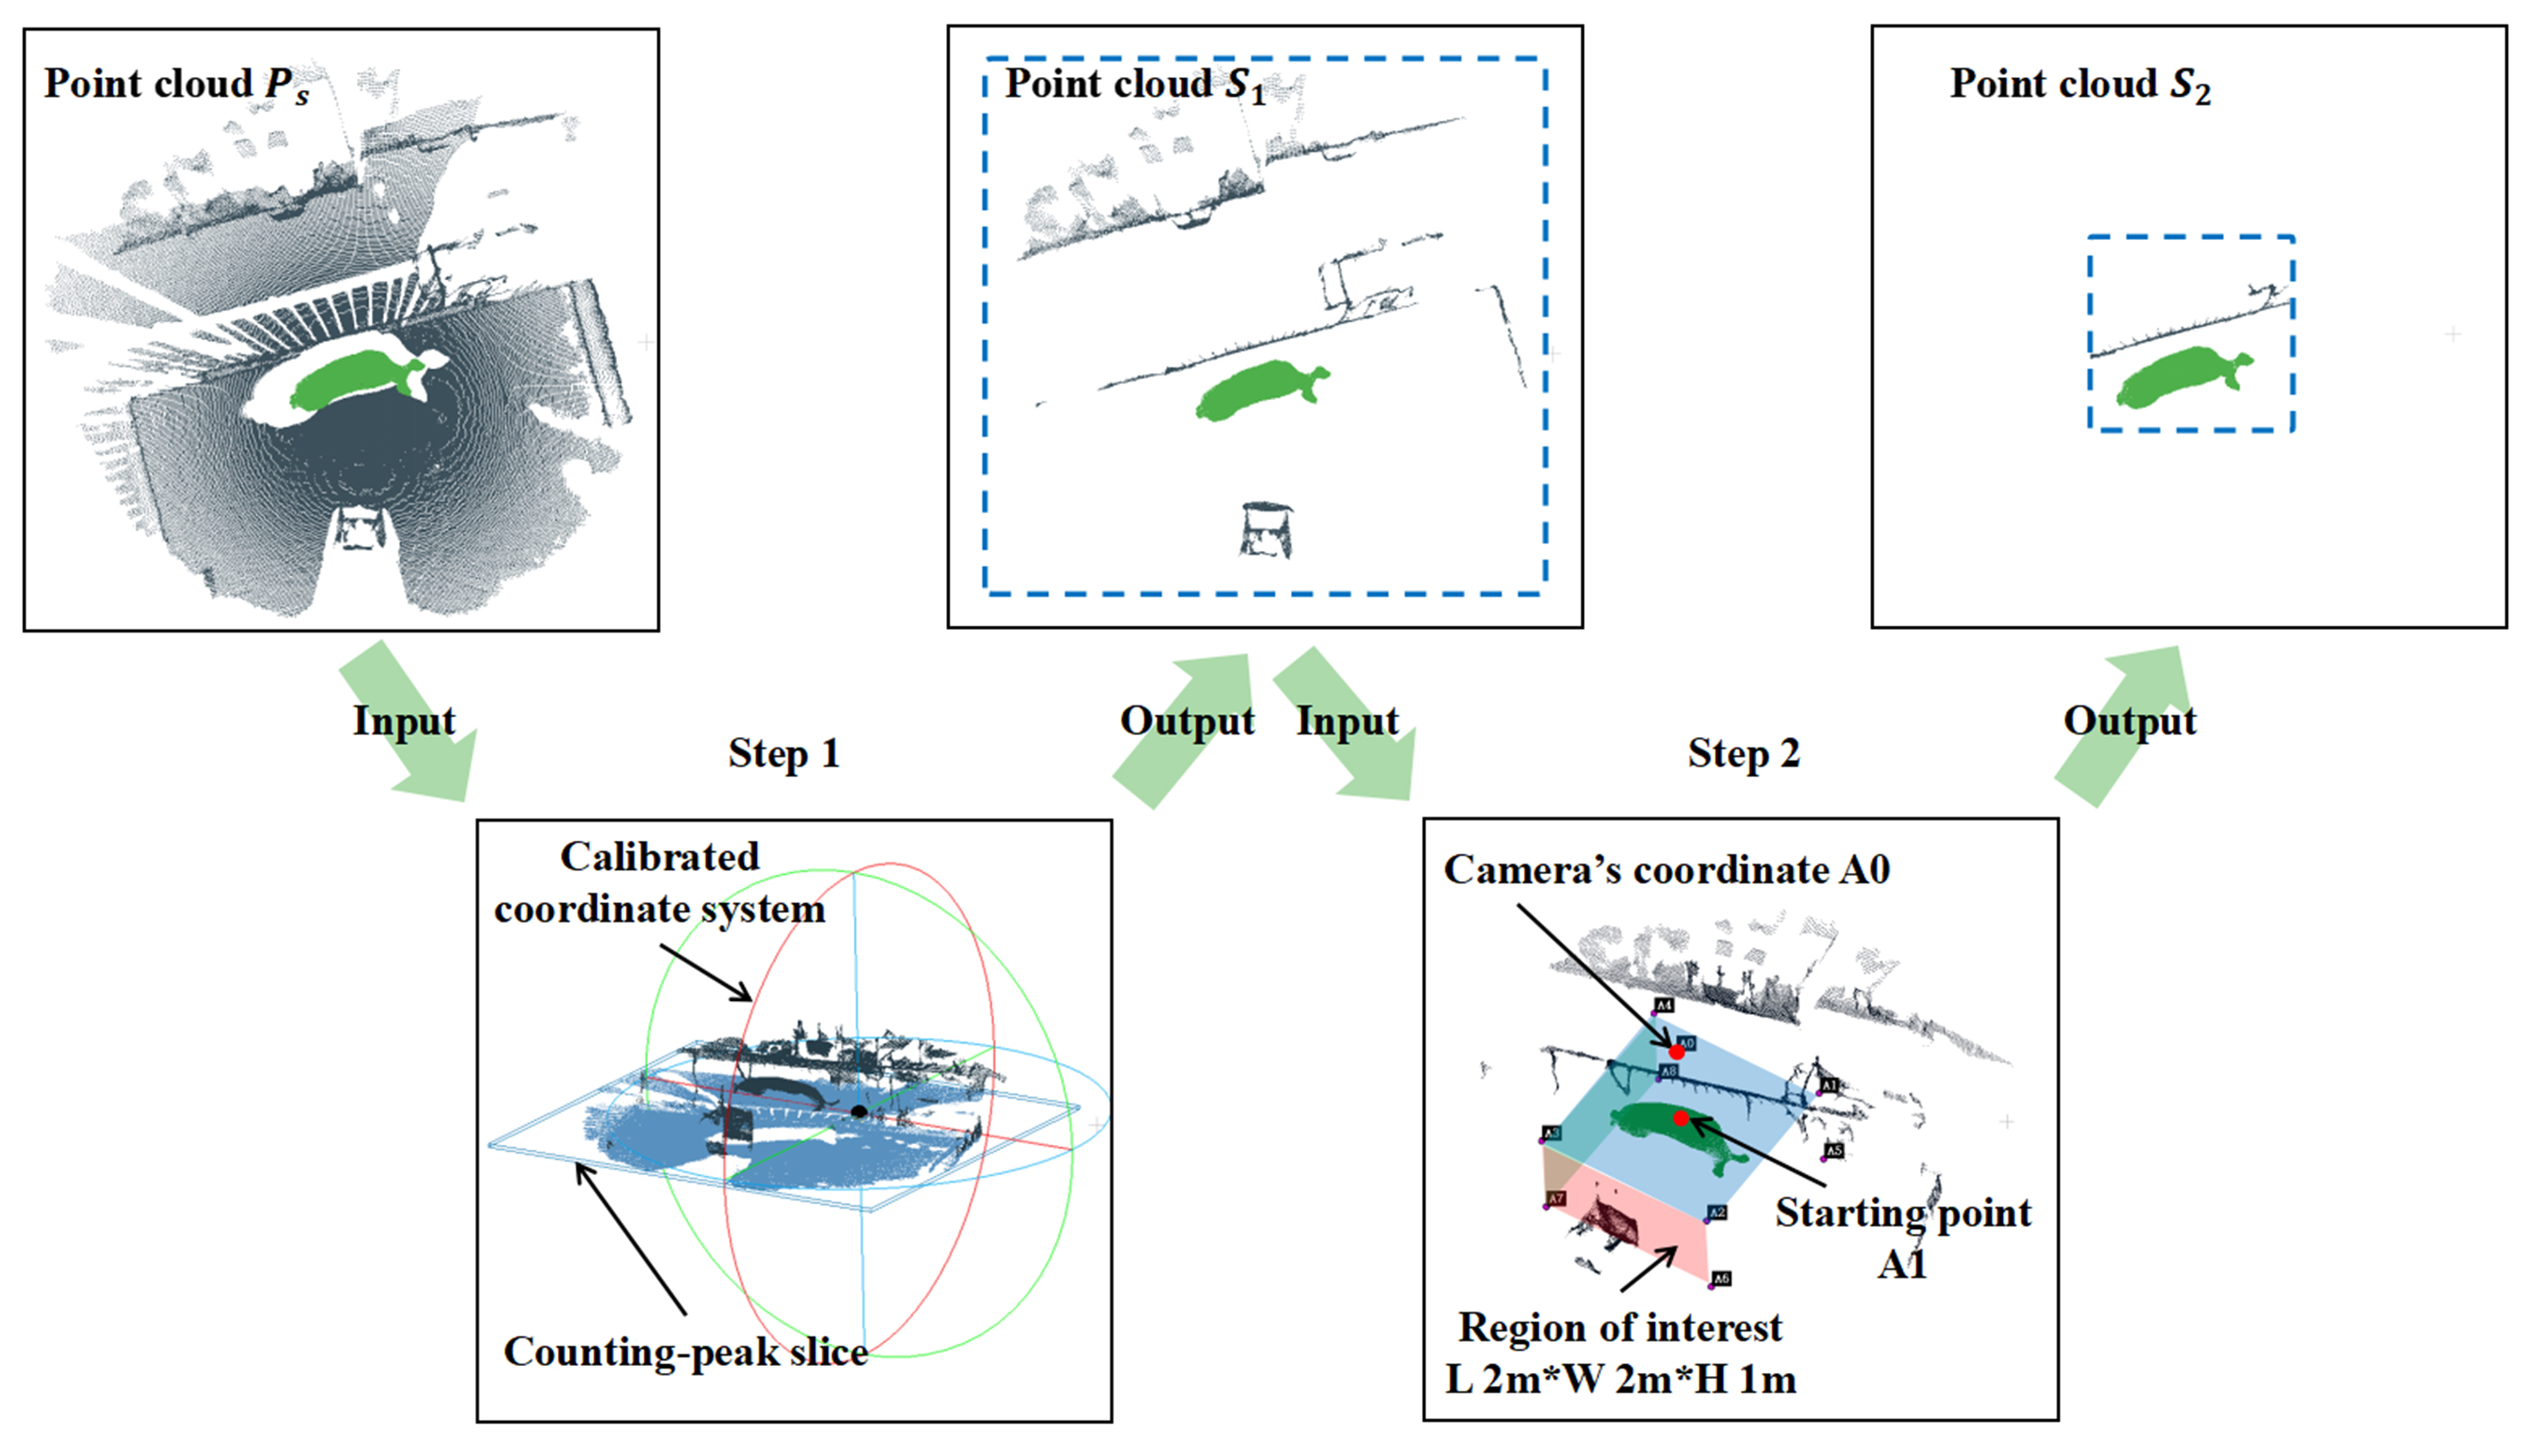
Figure 3. Flowchart of ground noise removal and region of interest extraction (module 1). Ps: point cloud that Z-axis values fall within the interval of [Zmax - ΔZ, Zmax], S1: point cloud without ground noise, S2: point cloud within region of interest.
2.3.1. Variable altitude ground noise identification and filtering
In the wide field-of-view depth imaging system of a TOF camera, the spatial structure of the acquisition space presents a conical influenced by the geometric characteristics of the perspective mirror. Areas of the ground farther from the camera optical center exhibit larger X-Y plane areas, and these points tend to cluster within small segments along the Z direction. Therefore, the principle of module 1 involves slicing the point cloud continuously, tallying the number of points within each slice, and ultimately identifying slices containing peak point count as “ground noise” for removal using a pass-through filter. Previous section calculated a standardized coordinate system point cloud P, using P as input, traversing the point cloud index, obtaining the maximum value Zmax of the Z-axis, which is realistically the lowest point on the ground, defining ΔZ = 1,000, equivalent to 1,000 mm, Zmax - ΔZ is defined as the lower limit and Zmax as the upper limit for a spatial pass-through filter. This procedure defined a rectangular spatial region with a height of
The starting and ending interval of the Z-axis for the target point cloud Ps are now [Zmax - ΔZ, Zmax]. Within this interval, a cyclic program and pass-through filter are employed to generate slices, each with a span value DZ of 100, corresponding to 100 mm in reality (the impact of varying DZ values is discussed in the discussion section). Subsequently, starting from the coordinate value Zmax - ΔZ, continuous slicing is performed along the Z-axis direction until reaching Zmax + DZ. When the span of the last slice does not meet 100, it necessitates including some empty values in the point cloud. The following Equation (4) is utilized to calculate the number of points N within each slice.Function I is defined such that the result is 1 when the Z-axis of Pi satisfies the condition and 0 otherwise. I represents slice’s index, which can be dynamically calculated from different values of Zmax. For example if I = 3, N3 represents the number of points in the third slice of DZ thickness, interval is [(Zmax - ΔZ) - (3*DZ), (Zmax - ΔZ) - (3*DZ) + DZ].
The number of points within each slice is tallied, resulting in a quantity distribution characteristic shown in Figure 4A, which represents the correspondence between point cloud slices and the number of points within each slice. In Figure 4B, which represents the characteristic distribution chart of point cloud quantities within one point cloud set, the number of points within a slice reaches a peak at positions closer to the ground, corresponding to larger coordinates. To validate this observation, 10 additional sets of point clouds were randomly selected, and their distribution of features exhibited a similar pattern, as shown in Figure 4C. This method can be utilized for ground point cloud localization and denoising purposes.
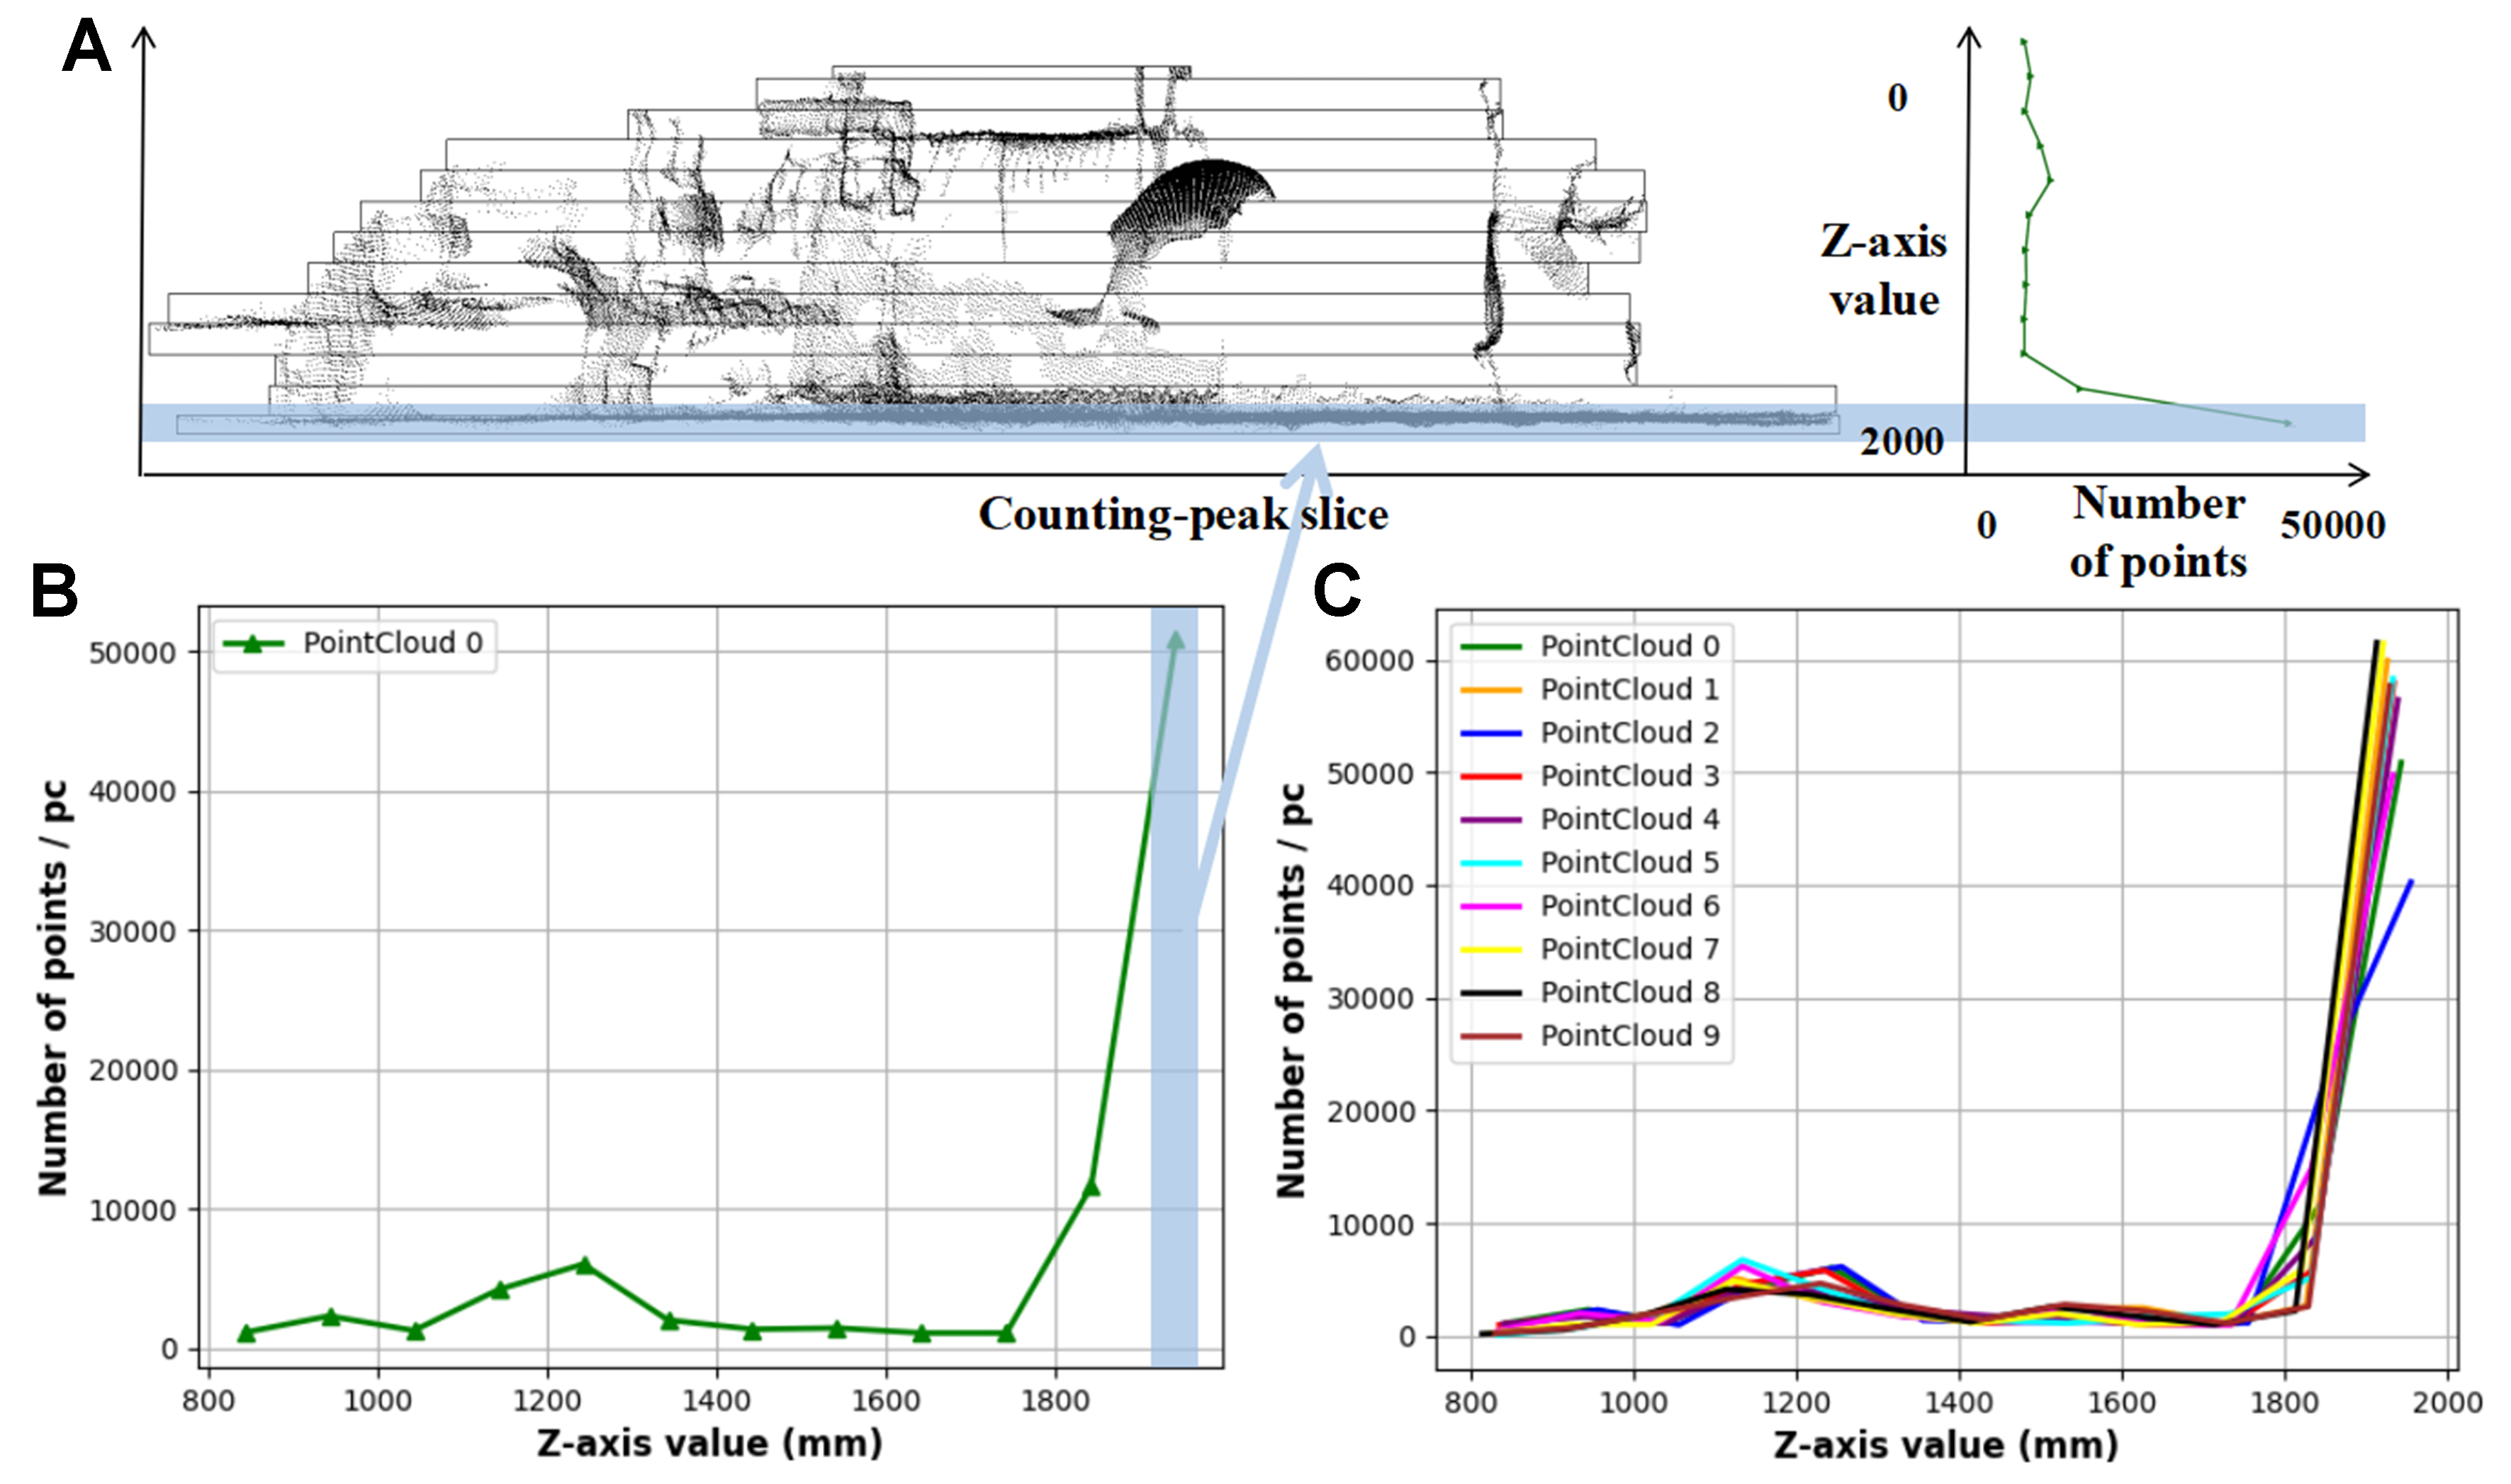
Figure 4. The distribution chart of point quantities within point cloud slices in the [Zmax - ΔZ, Zmax] interval. (A) The correspondence between slices and number of points; (B) The distribution chart of points in one point cloud set; (C) The distribution chart of points in ten point cloud sets.
After obtaining the peak value, a slice with a span value DZ is determined to contain ground noise points within the target space. The starting Z-axis value of the slice is set as dz, calculated by the algorithm, and the ending coordinate value equal to the starting coordinate plus the span: dz + DZ, interval equals to [dz, dz + DZ]. Considering significant noise near the ground and the limitation of small slice spans in encompassing all ground noise points, the range of the pass-through filter is further extended into [dz -
Under the current experimental conditions, point cloud data for slatted floor have not been obtained. However, in practical applications, to ensure the comfort of animals standing and lying down, gap dimensions should be smaller than those of the floor section. Additionally, the point cloud density captured by a single consumer-grade depth camera does not meet industrial standards. Therefore, during point distribution statistics, the characteristics should correspond to those of an actual cement floor. This assumption needs further discussion and validation when real-world data become available.
2.3.2. Region of interest extraction
Following the filtration of ground noise, the point cloud set S1 still exhibits significant noise redundancy, primarily manifested as clusters of outliers comprising non-critical objects such as railings, ancillary facilities of the pig pens, walls, parts of the data acquisition equipment, and suspended dust particles. Consequently, the consideration arises to further constrain the target region to a smaller rectangular space to reduce scene complexity. The camera position defines the viewpoint origin from which the point cloud is generated, with geometric constraints referencing it as the coordinate point. Based on the movement of the pig’s body within the field of view, a bounding box is computed. From the spatial origin coordinate position A0(0, 0, 0) of the camera, A1(0, 0, Zmax - ΔZ) is designated as the localized starting point. A bounding box with dimensions length ΔX = 2,000 mm, width: ΔY = 2,000 mm, and height: ΔZ = 1,000 mm is selected. These dimensions are determined based on the movement range of the largest pig in the experiment. Point cloud data points lying outside this geometric boundary, where the pig’s body would exceed the specified dimensions, are classified as erroneous. The target point cloud set S2 is calculated by the following Equation:
2.4. Dynamic multi-dimensional perceptual spatial filtering
After point counting peak statistical filtering, ground noise was removed, and the redundancy of other noise sources was also reduced. However, instances occur where pigs move in close proximity to pens or walls. These wall or railing noise points are near the pig’s point clouds, sometimes even merging with the pig’s body points, with the number of noise points often surpassing that of the pig. Traditional filtering methods such as gaussian filtering, bilateral filtering, pass-through filtering, statistical radius filtering, and region growing segmentation are ineffective in directly separating these noise points, especially in the edges where the pigs are in contact with the noise. Hence, another key module of algorithm, named dynamic multi-dimensional perceptual spatial filtering, is designed. This module constructs perceptual spaces in both 3D and 2D, defines geometric constraints within these spaces, calculates inner point coordinates, sets threshold parameters, and ultimately denoises within the point cloud set S2. The primary advantage of combining the two dimensions to denoise lies in effectively removing noise in both the vertical and horizontal directions. The overall flowchart for module 2 is shown in Figure 5, step 1 realizes 3D perceptual spatial filtering of z-direction noise, step 2 realizes 2D perceptual spatial filtering of X-Y plane direction noise.
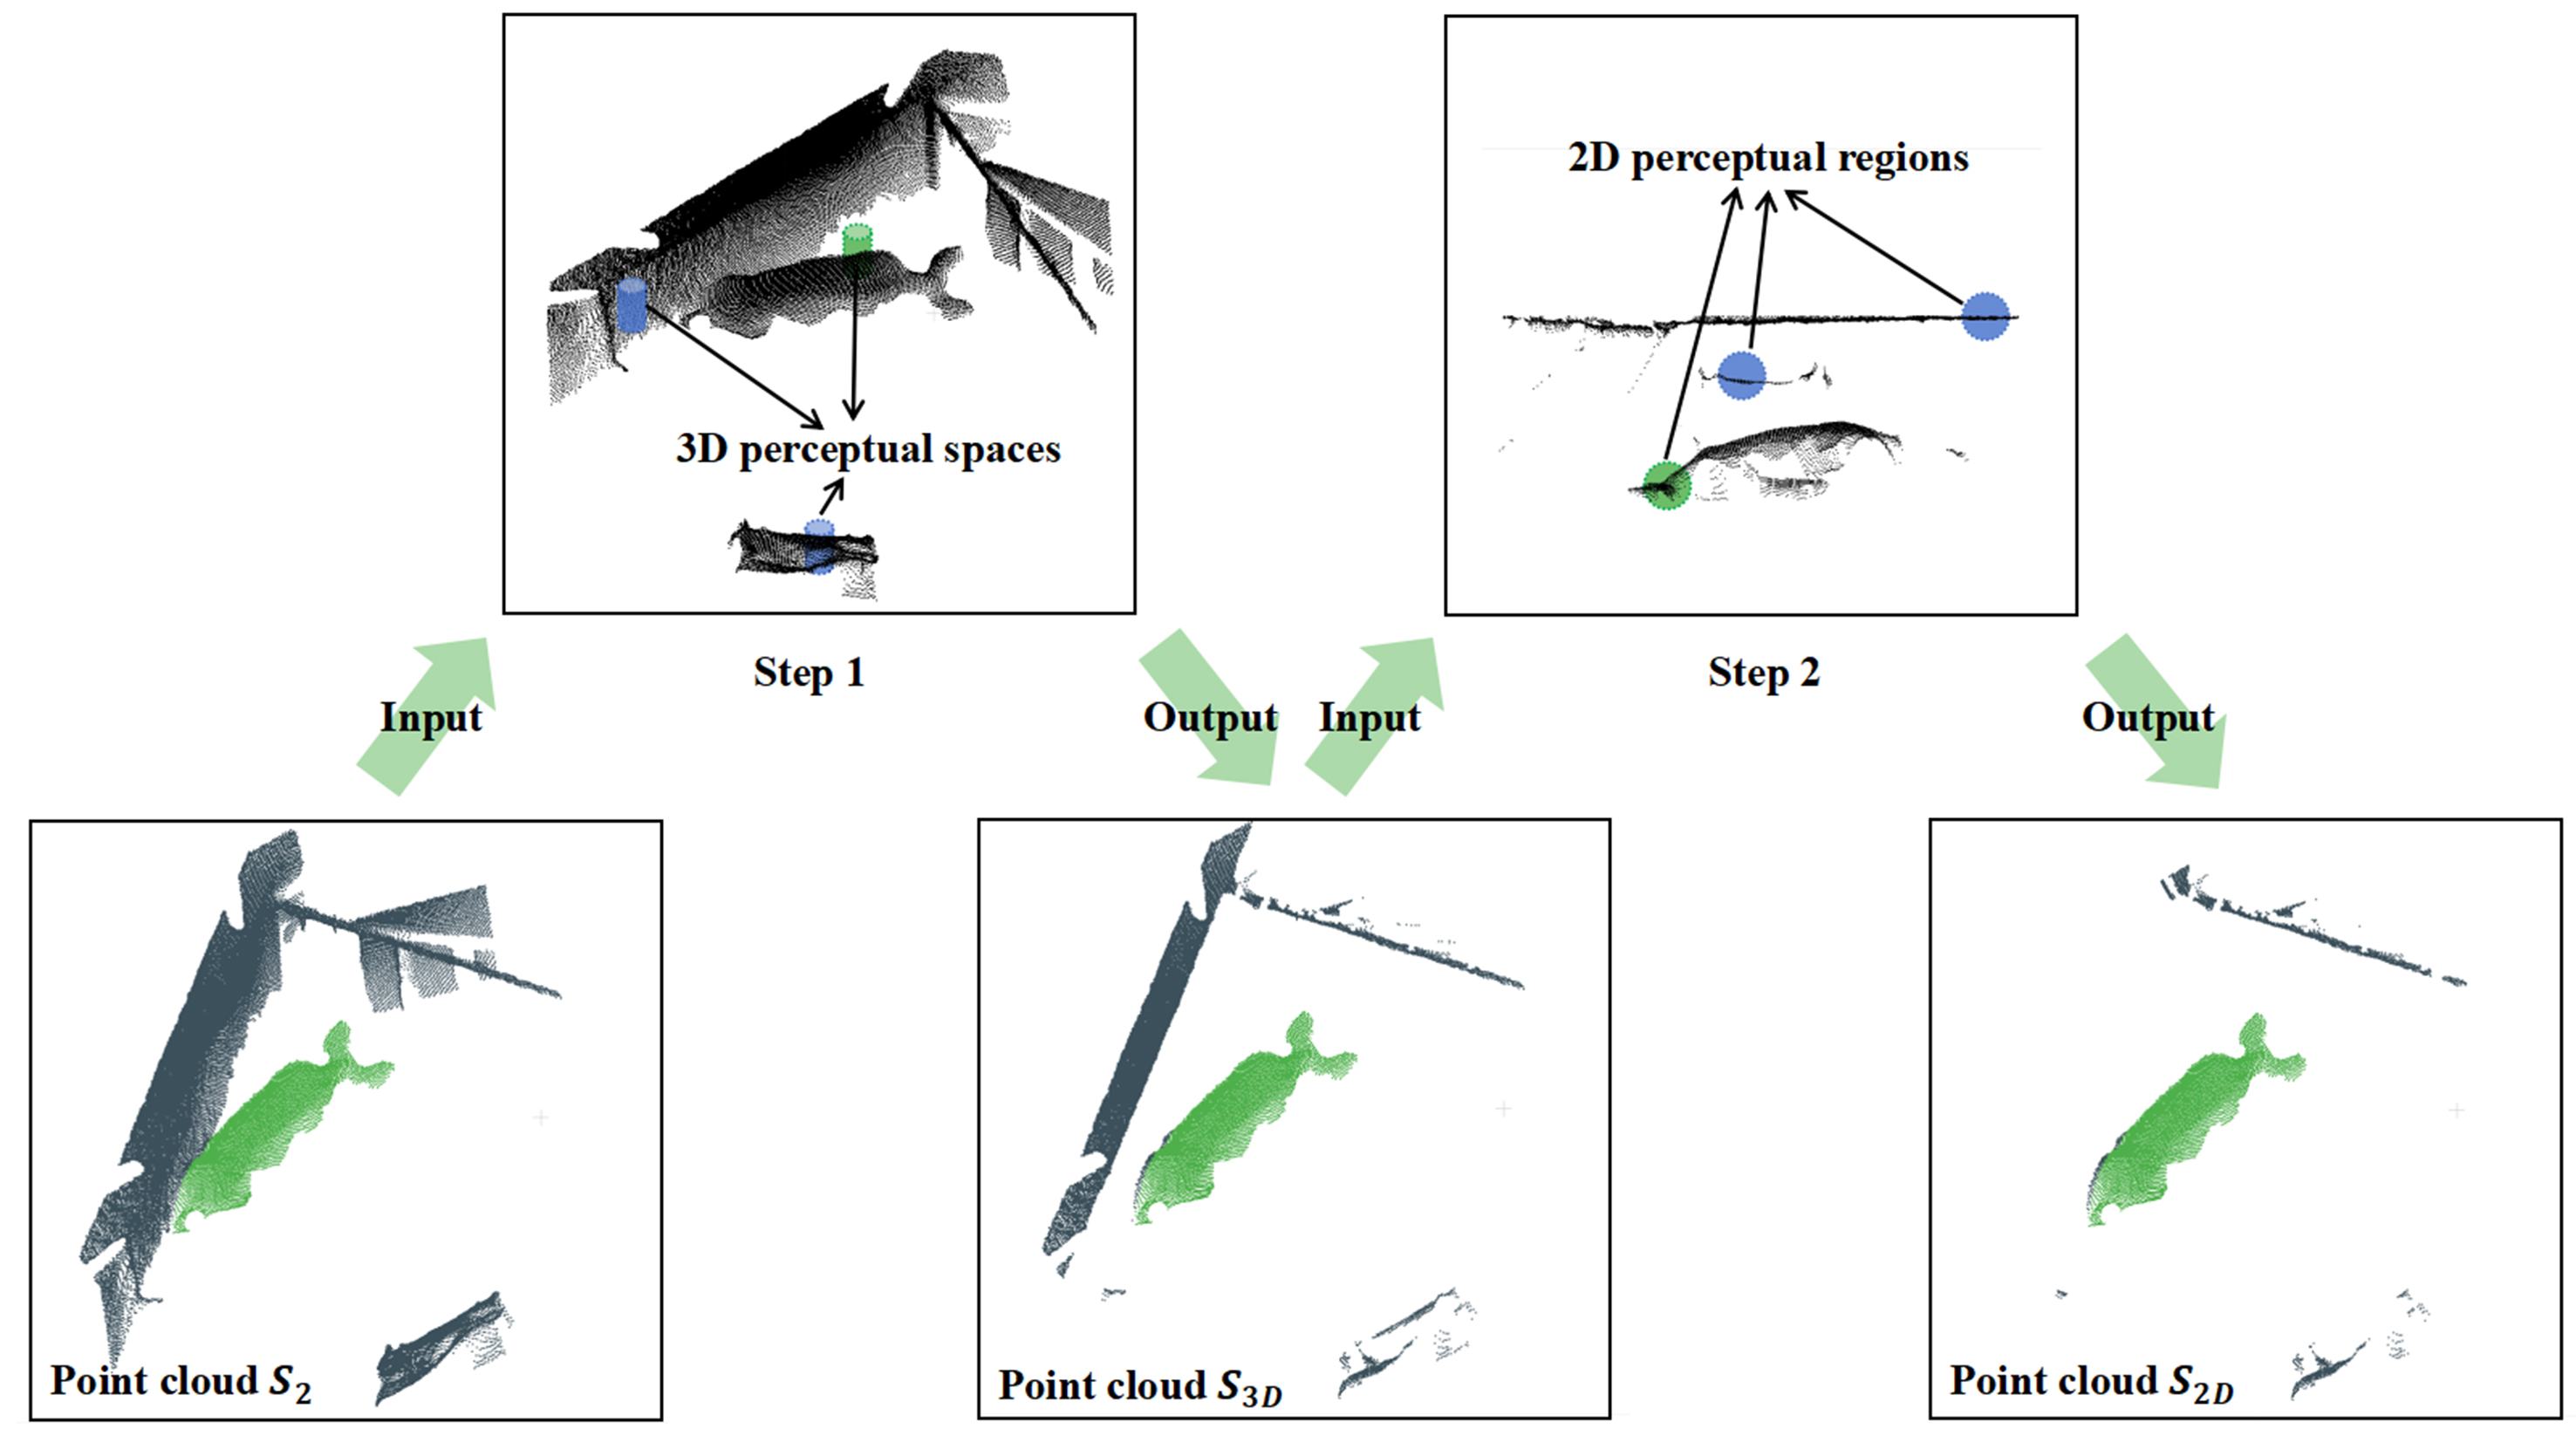
Figure 5. Flowchart of walls, railings (etc.) removal by 3D, 2D perceptual spatial filtering (module 2). S2: point cloud within region of interest obtained in the previous section, S3D: point cloud after 3D perceptual spatial filtering, S2D: point cloud after 2D perceptual spatial filtering.
2.4.1. Voxel simplification of point cloud
The point cloud data acquired by depth camera is exceedingly voluminous, demanding significant computational resources and long processing times. Voxel downsampling is employed to effectively reduce the data volume while ensuring the integrity of the target point cloud features. In this study, three sets of voxel downsampling parameters are selected to obtain point clouds of varying densities and analyze the runtime of the DPFFS algorithm. To facilitate the observation and differentiation of point cloud features within subsequent illustrations, no downsampling operation is conducted on the point clouds within the figures except for the final results. Bounding boxes are computed within the point cloud set, discretized into small voxels, each cube of the same size is defined as voxel V, and the centroid (Xc, Yc, Zc) within each V is calculated to obtain the simplified point cloud Pc after sampling. m represents the number of points within each voxel V. This chapter selects V values of 10, 20, and 30 mm for algorithmic time evaluations.
2.4.2. Noise feature analysis
In order to segment the target pig body from environmental noise, this study considers designing an identification method to transform target extraction into a binary classification task, dividing points into noise set or pig body set based on their distinct features. The perceptual box is a three-dimensional spatial cropping model based on pose constraints, its essence lies in using axis-aligned oriented bounding boxes to delineate the regions of interest for target objects in complex scenes, enabling noise suppression. Therefore, by employing the concept of perceptual boxes, perceptual spaces are constructed where point cloud features can be differentiated, each space contains few points and has high computational efficiency. To better observe the features of pig bodies and noise points, several point cloud sets of heavily interfered and noise closely adhered with pig body’s points, as well as undisturbed typical point cloud sets, are selected for analysis. As shown in Figure 6, the point cloud data corresponding to the black pig body points exhibits a uniform, dense, and smooth “single-layer” structural characteristic, this type of structure demonstrates continuity and consistency within a spatial segment along the Z-axis, with low variance. Conversely, the other two types of points exhibit more extreme characteristics in the Z-direction and the X-Y plane, The green noise region represents noise such as walls, inner and outer walls of feed troughs, and parts of the data acquisition equipment, specifically, in the Z-coordinate axis direction, these points span a large range, are densely distributed, and exhibit significant longitudinal clustering properties. The blue noise region represents noise like railings, window sills, and the bottoms of feed troughs, in this case, points exhibit a small span along the Z-coordinate axis but are densely distributed within a small neighborhood in the X-Y plane, showing distinct lateral clustering properties. The remaining yellow region comprises scattered outlier points with less prominent features. By using the concept of perceptual boxes to construct spatial structures sensitive to both longitudinal and lateral feature distributions, a task of noise points and pig bodies identification and classification can be conducted. However, during the construction process, it is not possible to construct only a single perceptual space. This is because at the boundaries of different regions, the points within the perceptual space exhibit composite features. Consequently, the two-dimensional and three-dimensional perceptual spaces and corresponding geometric constraints were ultimately constructed to amplify the distribution characteristic differences between the pig body and noise. For the point cloud noise in the green and blue regions in Figure 6 it is necessary to calculate the intra-point Z-axis spans and statistical quantities within the perceptual spaces and select appropriate threshold values to avoid misidentification and erroneous filtering of point clouds not affected by noise, as shown in Figure 6F. For the remaining sparse yellow outlier points, they can be filtered out during the utilization of clustering algorithms without requiring specific attention.
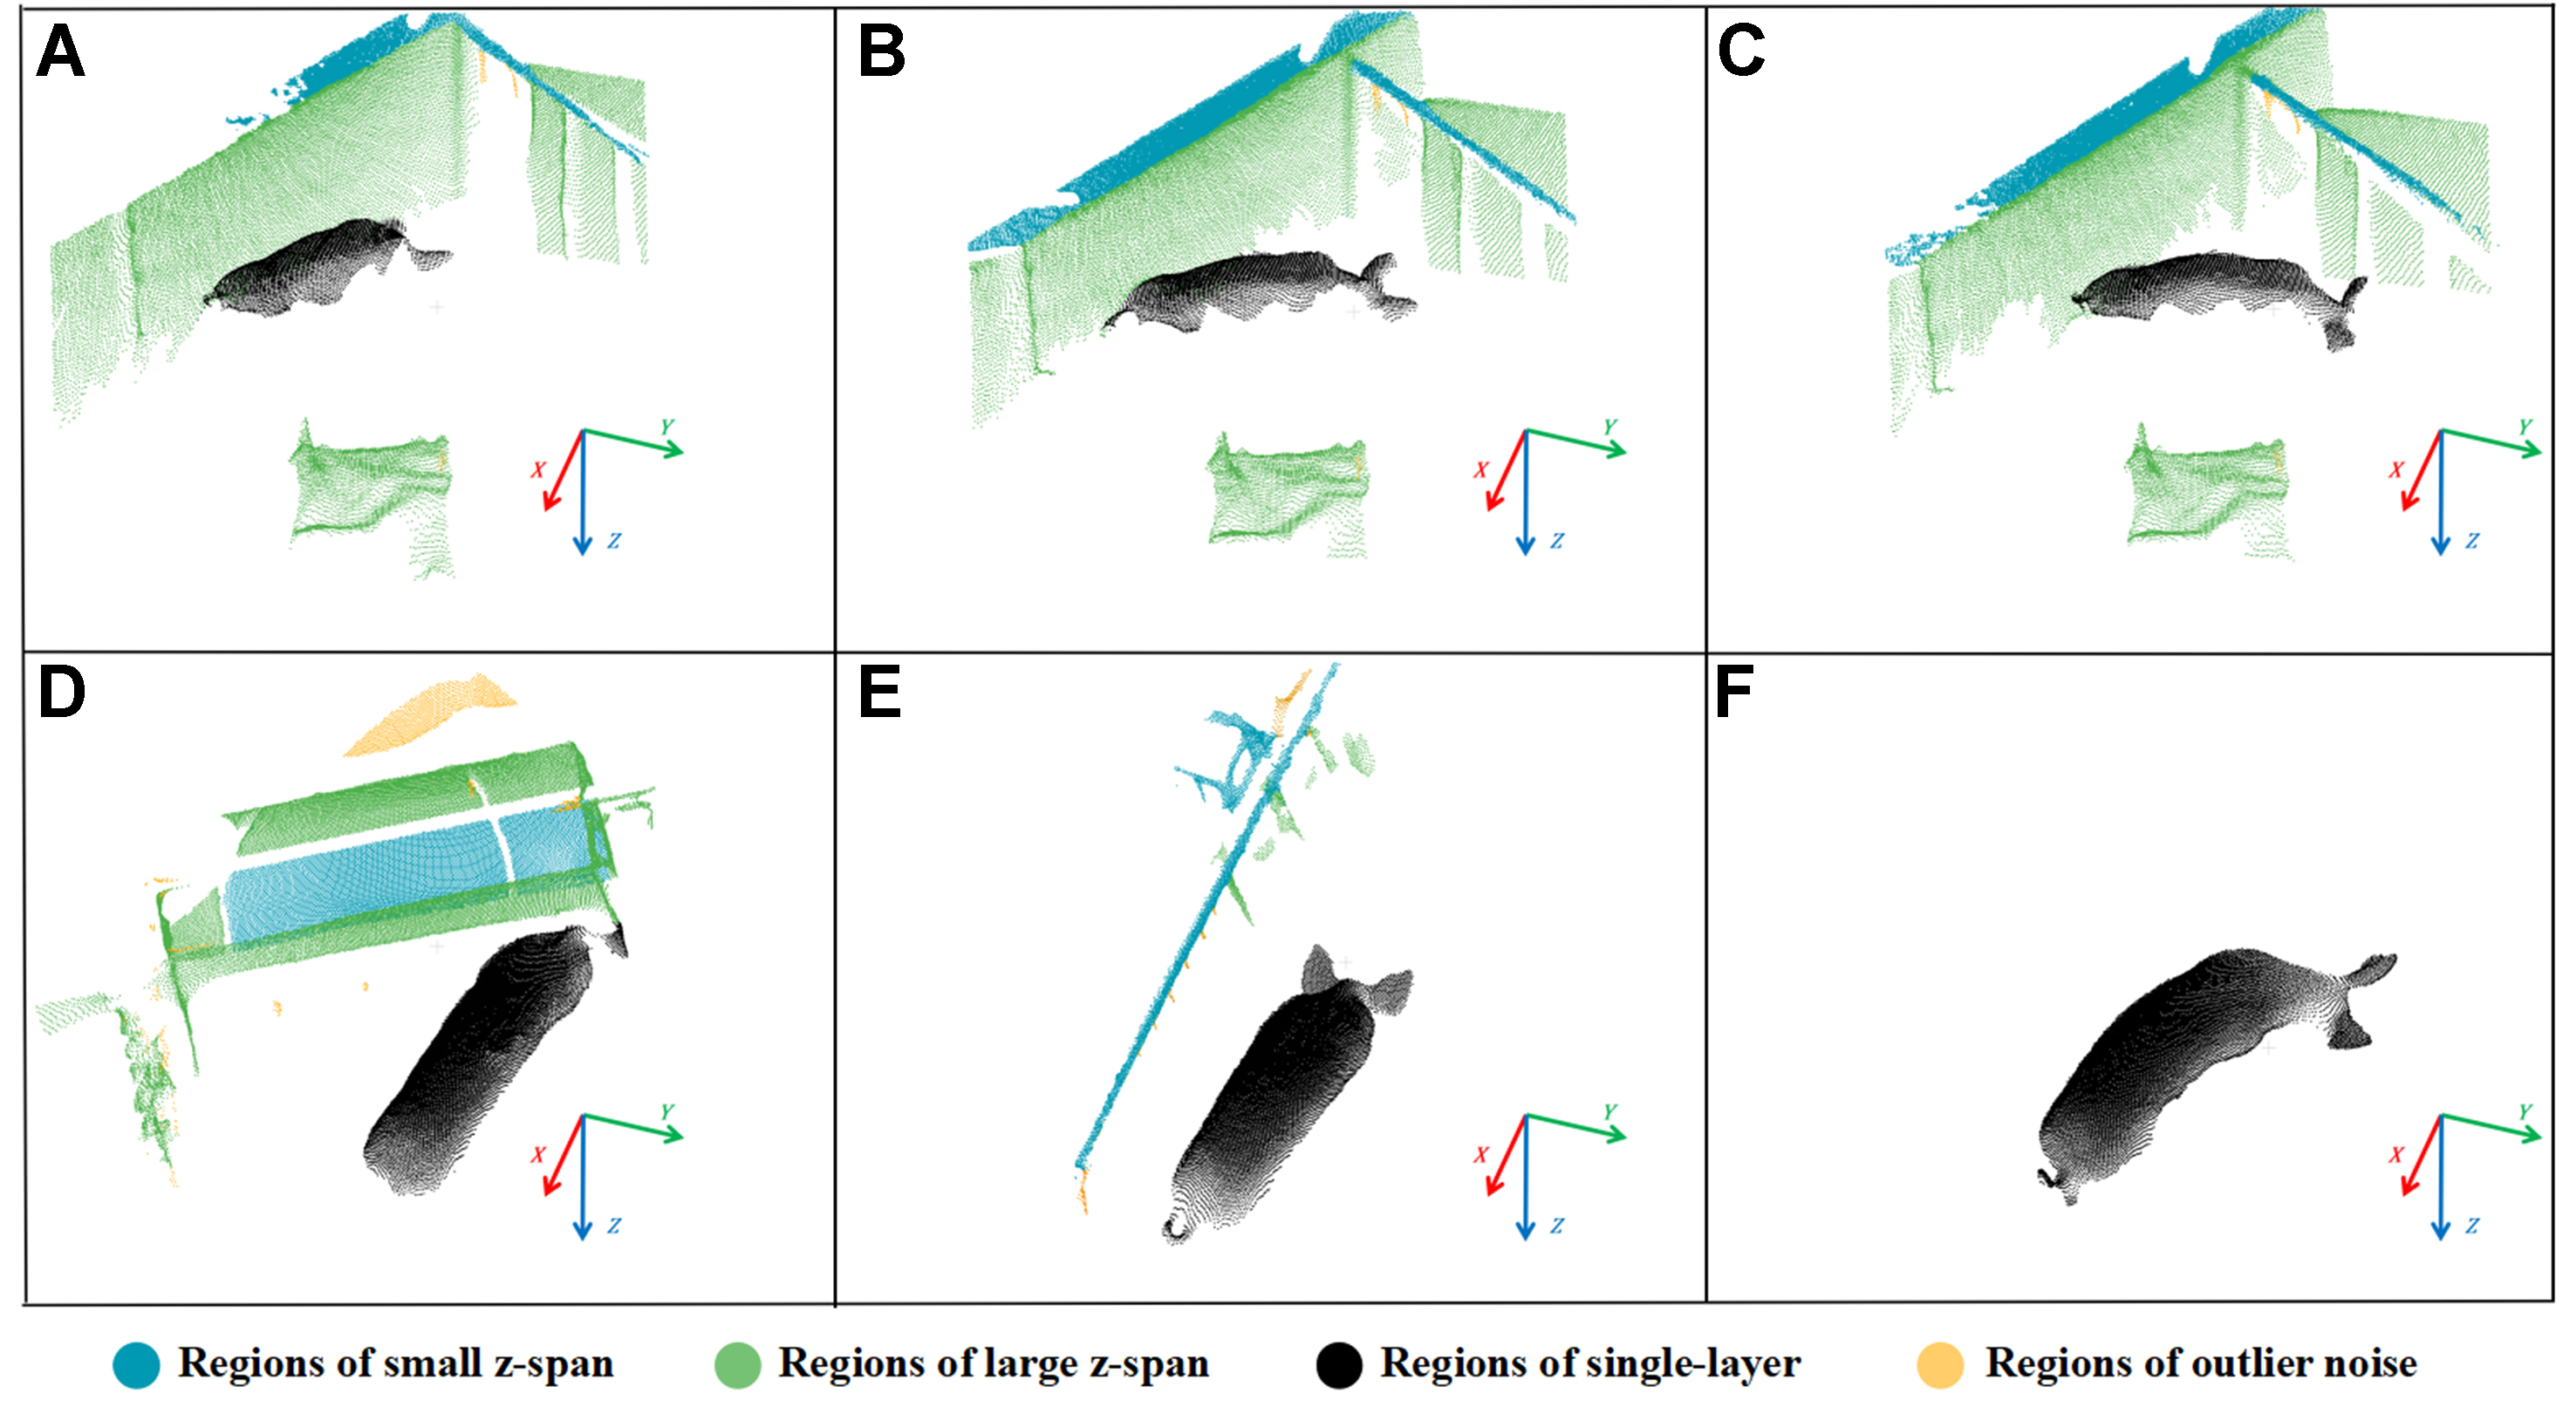
Figure 6. (A-F) Represent typical point clouds of different noise complexity, the 4 colored point regions in the figure have 4 different point distribution characteristics.
2.4.3. 3D perceptual spatial filtering
Based on the characteristics of noise points, a 3D “cylindrical” perceptual space was designed for the identification and filtering of noise points exhibiting large Z-axis spans and significant point clustering features, such as walls, inner and outer walls of feed troughs, etc. The size of the constructed perceptual space is determined based on the trade-off between computational speed and effectiveness. If the perceptual space is excessively large, the corresponding neighborhood search radius will also increase, resulting in slower computational speeds and the potential erroneous filtering of point clouds unaffected by noise. Conversely, selecting a space that is too small may lead to suboptimal filtering effects, making it challenging to remove noise adhering to the pig body point cloud. Specific parameter selections are detailed in the discussion section. The point cloud is loaded using the K-D Tree structure, traversing all points within the set S2. Each point is considered as the center point for neighborhood radius search and perceptual spaces construction, as the PCL does not directly offer a cylindrical search method within the K-D Tree structure. A cylindrical space, denoted as σ, with a radius r of 10 mm and a height h of 200 mm is constructed by code to impose geometric constraints. Within the search radius rs, all inner points Pi falling within the spatial constraint σ are counted. And the maximum and minimum Z values of these inner points are recorded to calculate the count parameter C and span parameter D. A threshold is then set for binary classification, where center points classified as noise are filtered out. The search radius rs is computed based on the constructed radius r, and the search region is the circumscribed sphere of σ. By using a radius search, a greater number of points can be encompassed in the computation, the defined cylindrical space and constraint serve to amplify the span differences in the Z-direction of inner points. Furthermore, from a top-down perspective, a circular shape at the boundaries between the two types of points contains fewer shared adhesion regions, thereby mitigating potential severe disruptions to the edges of the pig body point clouds.
Traversing each point in S2 as construction center point (XCentral, YCentral, ZCentral), search radius rs and the mathematical set form of σ can be calculated by the following Equations (10) and (11), respectively:
where σ represents the neighborhood point set that within the geometric constraint. An indicator function I is defined such that the result is 1 when Pi within the set σ and 0 otherwise. The count parameter C is ultimately calculated, where C0 in the equation represents the initial value of 0, and n denotes the number of points in the point cloud:
The span parameter D is calculated by Equation (13):
where i represents the index of inner points,
Figure 7 illustrates the construction principle of the cylindrical perceptual spaces and the method for determining inner points, which exhibits different characteristics between the pig body point cloud and the noise point cloud. When the blue cylinder σ1 is constructed at a noise point, the inner points tend to cluster vertically, with the maximum span difference nearly equal to the height h, denoted as ΔZ1 in Figure 7. In contrast, for the green cylinder σ2 constructed on a single layer of the pig body point cloud, the inner points are sparser with smaller Z differences, indicated as ΔZ2 in Figure 7. It is evident from the figure that ΔZ1 is significantly greater than ΔZ2, consequently, the count parameter C and span parameter D for σ1 are both greater than those for σ2. By combining C and D as filtering criteria, the removal of center points is executed when the inner points of σ satisfy C ≥ 50 and D ≥ 50 mm.
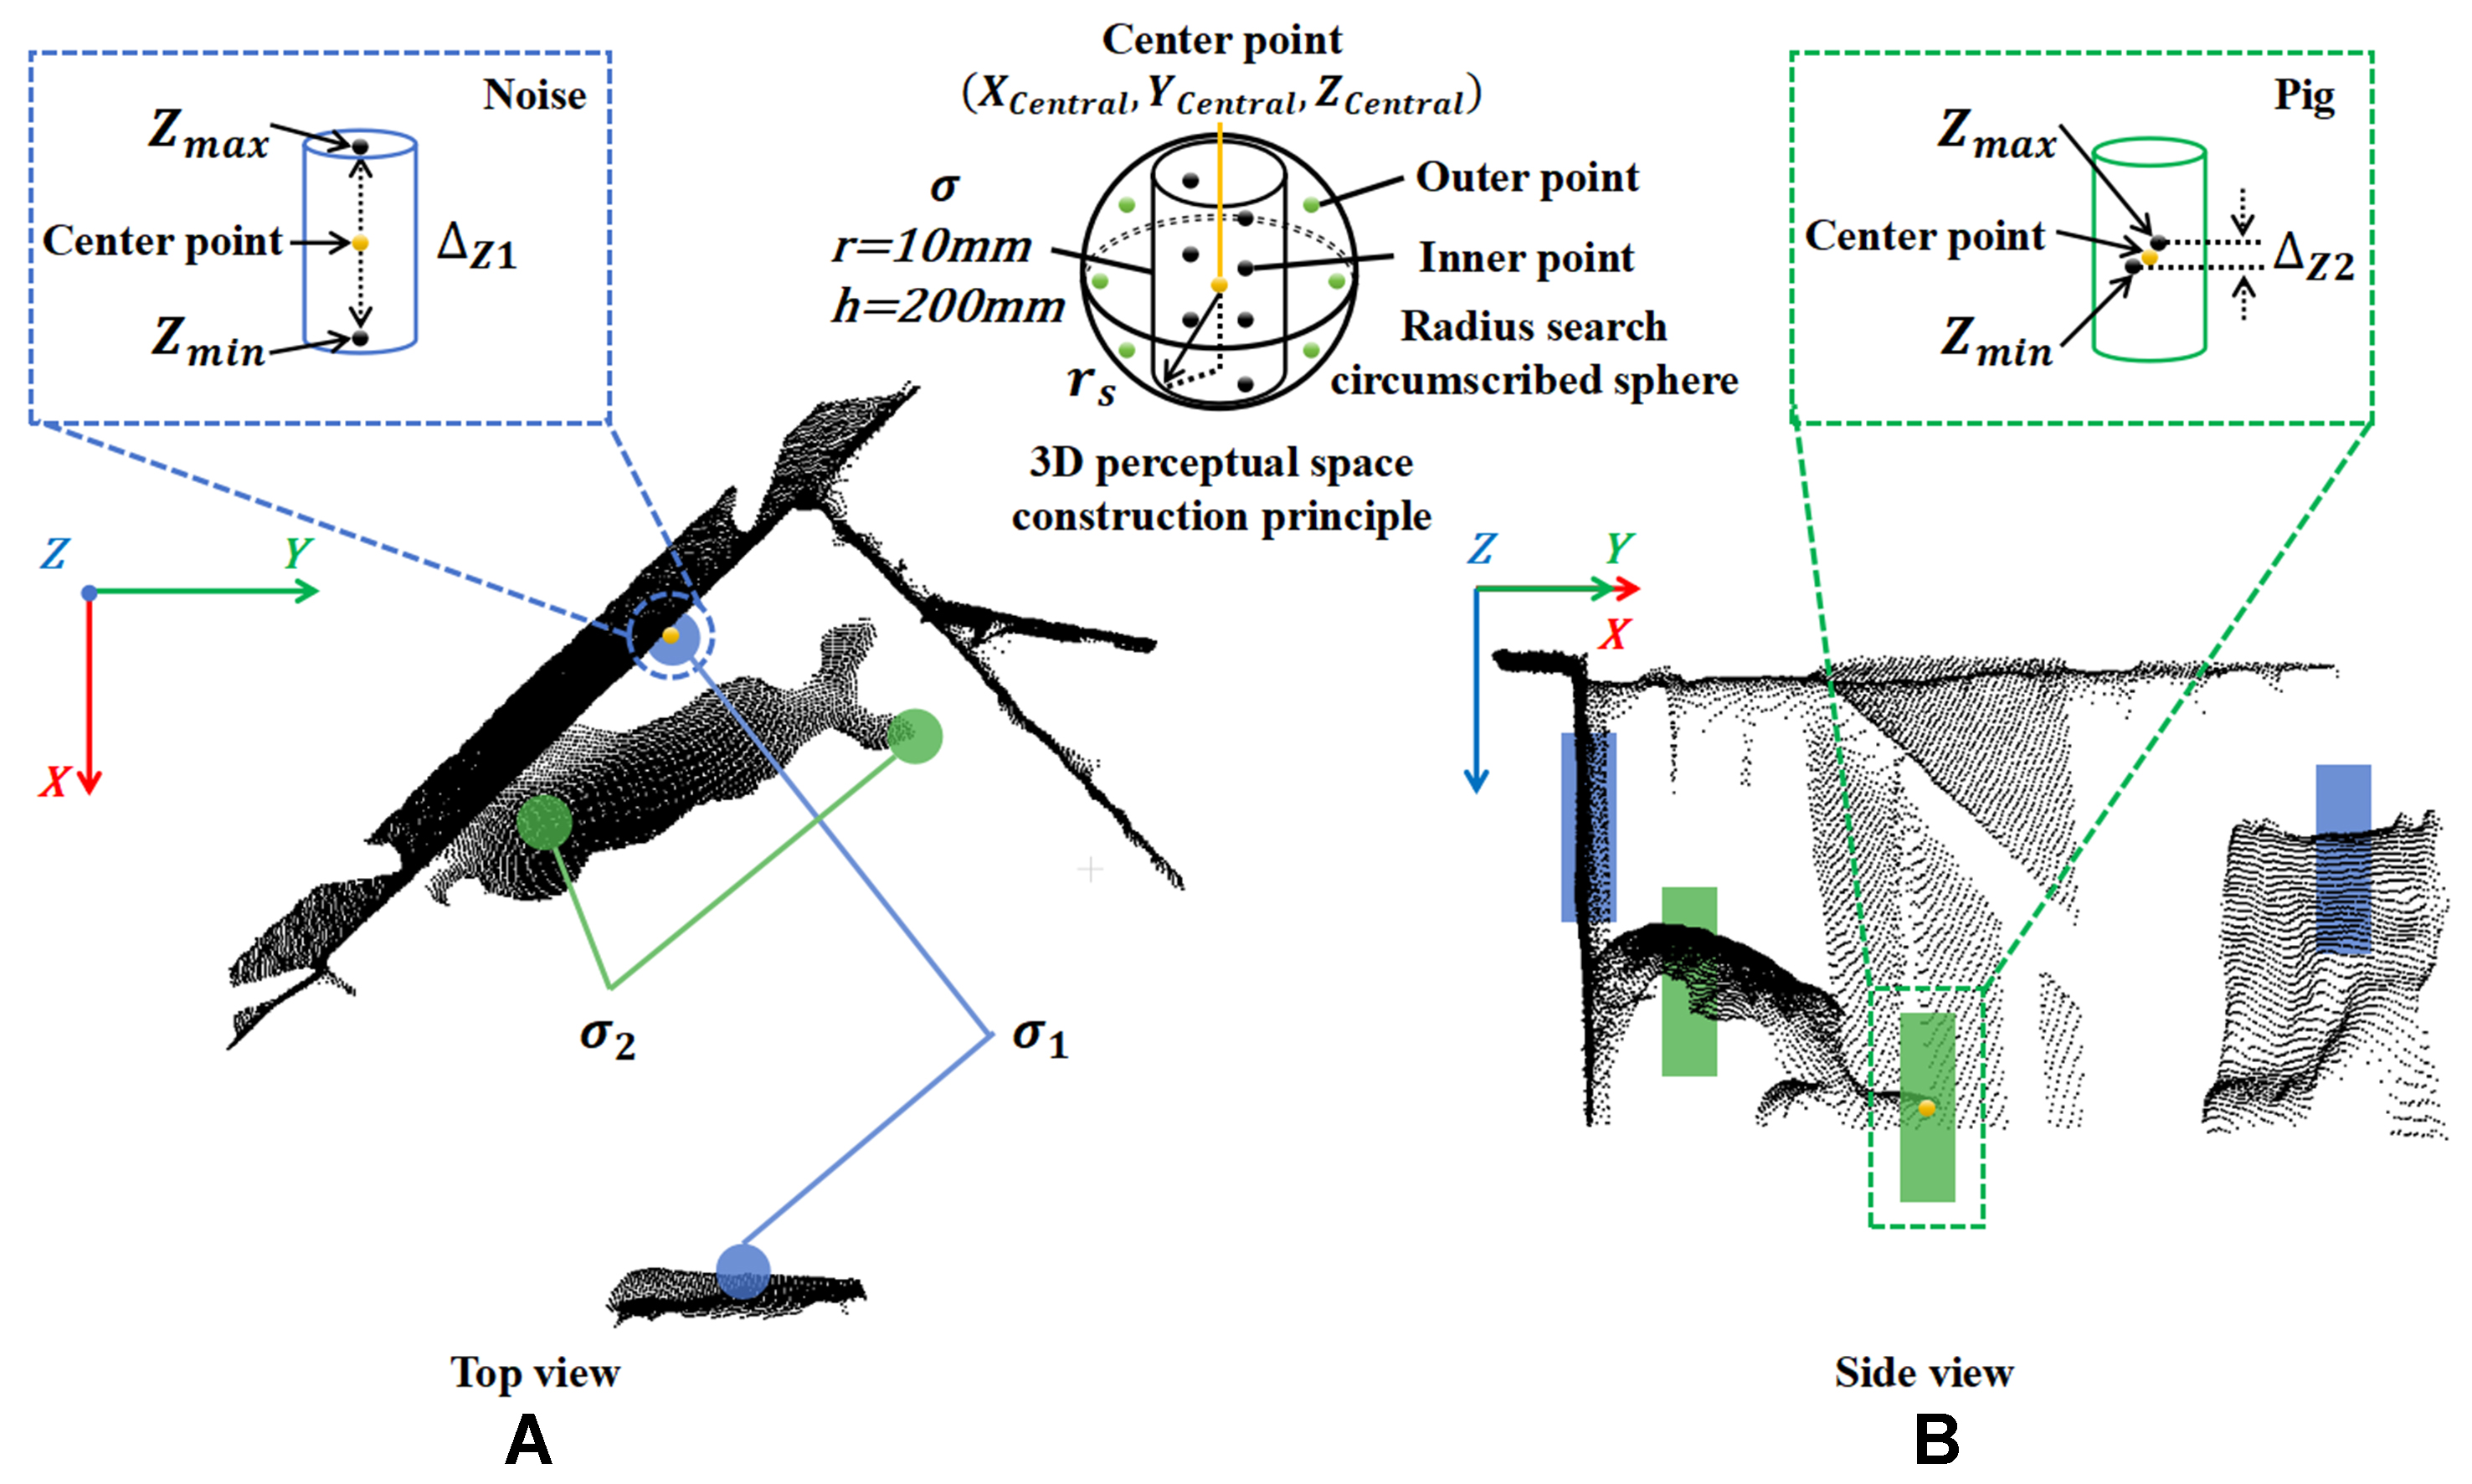
Figure 7. 3D perceptual spaces construct method and different inner points characteristics of σ when constructed in noise or pig body points. (A) Observe the construction of 3D perceptual spaces from the top perspective; (B) Observe the construction of 3D perceptual spaces from the side perspective.
In summary, the method flow is to traverse the point cloud, selecting the current index point as the construction center point (XCentral, YCentral, ZCentral) based on its actual coordinates XCentral, YCentral and ZCentral, followed by the construction of a perceptual space and geometric constraint. The coordinates of all inner points within the constraint are calculated. If the C and D criteria are met, the center point is removed from the point cloud, otherwise, it is skipped. This process continues iteratively until all index points have been traversed. The pseudocode of the program logic design is depicted in Figure 8.
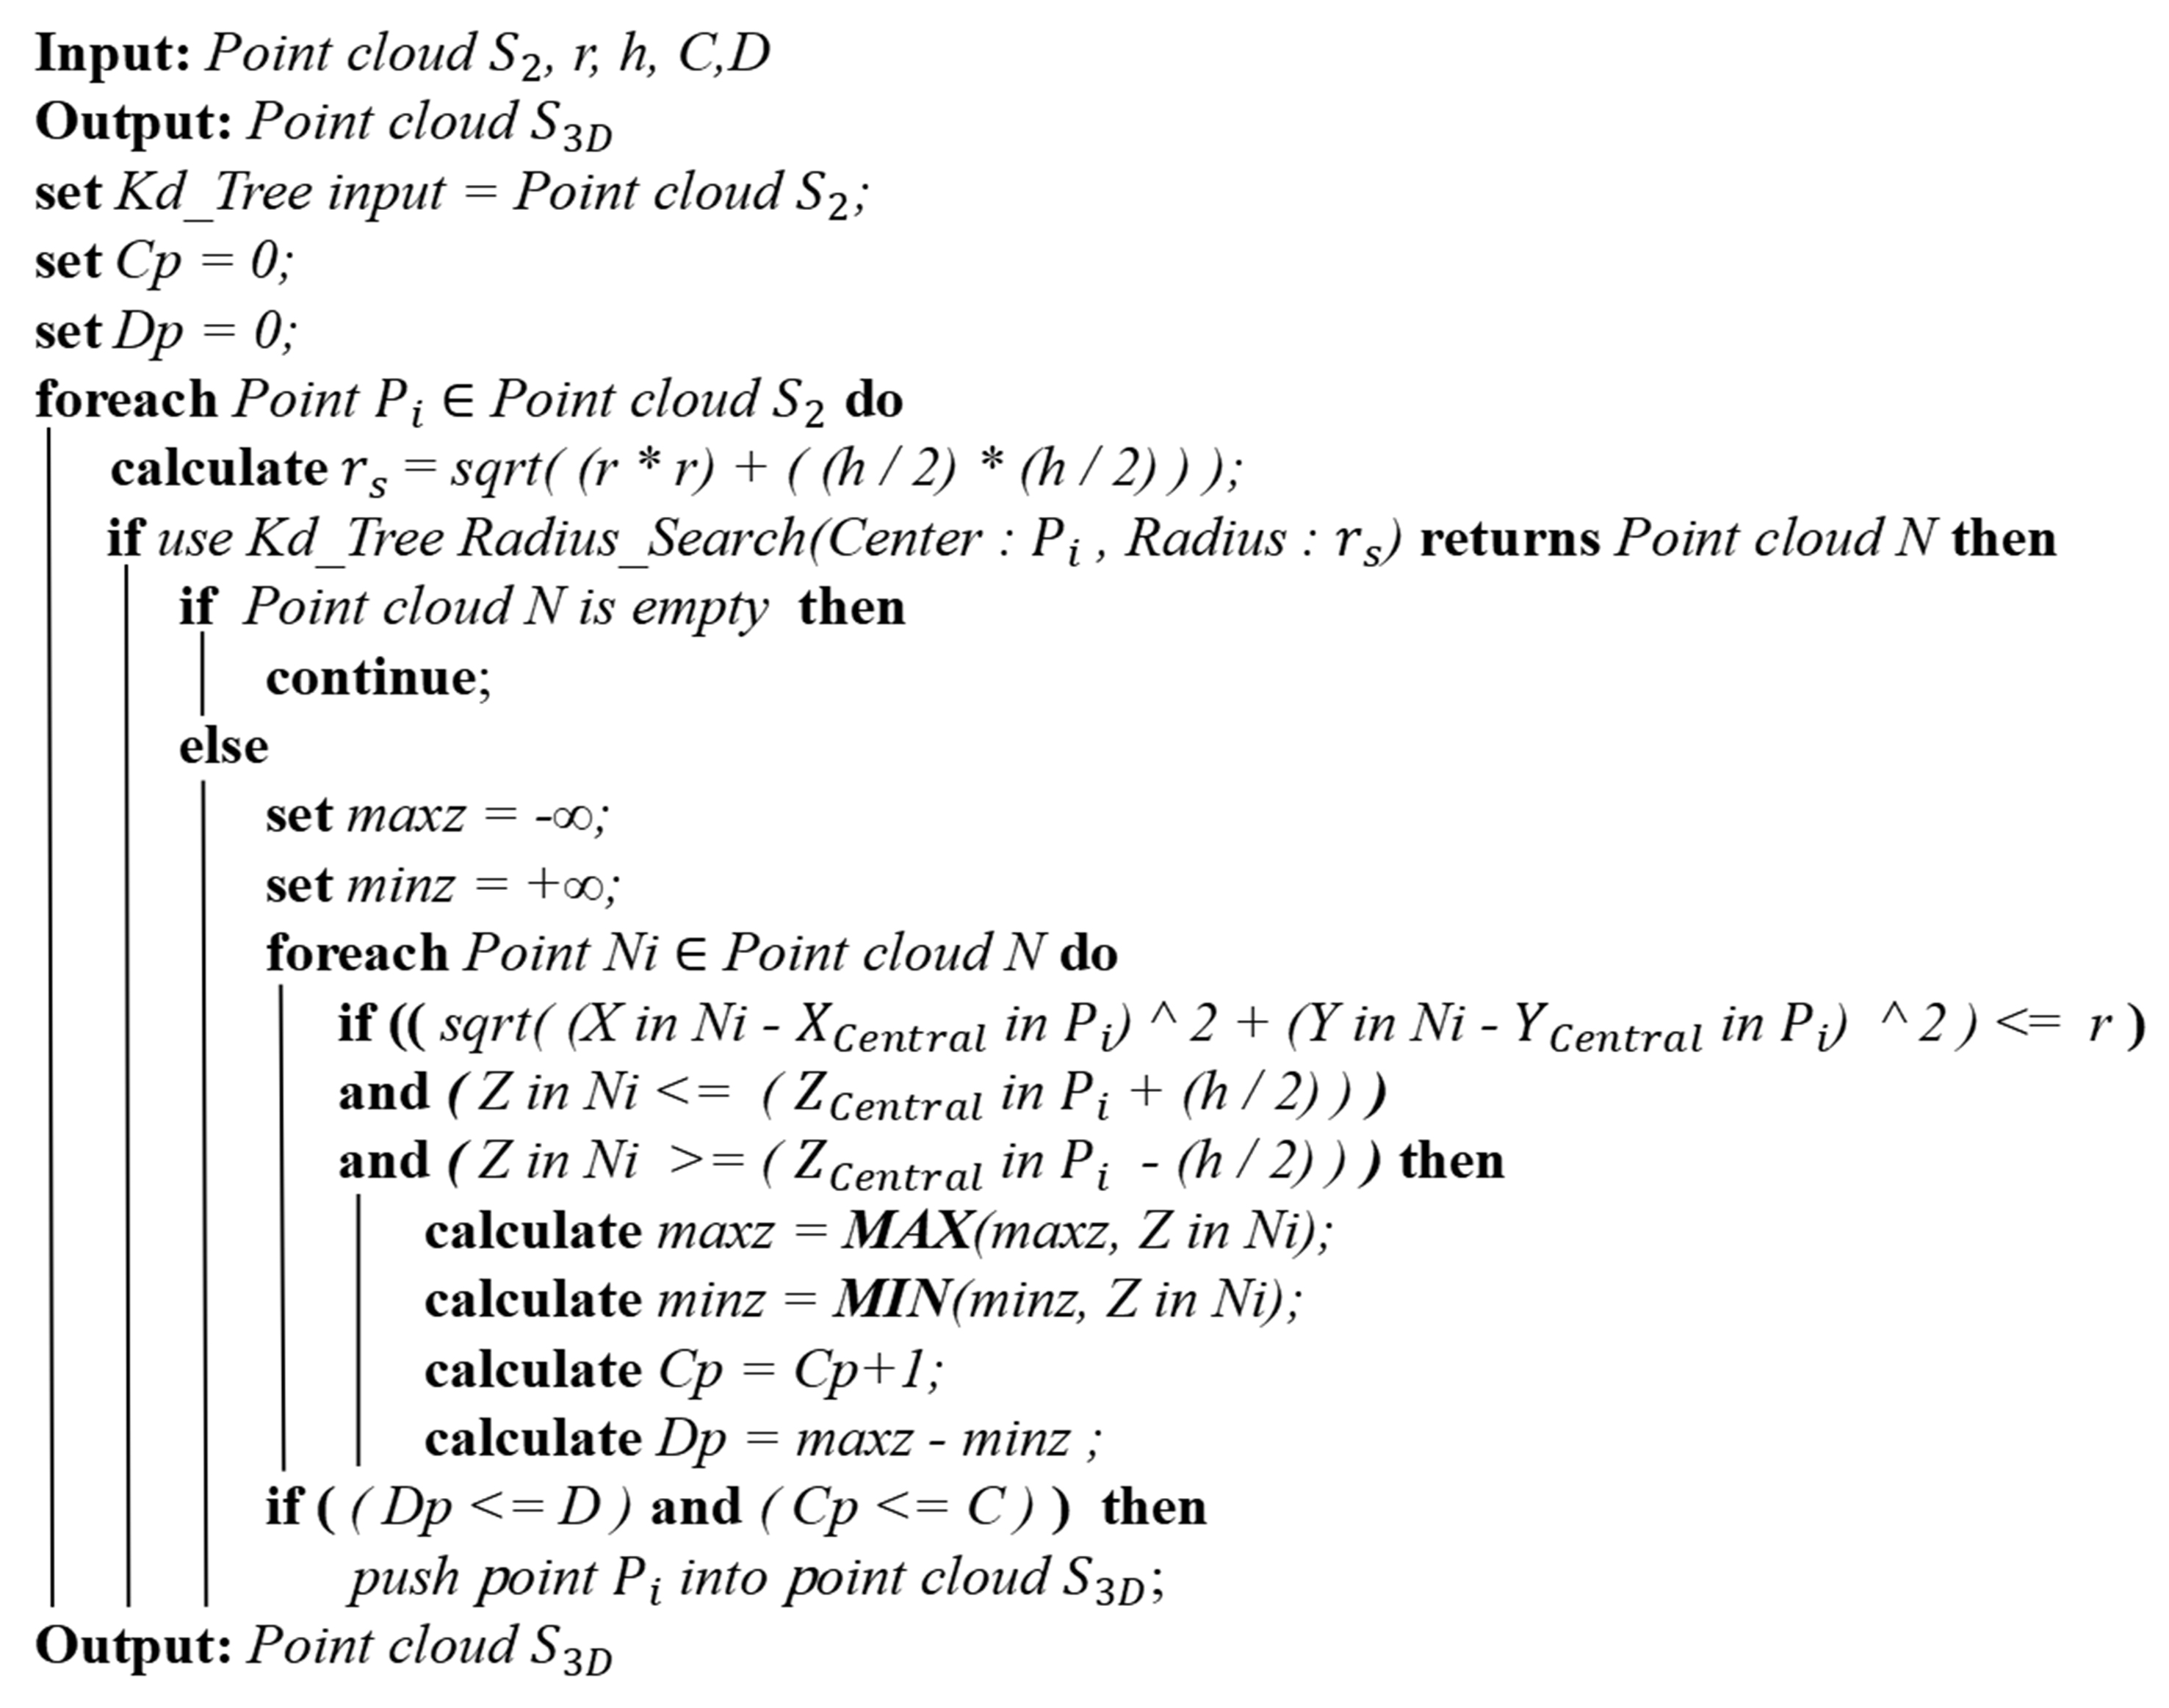
Figure 8. 3D perceptual spatial filtering program pseudo-code.
2.4.4. 2D perceptual spatial filtering
The 3D perceptual spatial filtering method is unable to handle point clouds exhibiting clustering characteristics in the X-Y plane direction. Consequently, a 2D “circular” perceptual region was devised to address this limitation. Within the plane resulting from the dimension reduction projection of the point cloud, this method identifies and eliminates noise characterized by a small Z-direction span but a significant concentration of points within a short height neighborhood, such as railings, window sills, and trough bottoms. When constructing the 2D circular perceptual region ρ, the dimensions should be larger to encompass a larger number of points. This facilitates the amplification of feature differences for better distinction between noise and pig body point, and helps mitigate false filtering. The potential for erroneous filtering arises from point cloud sets that are not affected by noise, primarily representing the pig’s body. Additionally, the natural posture of the pig results in a smaller Z-direction span of the point cloud at the pig’s back edge, a smaller ρ value may lead to the mis-filtering of these edges. Therefore, a construction diameter of 100 mm was selected for ρ to cover a larger lateral area of the pig’s back during side projection.
In the preceding section, the point cloud set S3D was calculated. Subsequently, with its point cloud X coordinates set to 0, all points were projected onto the Y-Z plane as shown in Figure 9A. Utilizing the K-D Tree structure, the point cloud was loaded and traversed, conducting a nearest neighbor radius search with each point cloud serving as a construction center point. Following the data transformation into 2D, the search region coincided with the perceptual region, enabling the direct construction of geometric constraint ρ using the search radius. While r was chosen to be 50 mm, the process involved counting all inner points Pi falling within the perceptual region ρ, simultaneously recording the maximum and minimum Z values of these inner points to derive the count parameter C and span parameter D. The rationale for selecting a circular rather than a rectangular geometric constraint lies in the circular shape’s better alignment with the search region, offering a larger area of coverage. In contrast, choosing a rectangular constraint would result in the search area being the circumscribed circle of the rectangle, potentially causing point omissions at the edges.
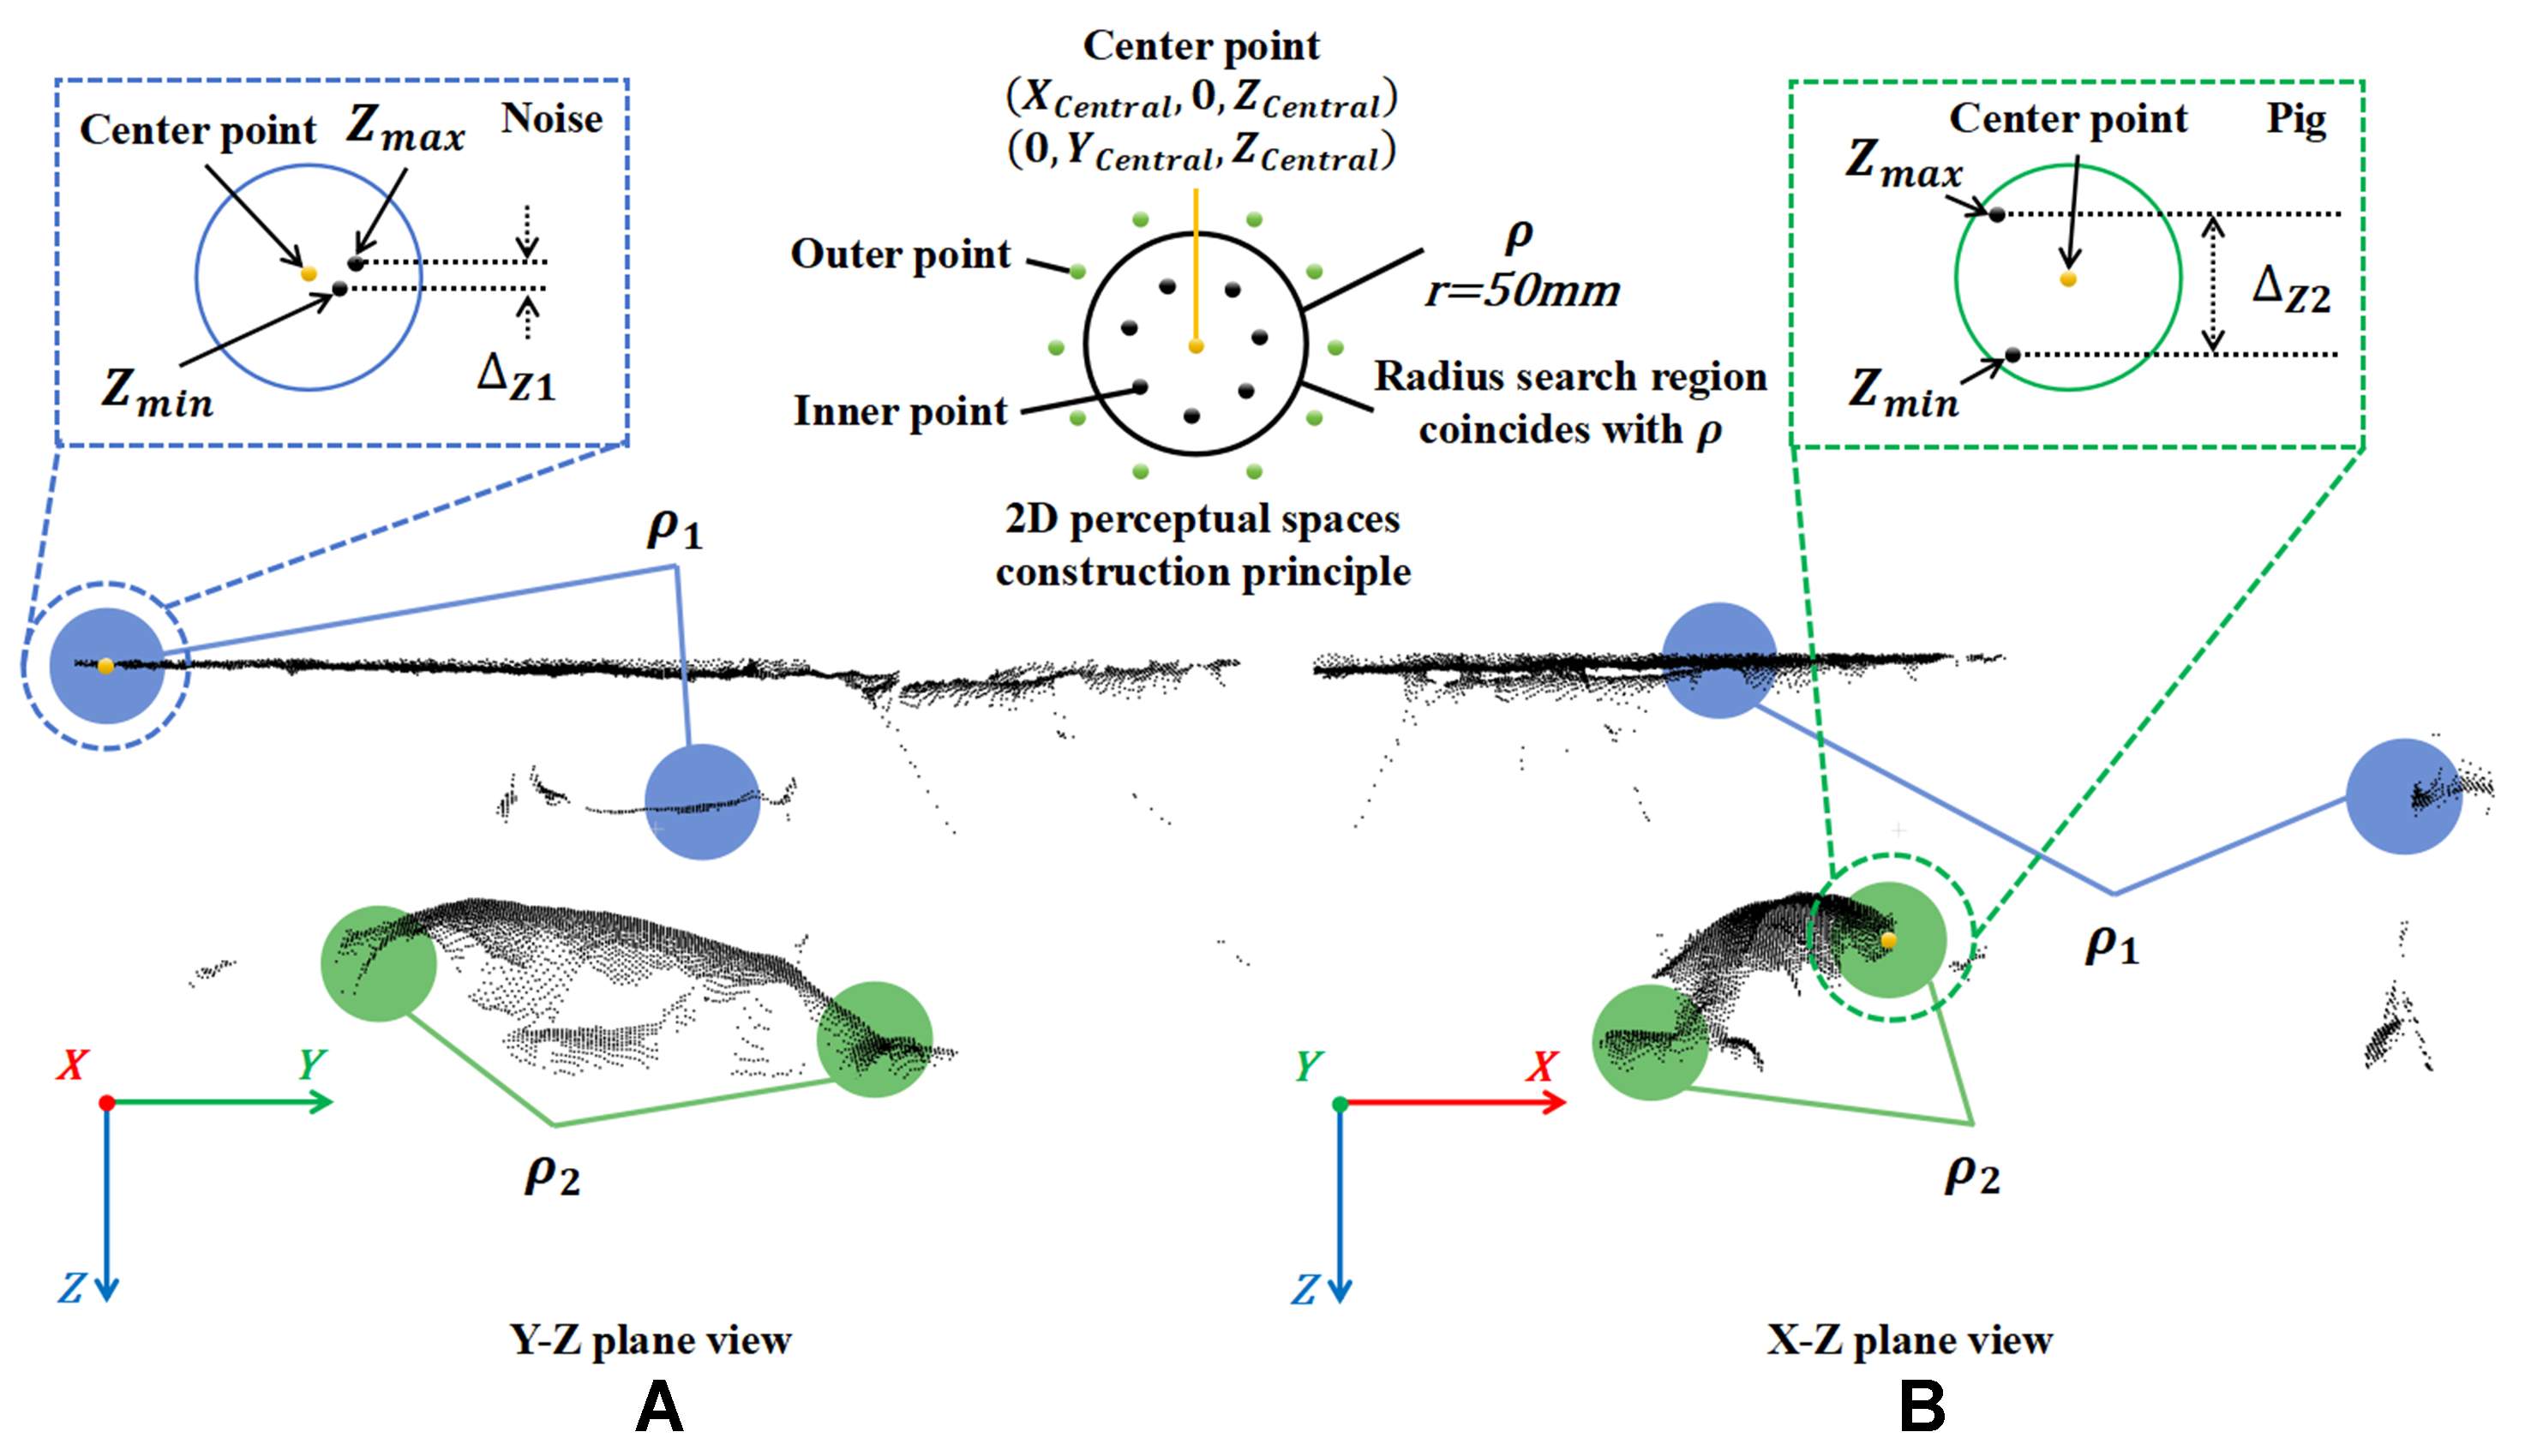
Figure 9. 2D perceptual regions construct method and different inner points characteristics of ρ when constructed in noise or pig body points. (A) Observe the construction of 2D perceptual regions from the Y-Z plane perspective; (B) Observe the construction of 2D perceptual regions from the X-Z plane perspective.
Traversing each point in S3D as construction center point (0, YCentral, ZCentral), the mathematical set form of ρ can be calculated by the following Equation:
In the above equation, ρ represents the neighborhood point set that within the geometric constraint. The same indicator function I is used to calculate the count parameter C. While C0 in the equation represents the initial value of 0, and n denotes the number of points in the point cloud:
The span parameter D is calculated:
i represents the index of inner points,
Figure 9 illustrates the two projection steps and the construction method of the circular perceptual region ρ, the inner points in space still exhibit different characteristics. When constructing the blue region ρ1, the inner points demonstrate a small Z-direction span and clustering in the X-Y direction, denoted as ΔZ1. Conversely, for the green region ρ2, the pig’s back exhibits a certain curvature, allowing ρ2 to encompass more points. The Z difference for ρ2 exceed ρ1, as indicated by ΔZ2 being greater than ΔZ1. The combined conditions of C and D are employed for filtering, specifically, when the inner points of ρ satisfy C ≥ 20 and D ≤ 40 mm, center point will be removed.
In summary, the method flow is to project S3D onto the Y-Z plane, traversing the point cloud, selecting the current index point as the construction center point (0, YCentral, ZCentral) with YCentral and ZCentral representing the actual coordinates of the point. Subsequently, perceptual regions are constructed, calculating the coordinates of all inner points within the region. If these points satisfy the criteria C and D, the center point is removed from the point cloud, otherwise, it is skipped. This process continues iteratively until all index points have been traversed, then the remaining points are projected onto the X-Z plane, and the aforementioned steps are repeated. Finally, all remaining points are matched with the S2 set, and the corresponding Y and X coordinates of points with identical coordinates are assigned their original values. The pseudocode of the program logic design is depicted in Figure 10.
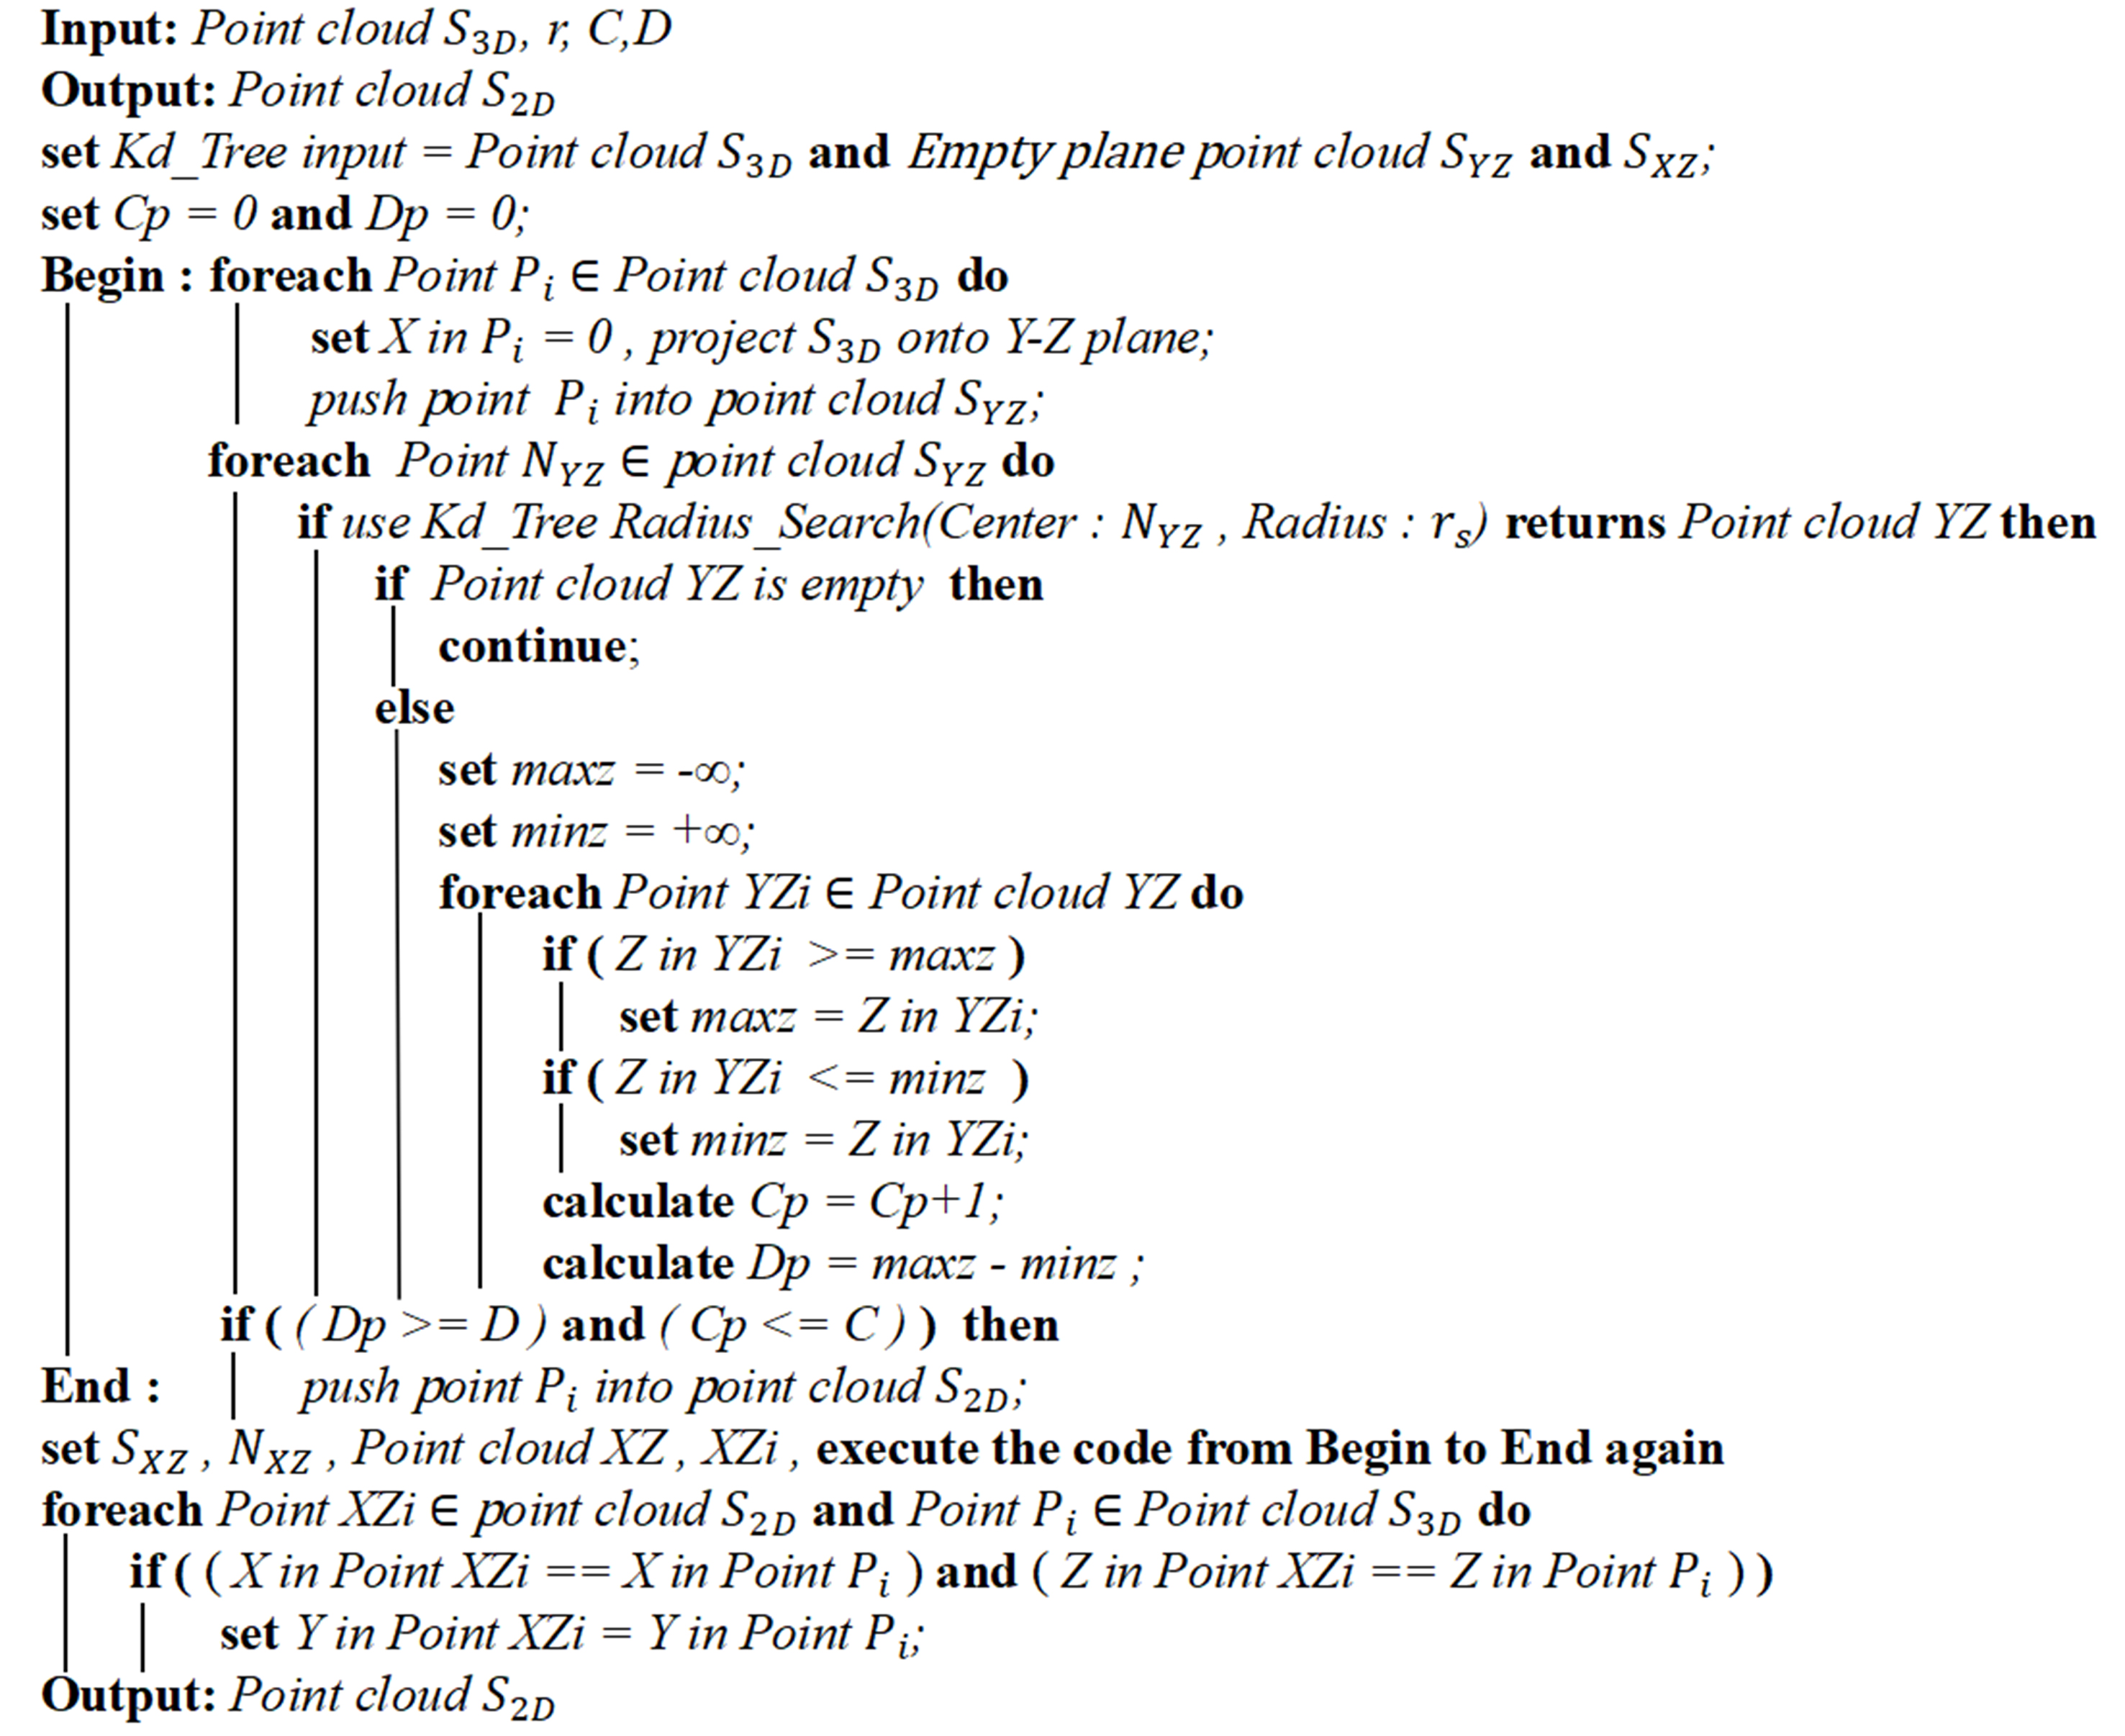
Figure 10. 2D perceptual spatial filtering program pseudo-code.
2.5. Pig body point cloud target extraction
Following the filtration of distinct geometrically shaped point cloud noise by the two key modules, some scattered outliers or point clusters with indistinct geometric features remain. The final extraction of the pig body target is achieved through the employment of the DBSCAN. Clustering algorithm involves two crucial parameters: the neighborhood radius and the number of points within a cluster. The neighborhood radius is defined as the Euclidean distance Dist(p, q), where p represents the selected cluster center point and q is the point within the Dist neighborhood, including core points, noise points, and boundary points. The number of points within a cluster is determined by calculating the count of core points within cluster Ci. According to the characteristics of the remaining points in the point cloud, where the pig body appears uniform and dense while noise clusters are sparse and dispersed, a relatively small Euclidean distance Dist of 50 mm is set. This choice aims to preserve the integrity of the pig body, particularly the pig ears and pig tails, and effectively filter out outlier clusters. For all points Pi(Xi, Yi, Zi) within the point cloud S2D and their neighbor points Pj, the final target pig body point cloud cluster PF is calculated:
In the above equation, Ci represents all clusters within the S2D (Perceptual spatial filtered point cloud obtained in the previous section) that satisfy the Dist condition, Dist(Pi, Pj) represents the Euclidean distance of center points Pi and neighborhood points Pj, and the Pj points meeting the criteria are considered as core points. PF represents the largest cluster that meets the Dist condition.
3. RESULTS
3.1. Noise filtering results
3.1.1. Ground denoising results at different heights
To evaluate the dynamic noise removal effect of module 1 on ground noise, point cloud datasets collected at three different heights of 1,680, 1,780, and 1,880 mm were selected for comparative experiments. By analyzing the distribution characteristics of point cloud quantities within Z-direction slices, we observed that the original point cloud data exhibited significant peak in point distribution in the vicinity of the ground before filtering, as shown in Figure 11A. The slice region containing the counting-peak (ground noise) was effectively eliminated after filtering, concurrently filtering out point clouds from non-critical areas above the pig body as shown in Figure 11B. The experiment showed that module 1 of the DPFFS algorithm can achieve adaptive dynamic filtration of ground noise at different heights, exhibiting a high level of processing efficiency.
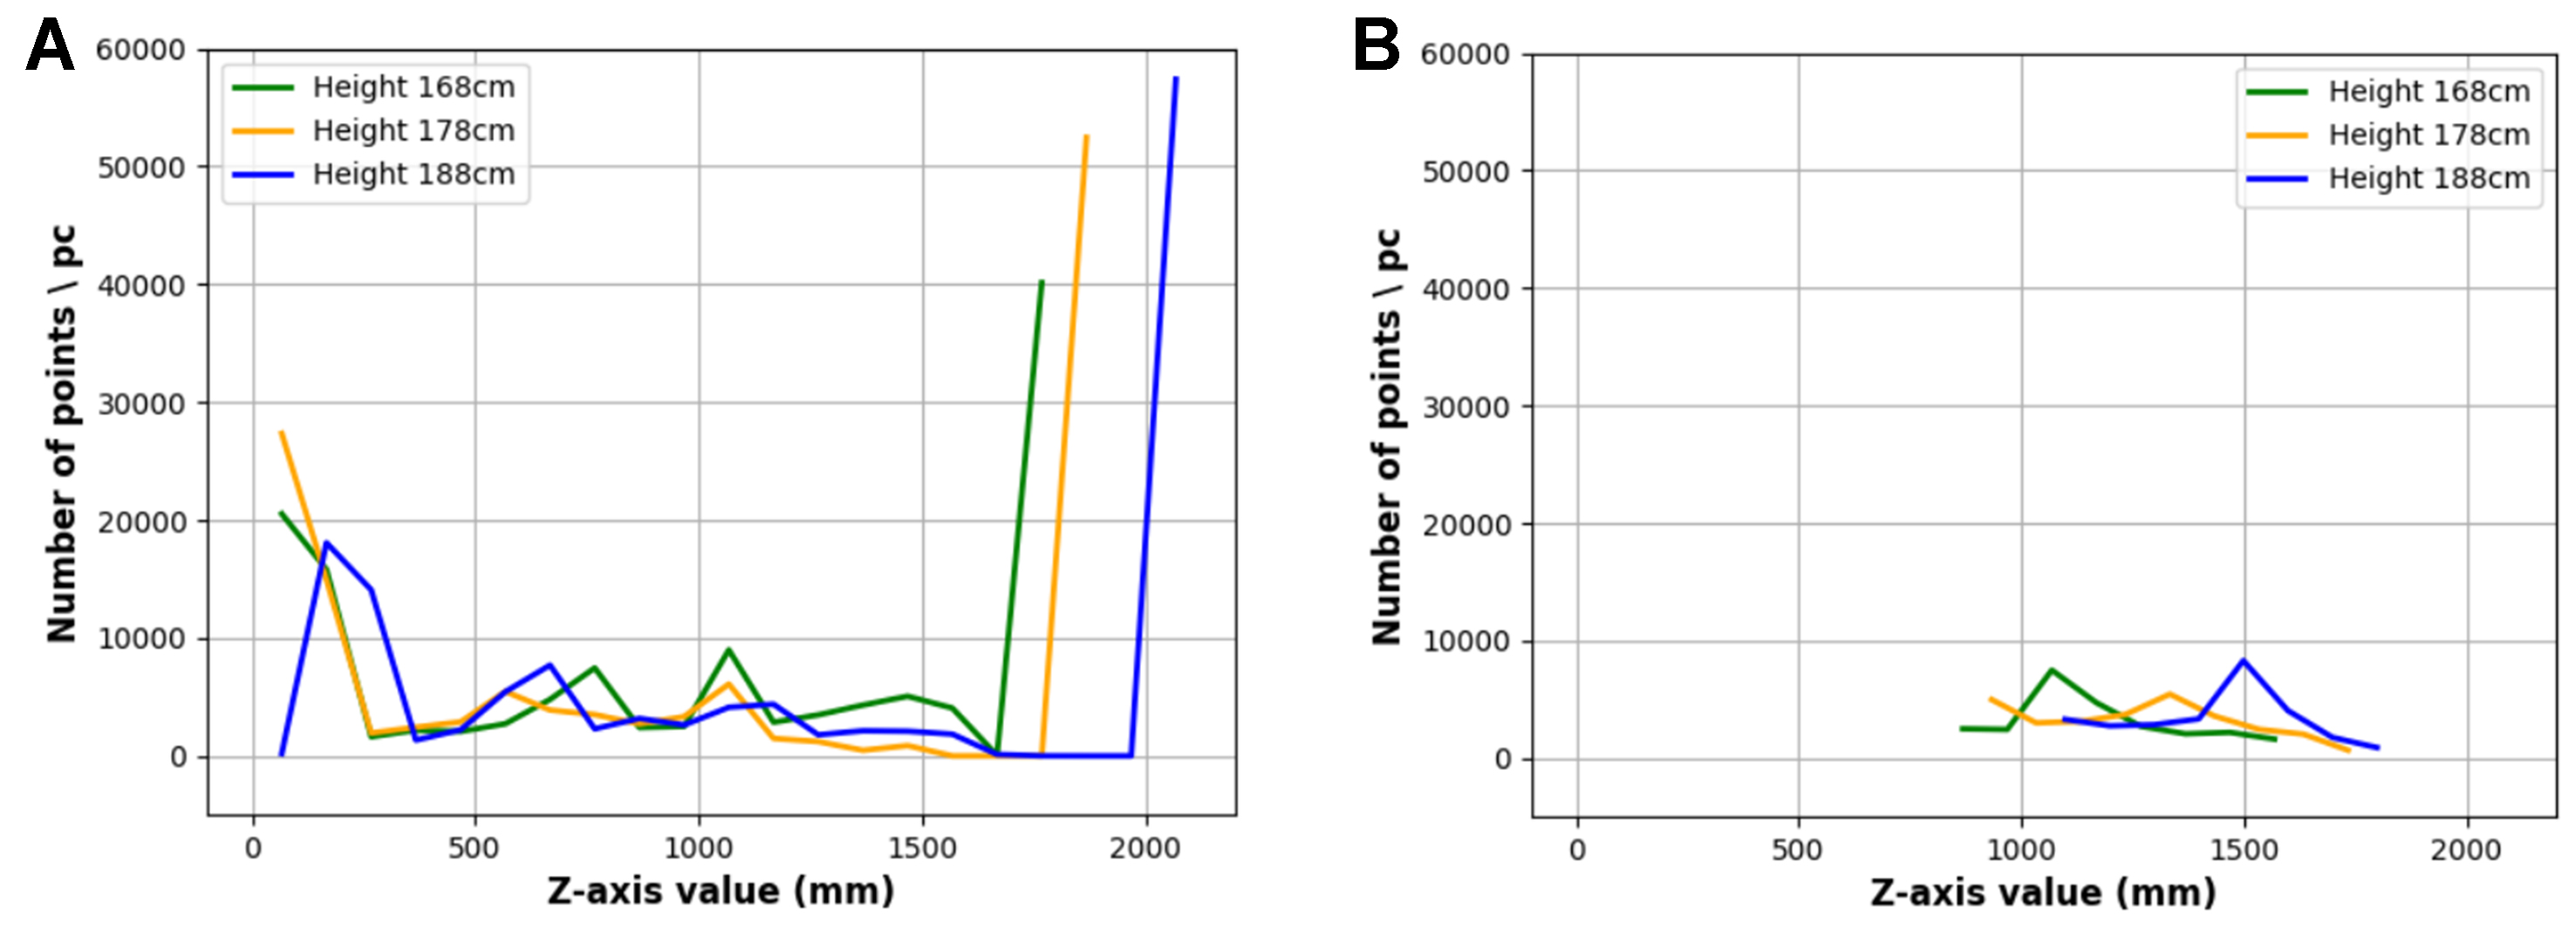
Figure 11. Distribution of points in every slices before and after filtering. (A) Distribution of point cloud points before module 1 filtering; (B) Distribution of point cloud points after module 1 filtering.
3.1.2. Denoising rates for different interference complexities
Significant differences in noise interference levels existed among different point cloud groups, compounded by variations in pig weights and sizes, resulting in distinct size and density distributions of clusters within the point cloud. Consequently, the algorithm needed to simultaneously satisfy two key requirements under a unified parameter configuration: (1) effectively denoise point clouds with high noise interference levels and (2) avoid excessive filtration of point clouds with low noise interference levels. To objectively quantify the denoising performance and robustness of the algorithm, the denoising rate (DR) was introduced as a core evaluation metric. The 6 sets of point clouds were utilized shown in Figure 6 for filtration experiments, where the sixth set F [Figure 6F] had zero noise points and was excluded from DR calculations. Noise points were segmented using Cloud Compare software to obtain the total number of noise points before filtration: NS, while the total number of noise points after algorithmic filtration was defined as NP. The quantity of points correctly filtered out was determined as NS - NP. DR was then calculated using the following Equation:
As shown in Table 3, the first through third groups of point clouds were heavily influenced by noise interference, characterized by a regular geometric distribution of noise points. Consequently, the algorithm exhibited a higher DR in these instances. In contrast, the fifth group of point clouds had low noise density and less distinct features (as shown in Figure 6), resulting in a relatively lower DR. The fourth group of point clouds exhibited the most complex noise structure, characterized primarily by irregular surface distributions. The number of noise points significantly exceeded that of the pig body point cloud, resulting in the lowest DR among all groups. In summary, the algorithm effectively reduced the number of noise points in heavily interfered point cloud groups to below the number of pig body points, while maintaining lower DRs for groups with less interference to avoid false filtering. The experimental results indicated that module 2 possessed filtering capabilities for different noise intensities.
DRs for different noise interference complexities
| Point cloud ID (corresponding to Figure 6) | Total number of noise points before filtering-NS | Total number of noise points after filtering-NP | Denoising rate-DR |
| A | 22,302 | 1,316 | 94.1% |
| B | 26,720 | 1,831 | 93.1% |
| C | 25,833 | 1,820 | 93.0% |
| D | 27,727 | 11,022 | 60.2% |
| E | 4,804 | 1,751 | 63.5% |
The final clustered results after filtering were shown in Figure 12.
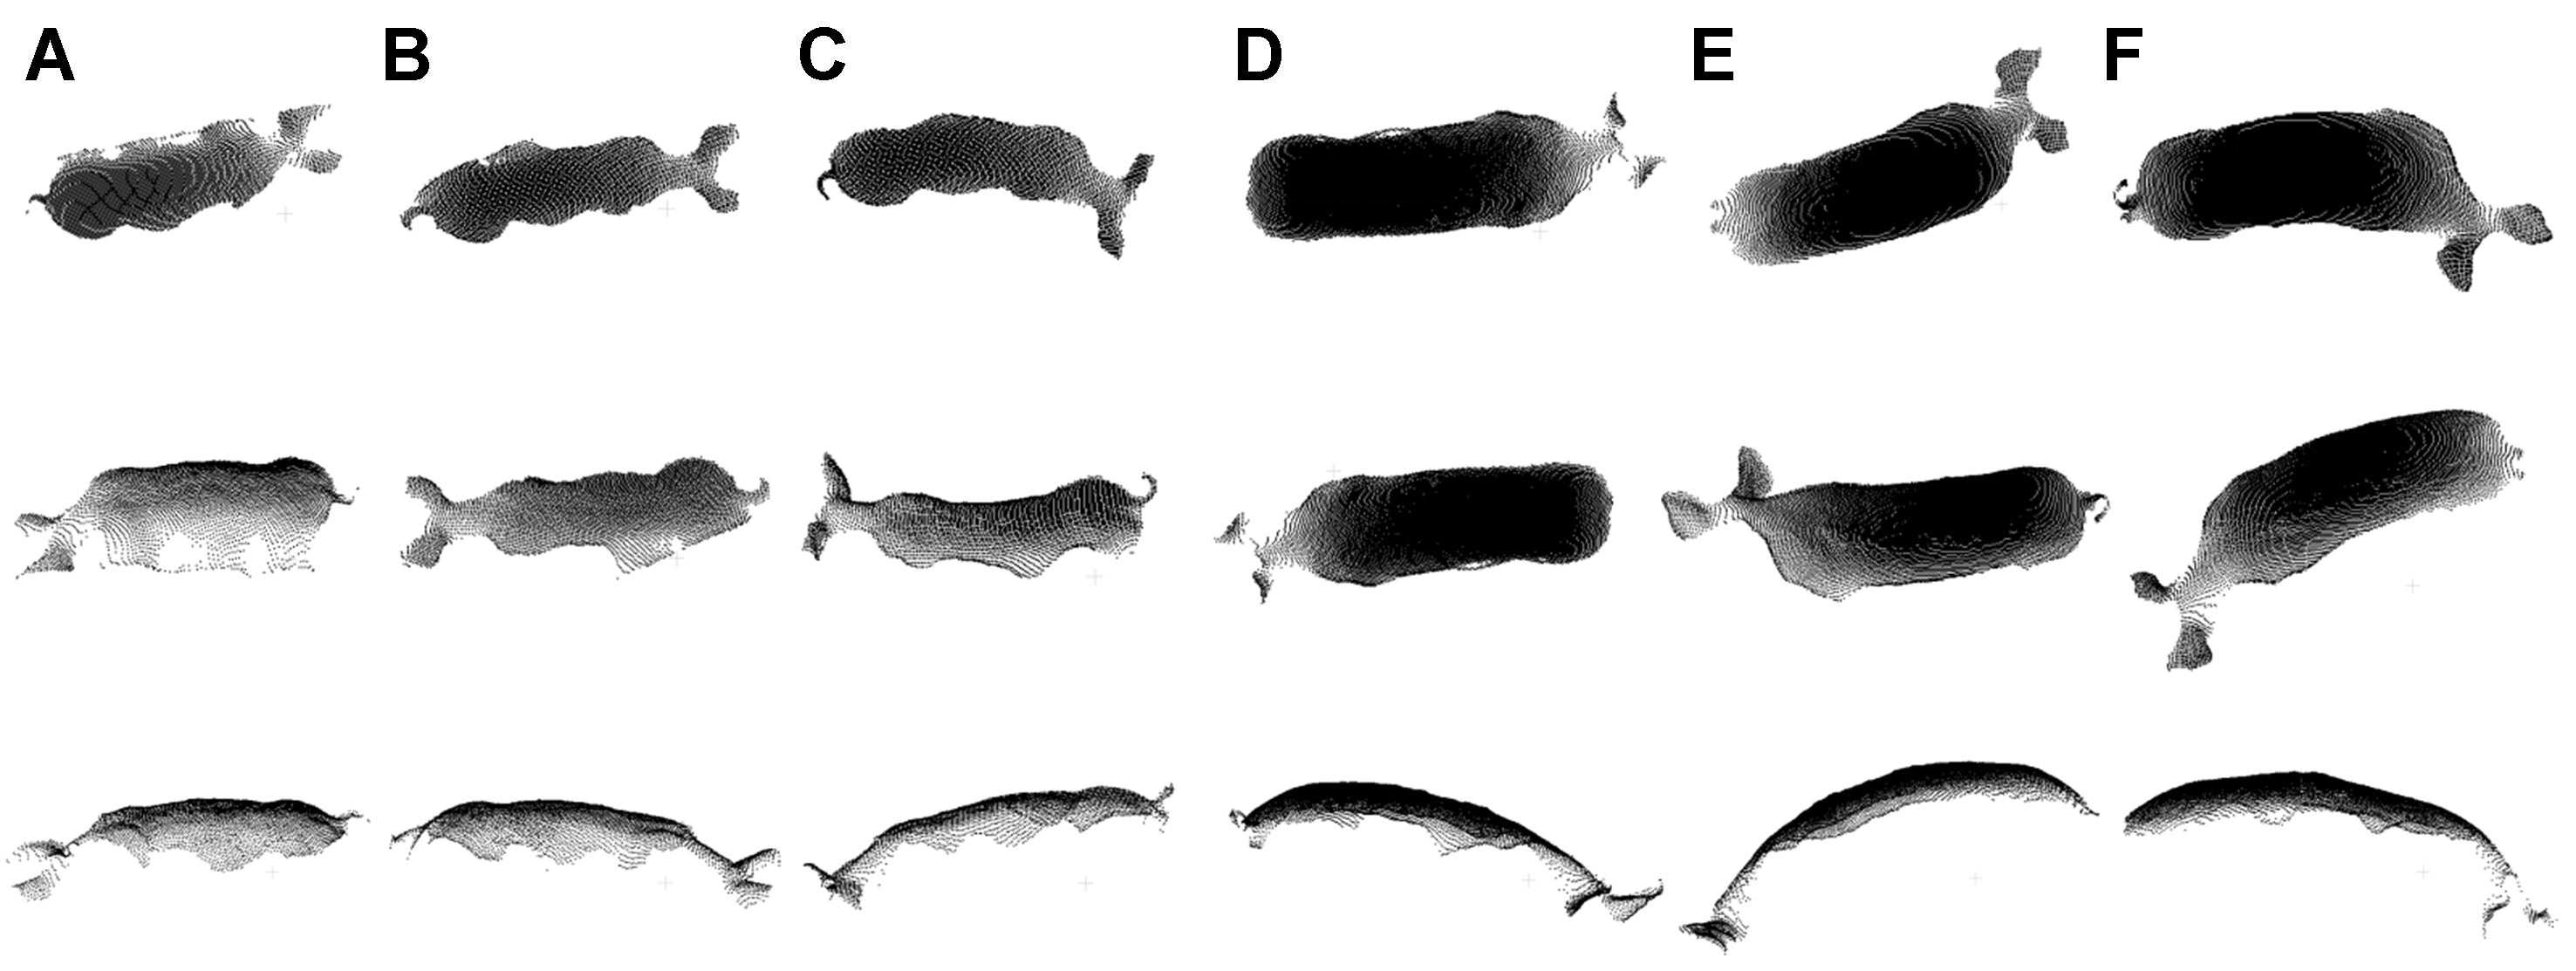
Figure 12. Target pig body point cloud cluster extraction results, the extraction results (A-F) in the figure correspond to the point cloud input of Figure 6. Each column represents a different perspective of the same pig.
3.2. Accuracy of target pig body extraction
For PCS and extraction tasks, model performance is typically evaluated using intersection over union (IoU). In this study, which addressed a binary classification task distinguishing non-target negative samples (environmental noise) from target positive samples (pig body point cloud), IoU was employed to evaluate the classification performance in pig body point cloud extraction. Manual PCS using Cloud Compare software served as ground truth samples for calculating IoU and assessing extraction accuracy. IoU was computed using the following Equation:
The term TP in the above Equation represented the number of intersecting points between the algorithm’s positive instances and the manually segmented positive instances. FP represented the number of intersecting points between the manually segmented positive instances and the points incorrectly classified as negative by the algorithm. FN represented the number of intersecting points between the manually segmented negative instances and the points incorrectly classified as positive by the algorithm. A total of 987 sets of point cloud datasets were utilized for evaluation and validation, with IoU calculated for each set and the average value computed in the end, a set with IoU less than 0.90 is defined as misclassified and does not participate in averaging, the mis-segmentation rate is 0.17 (clarified in the limitations chapter), and the average IoU value including mis-segmentation is 0.836. The distribution histogram of correctly segmented IoU values was shown in Figure 13A, with the majority of sample accuracies concentrated between 0.98 and 1.0 as shown in orange mark. The scatter plot in Figure 13B illustrated an average IoU value of 0.984 as shown in orange mark. Figure 14 presented examples of pig body target extraction results.
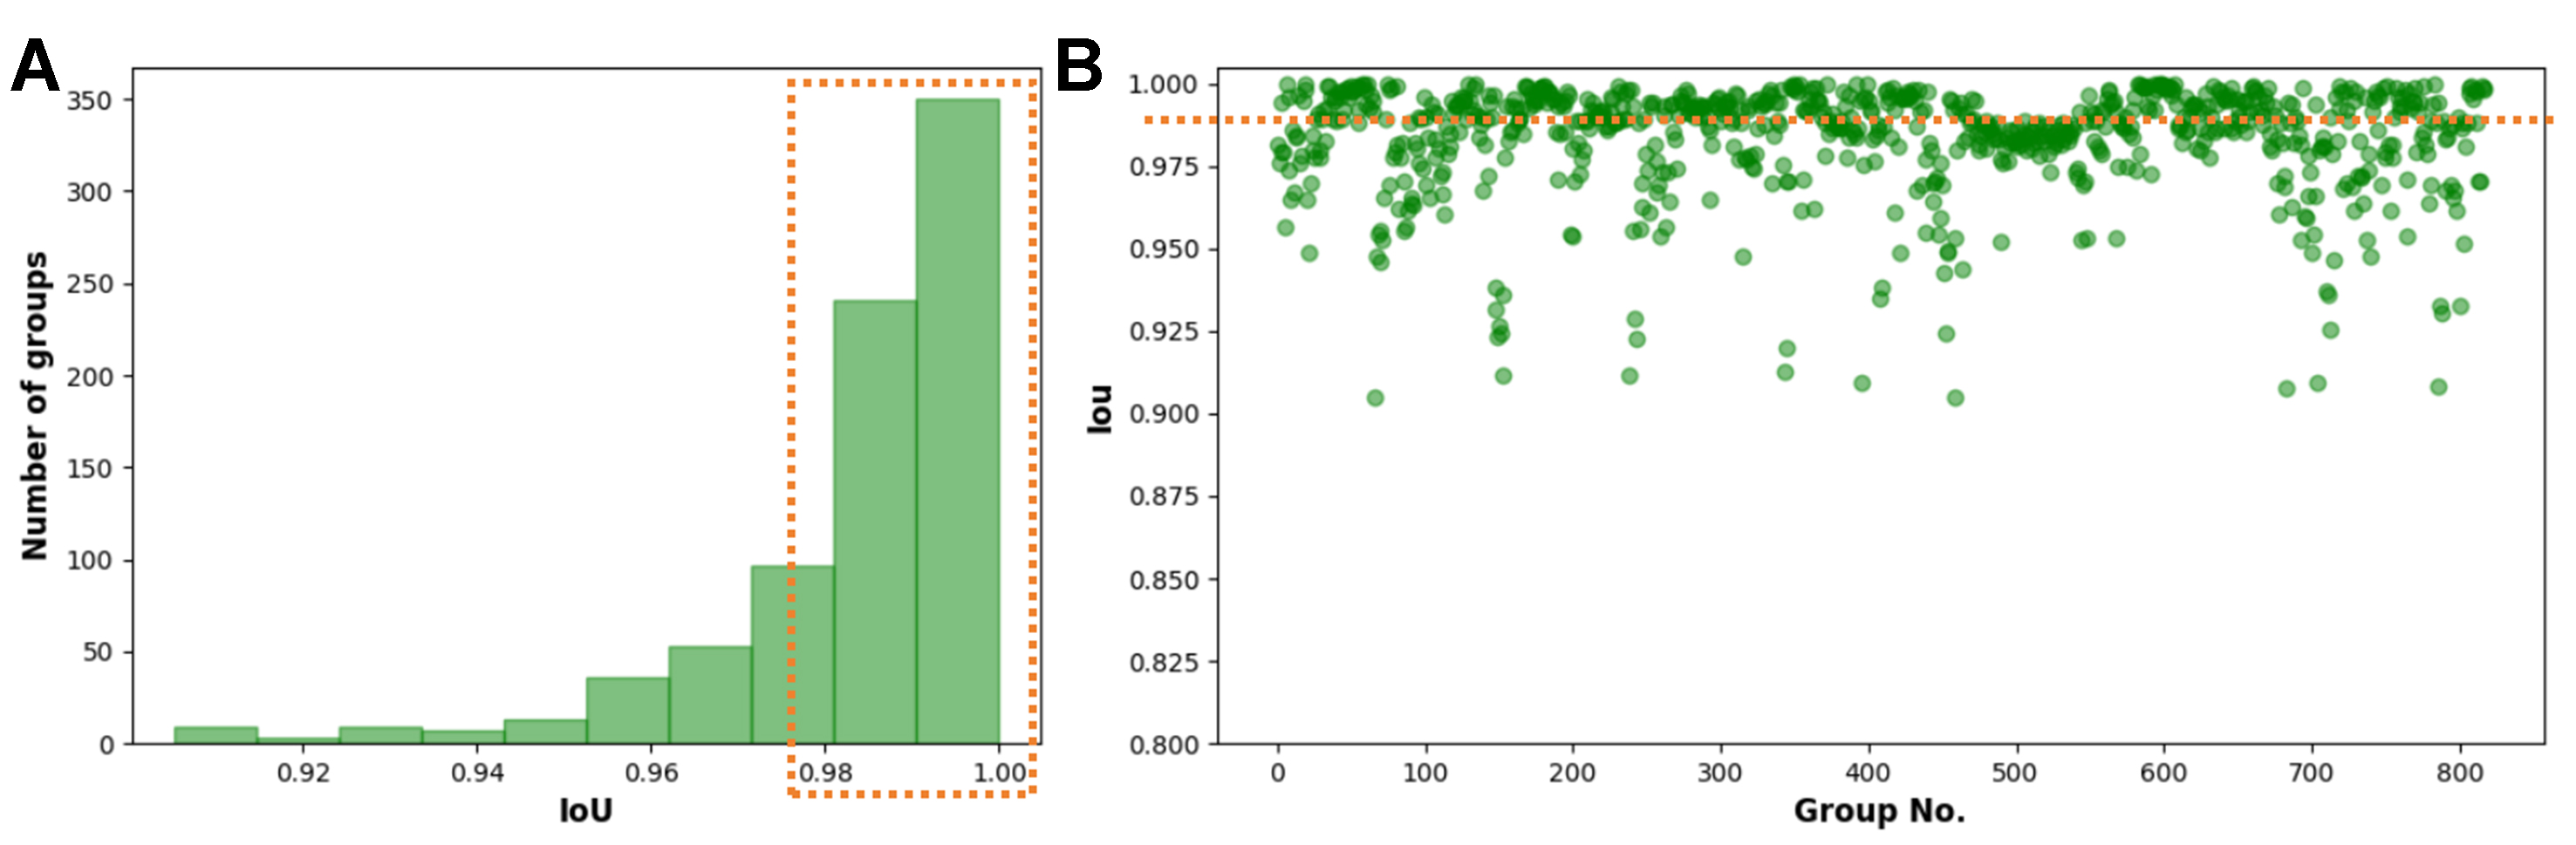
Figure 13. Distribution of IoU values for pig body target extracted using the algorithm (Point cloud sets with IoU less than 0.90 are considered as erroneous segmentation and are not displayed in the figure). (A) Distribution histogram of IoU values; (B) Scatter plot of IoU values. IoU: Intersection over union.
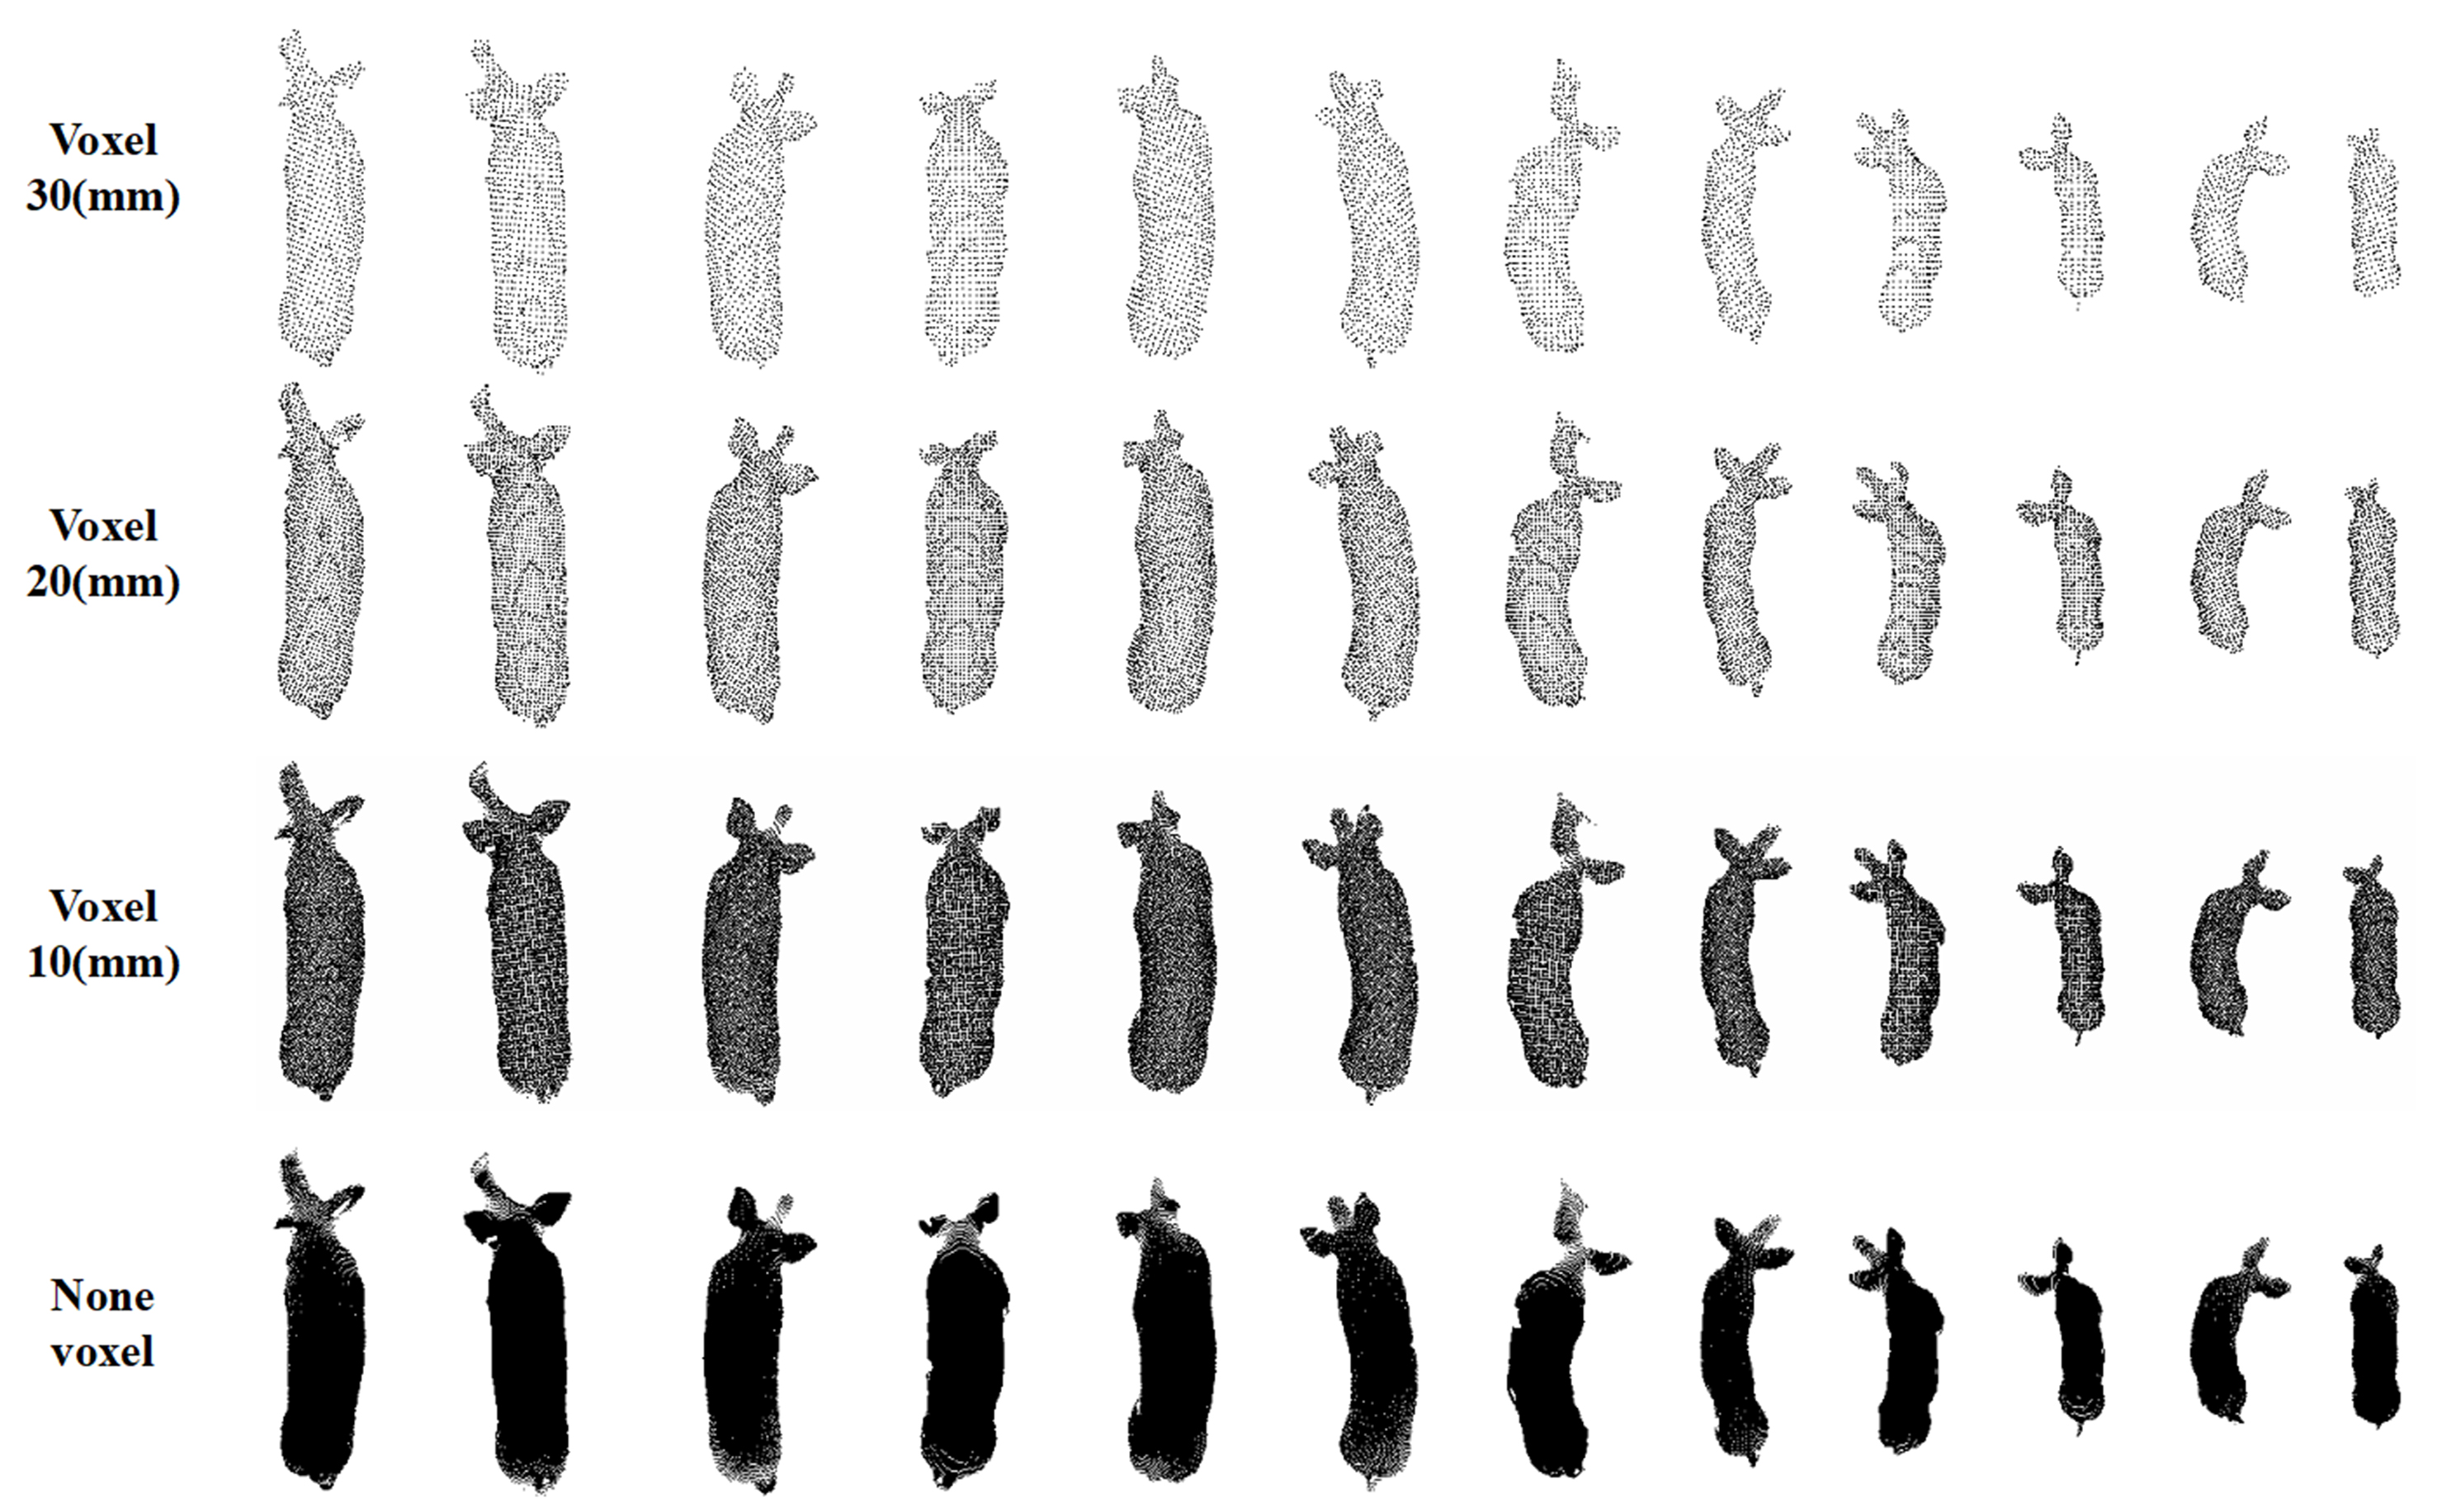
Figure 14. Pig body target extraction results using DPFFS. Each row corresponded to the extraction results obtained using different voxel sizes V, with the last row showing the original high-density point cloud without downsampling. Each column displayed the results for the same target at varying voxel values. DPFFS: Dynamic point-cloud feature focusing and segmentation.
3.3. Runtime of algorithm
To evaluate the computational efficiency of the DPFFS algorithm, this study recorded the runtime of module 1, RANSAC, module 2, and the overall algorithm (encompassing processes such as point cloud coordinate correction, Euclidean clustering, and disk storage) across 987 extraction experiments. The maximum, minimum, and average runtime values were calculated and documented. As mentioned in Section 2.4.1, the runtime durations for four configurations were recorded, including the original point cloud without voxel downsampling, and voxel downsampling with voxel sizes of 10, 20, and 30 mm, as shown in Table 4.
Runtime of DPFFS
| Content | Runtime of module 1/s | Runtime of RANSAC/s | Runtime of module 2/s | Runtime of overall/s | ||||||||
| Voxel | Min | Max | Avg | Min | Max | Avg | Min | Max | Avg | Min | Max | Avg |
| Non V | 0.087 | 0.139 | 0.095 | 0.149 | 5.383 | 1.934 | 0.999 | 18.249 | 6.267 | 1.086 | 18.408 | 6.287 |
| V = 30 mm | 0.060 | 0.748 | 0.097 | 0.062 | 2.615 | 1.001 | 0.007 | 0.154 | 0.044 | 0.079 | 0.946 | 0.143 |
| V = 20 mm | 0.060 | 0.846 | 0.099 | 0.060 | 5.495 | 1.174 | 0.010 | 0.365 | 0.126 | 0.090 | 1.570 | 0.228 |
| V = 10 mm | 0.062 | 0.697 | 0.100 | 0.066 | 3.680 | 1.217 | 0.048 | 2.467 | 0.826 | 0.145 | 2.794 | 0.928 |
The original point cloud data, without downsampling, posed challenges due to its large scale, requiring processing of a greater number of neighboring points within the search radius during the traversal filtering process. This results in increased iteration counts and higher time complexity. Employing a 10 mm voxel downsampling strategy ensured that the total runtime was approximately 1 s, while preserving the essential geometric features of the point cloud, thereby achieving efficient pig body extraction. To balance efficiency and accuracy, the configuration with a voxel size of 10 mm was selected for practical use.
3.4. Applicability
The method proposed in this study was applicable for the holistic point cloud extraction of multiple-target pig bodies, fixed-scene pig body extraction, and also transferable to cattle body extraction tasks. In multi-target extraction scenarios, adjustments to the size parameters of the region of interest and clustering threshold parameters were necessary (Because the previously defined size of the region of interest was only for one pig, it is necessary to enlarge the region to include more pigs and point clouds during group segmentation. The parameters of algorithm core modules 1 and 2 do not need to be changed), while the filtering parameters remain unchanged. The characteristics of pig bodies and noise in both fixed and dynamic scenes exhibited a high degree of consistency, obviating the need for additional algorithm parameter adjustments. For cattle body extraction tasks, the clustering threshold parameters was required (Because cattles are much larger in size than pigs and have more point clouds, only the clustering threshold parameters need to be adjusted. The parameters of the core modules 1 and 2 of the algorithm do not need to be changed). To validate the method’s generalization capability, 25 sets of pig group point clouds, 34 sets of fixed-scene point clouds, and 20 sets of cattle body point clouds were selected for experimentation. Some extraction results were shown in Figure 15, with a note that the cattle body point clouds were obtained from the top camera of non-contact gantry-type system[29]. As illustrated in Figure 15, the method is suitable for extracting the point cloud of the entire pig herd and the pig point cloud form fixed-scenes, also transferable to cattle body extraction.
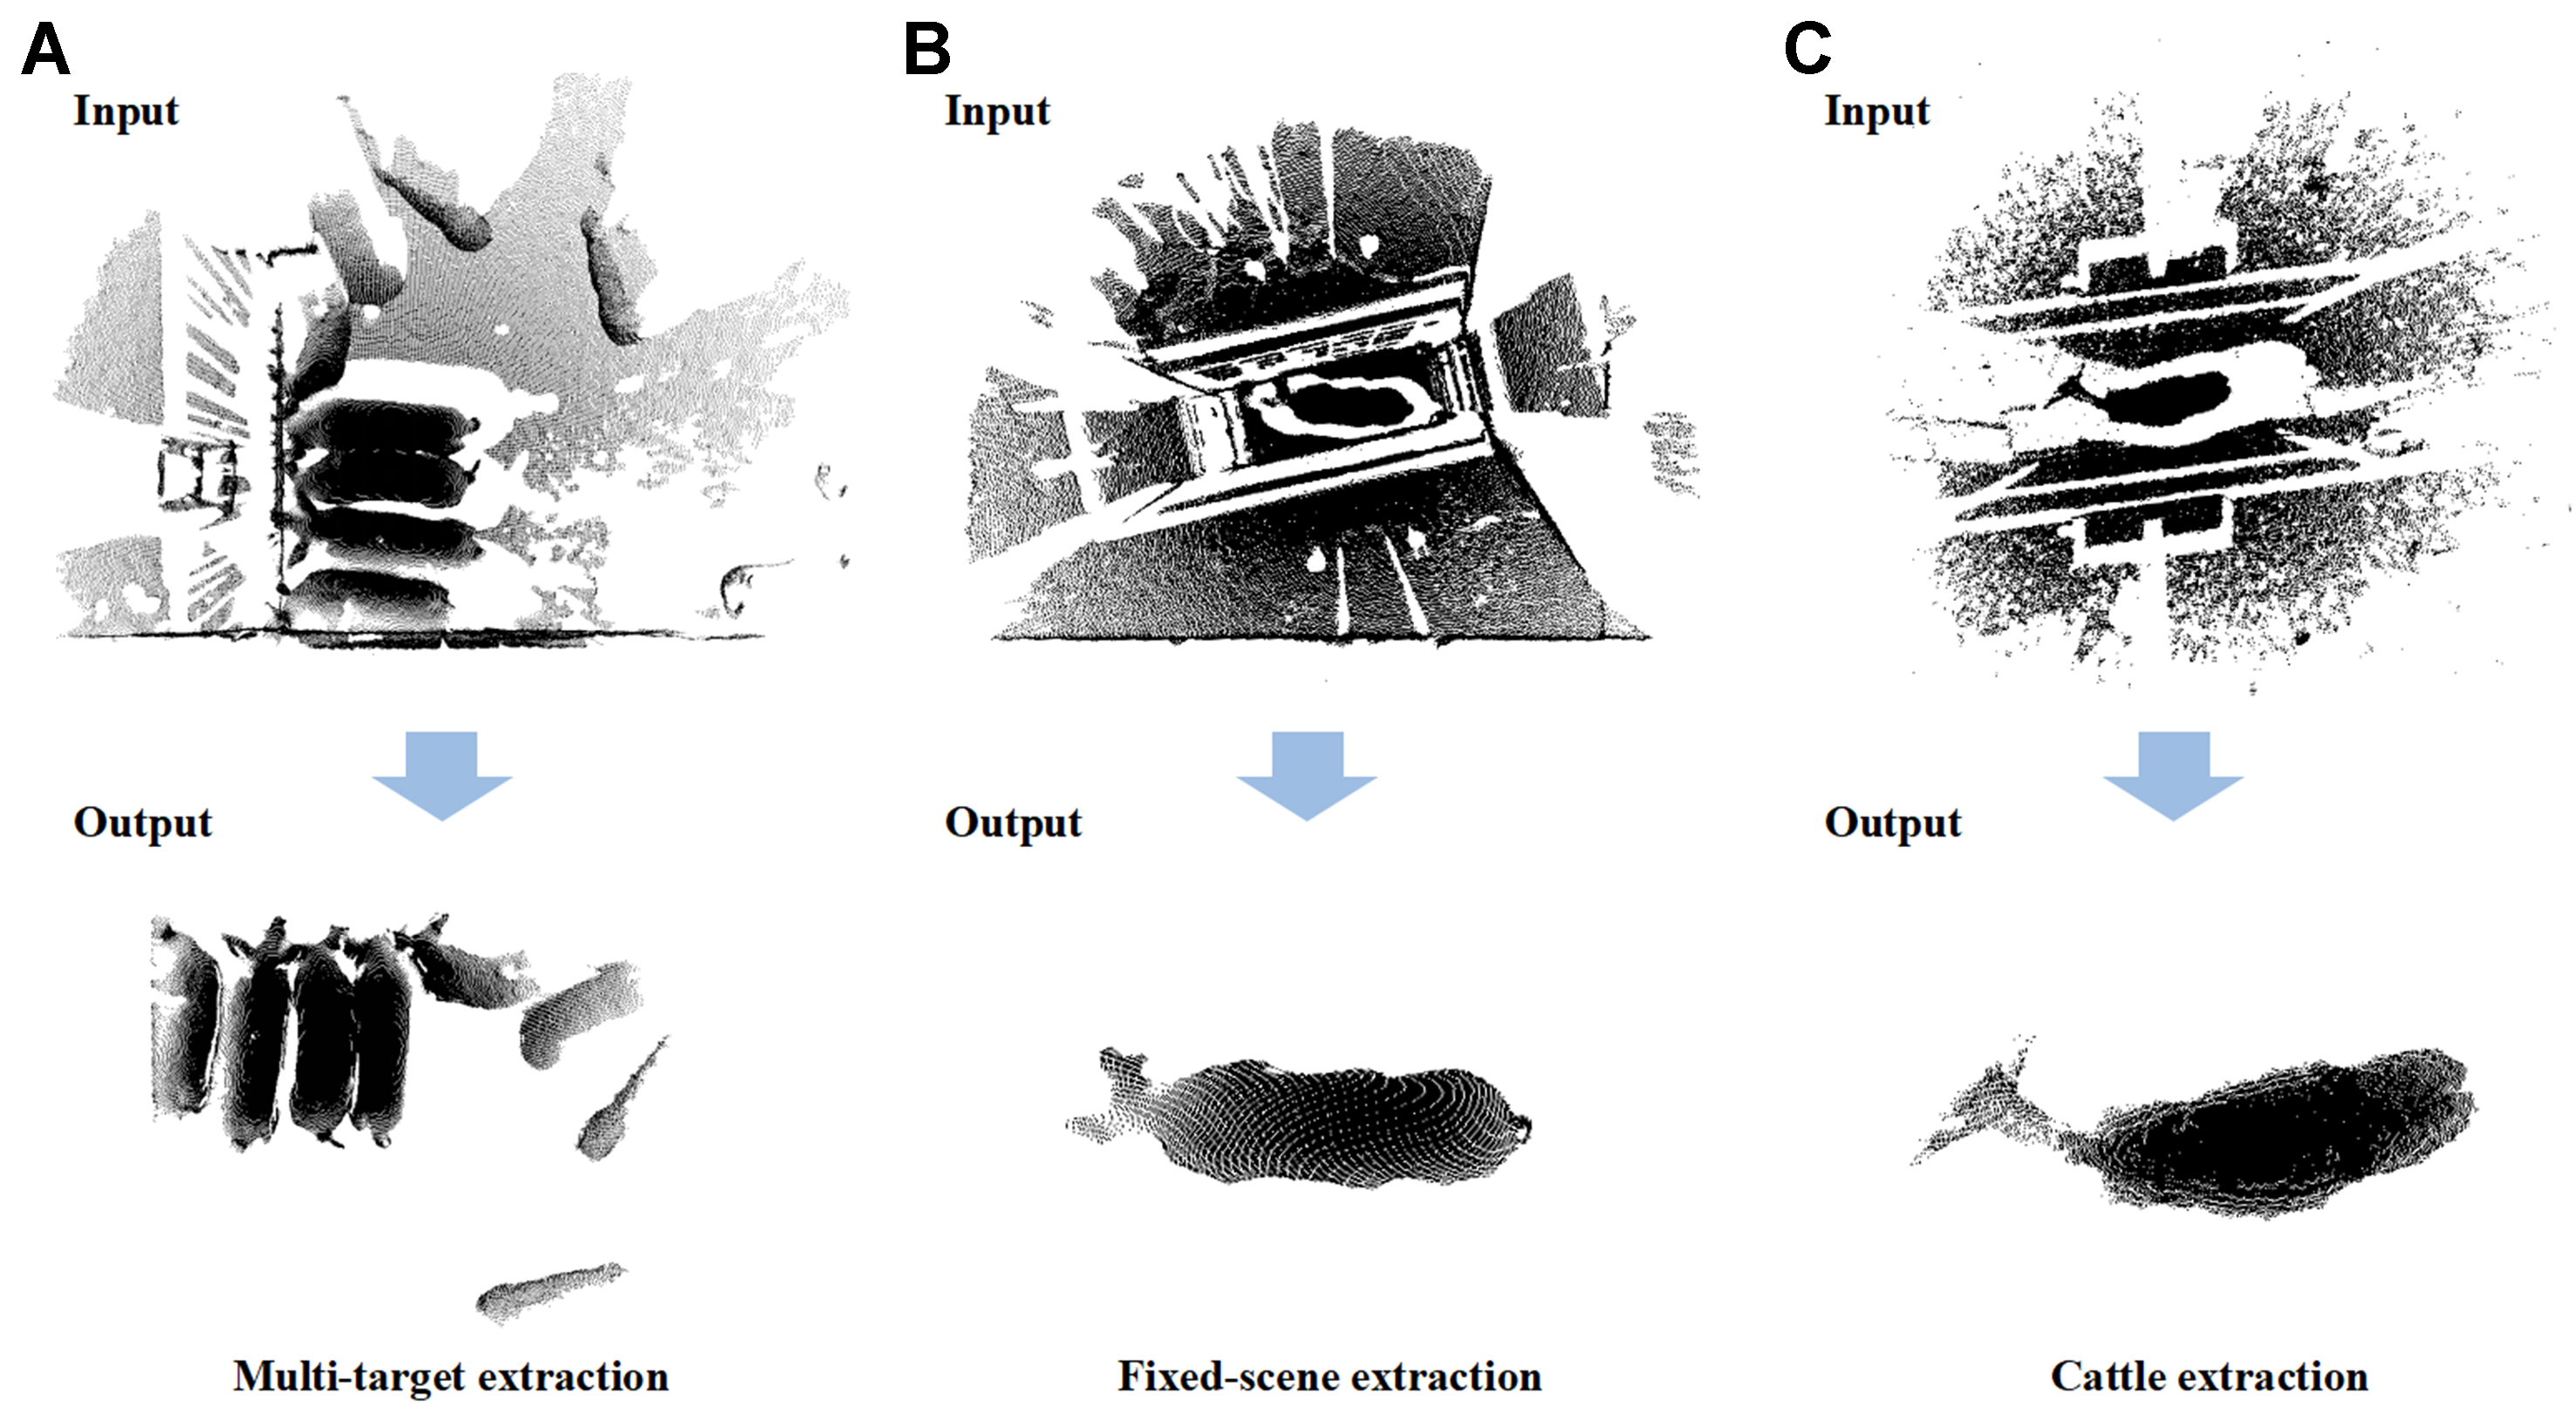
Figure 15. Some results of experiments on the applicability of the extraction method to other scenarios.
4. DISCUSSION
4.1. Discussion of algorithm parameters
It should be noted that this method was designed for the quantitative distribution characteristics of point clouds. Therefore, once the filtering parameters for module 1 and module 2 were set, there is no need to reconfigure them for different segmentation tasks. Parameters C and D have already been optimized, as shown in Figure 16. This single set of parameters can adapt to various segmentation tasks without adjustments, the previous chapter does not require adjusting the parameters of core module 1 and module 2 for different segmentation tasks.
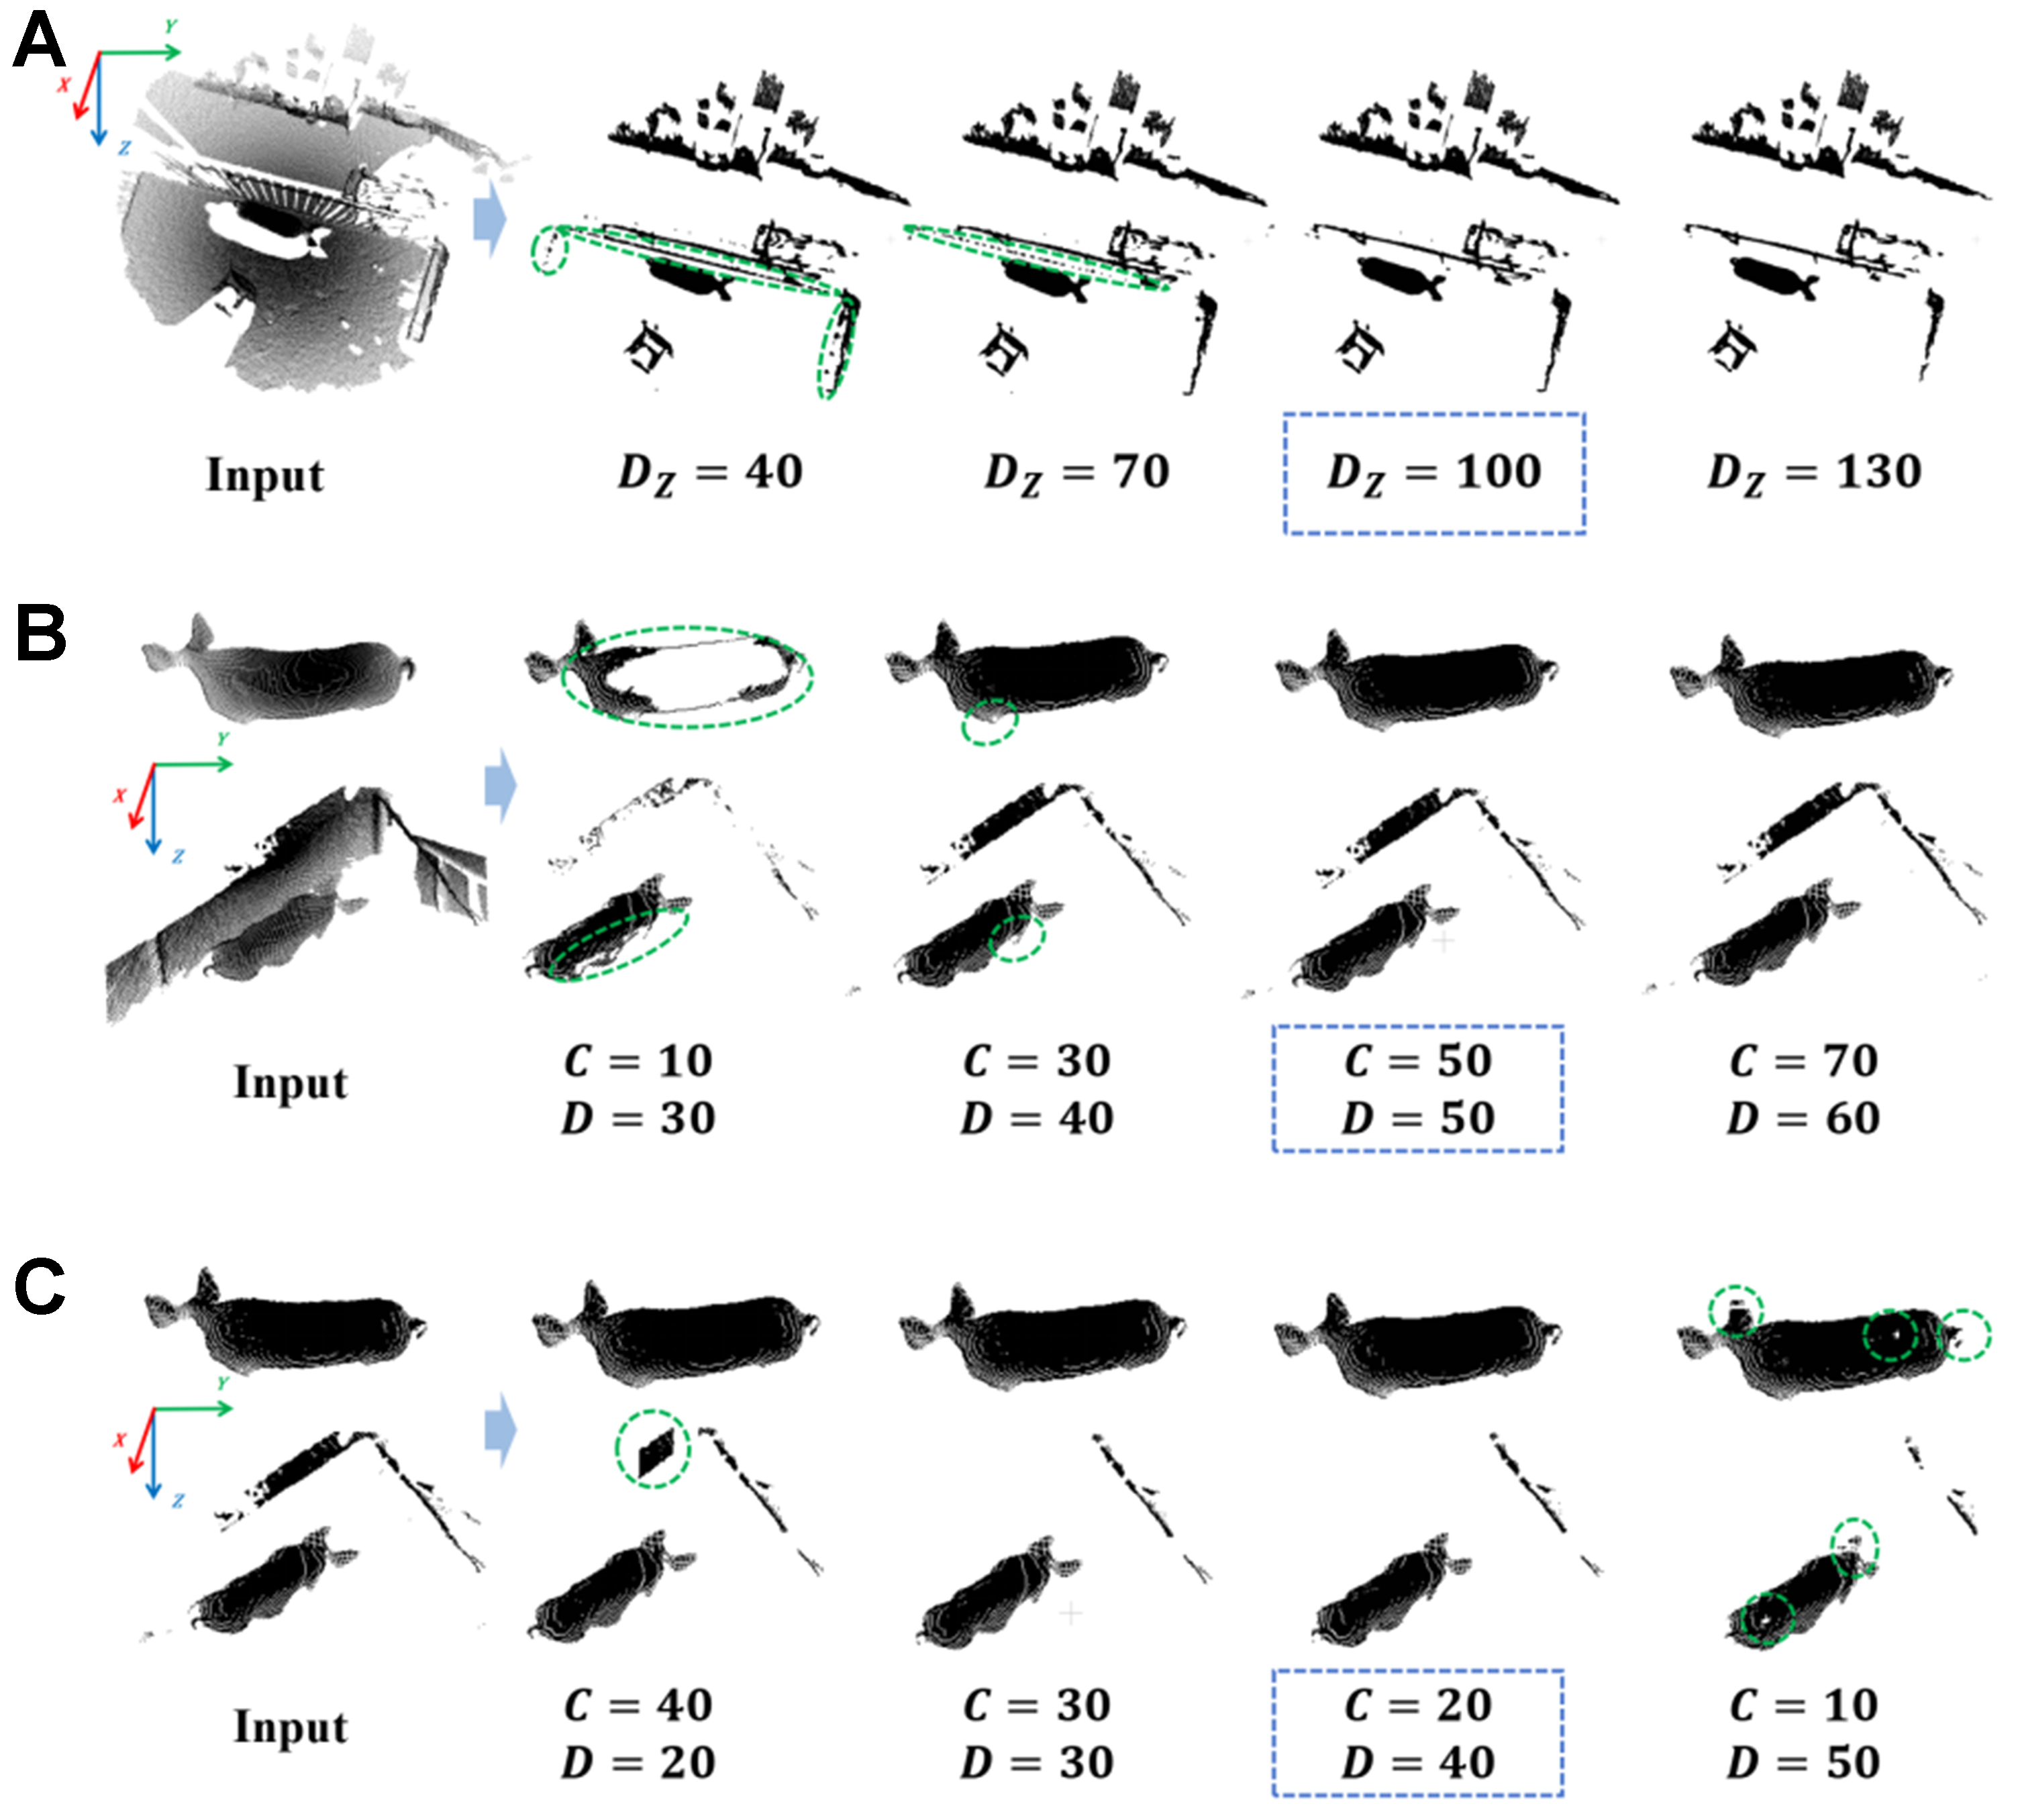
Figure 16. Comparison of filtering effect with different parameter values. (A) Ground noise filtering slice span value (DZ); (B) 3D vertical noise filtering count parameter and span parameter values (C and D); (C) 2D horizontal noise filtering count parameter and span parameter values (C and D).
In the parameter selection of module 1, a comparison was conducted on different values of the slice span DZ, with 4 sets of parameters chosen for experimentation. When DZ was too small, such as 40 (mm), incomplete denoising results in a significant amount of residual ground noise points, as indicated by the green markers in Figure 16A. When DZ was set to 70 (mm), residual corner noise points persist in the contact area between the railing and the ground. Conversely, with an large DZ value, such as 130 (mm), ground noise points were thoroughly removed. However, this improvement comes at the cost of increased misidentification rates, especially when pigs lower their heads to the ground or approach wall corners, which leads to erroneous filtering of pig body point clouds. Therefore, the optimal parameter of 100 (mm) was selected to maintain a balanced trade-off, ensuring precise control of height errors.
In the parameter selection of module 2, a comparison was made on the count parameter C and the span parameter D threshold, with 4 sets of experiments conducted for each. When C was too small (e.g., C = 10), the misfiltering rate increases, as indicated by the green markers in Figure 16B. Conversely, excessively large values of C reduce the filtering effectiveness. For the span parameter D in 3D perceptual spatial filtering, a small value was necessary to ensure thorough removal of vertical noise points. In contrast, in 2D perceptual spatial filtering, a large value for D was preferred to avoid erroneously filtering out points on the edges of pig body contours. The final determination set the 3D filtering parameters C and D to 50 and 50 mm, respectively, and the 2D filtering parameters C and D to 20 and 40 mm, respectively. Furthermore, variations in voxel size do not affect the aforementioned parameters, eliminating the need to adjust the C and D parameter configurations for different voxel sizes.
4.2. Limitations
Despite its advantages, the method has certain limitations that should be acknowledged. First, the data collected in this study lacked variations in height, making it difficult to validate whether precise target extraction is still achievable in extreme cases where the camera is in close proximity to the pig body. Additionally, data collection did not include slatted floor, preventing the assessment of the denoising effect on floor gap point clouds. Future work may include expanding the dataset to a larger scale.
Furthermore, among the 987 data sets, there were 28 datasets exhibiting IoU below 0.90, with 141 data sets having an IoU of 0 (IoU less than 0.90 are defined as incorrect segmentation). These incorrect segmentation point cloud sets with IoU equals 0 are all due to the fact that the target pig is close to other fences, and there are many pigs in other fences, resulting in a significantly lower number of point clouds for the target pig than for the pig groups. The principle of clustering is to extract the largest part of all point cloud clusters, so the pig group point cloud cluster is erroneously extracted instead of the target pig, resulting in TP equals 0 when calculating IoU, leading to incorrect segmentation. Therefore, for objectively evaluating the accuracy of the method, we introduced the mis-segmentation rate, which considers all point cloud groups with IoU less than 0.90 as error segmentation. The calculated error segmentation rate is 0.17, and the average IoU without calculating error segmentation is 0.984, the average IoU with calculating error segmentation is 0.836. The principle of clustering is to calculate the distance between points to form a set of clusters, it can only extract the cluster that meets the conditions by manually setting a threshold. Therefore, when distinguishing between noise and target pig body point clouds, we extract the largest point cloud cluster by setting a point number threshold, which can obtain the correct target. However, when distinguishing between pig groups point clouds and individual target pig bodies, the number of point clouds in the pig groups are much larger than that of a single target pig, resulting in incorrect extraction as shown in Figure 17. This limitation needs to be addressed by changing the basic computing principles of clustering, such as determining variance.
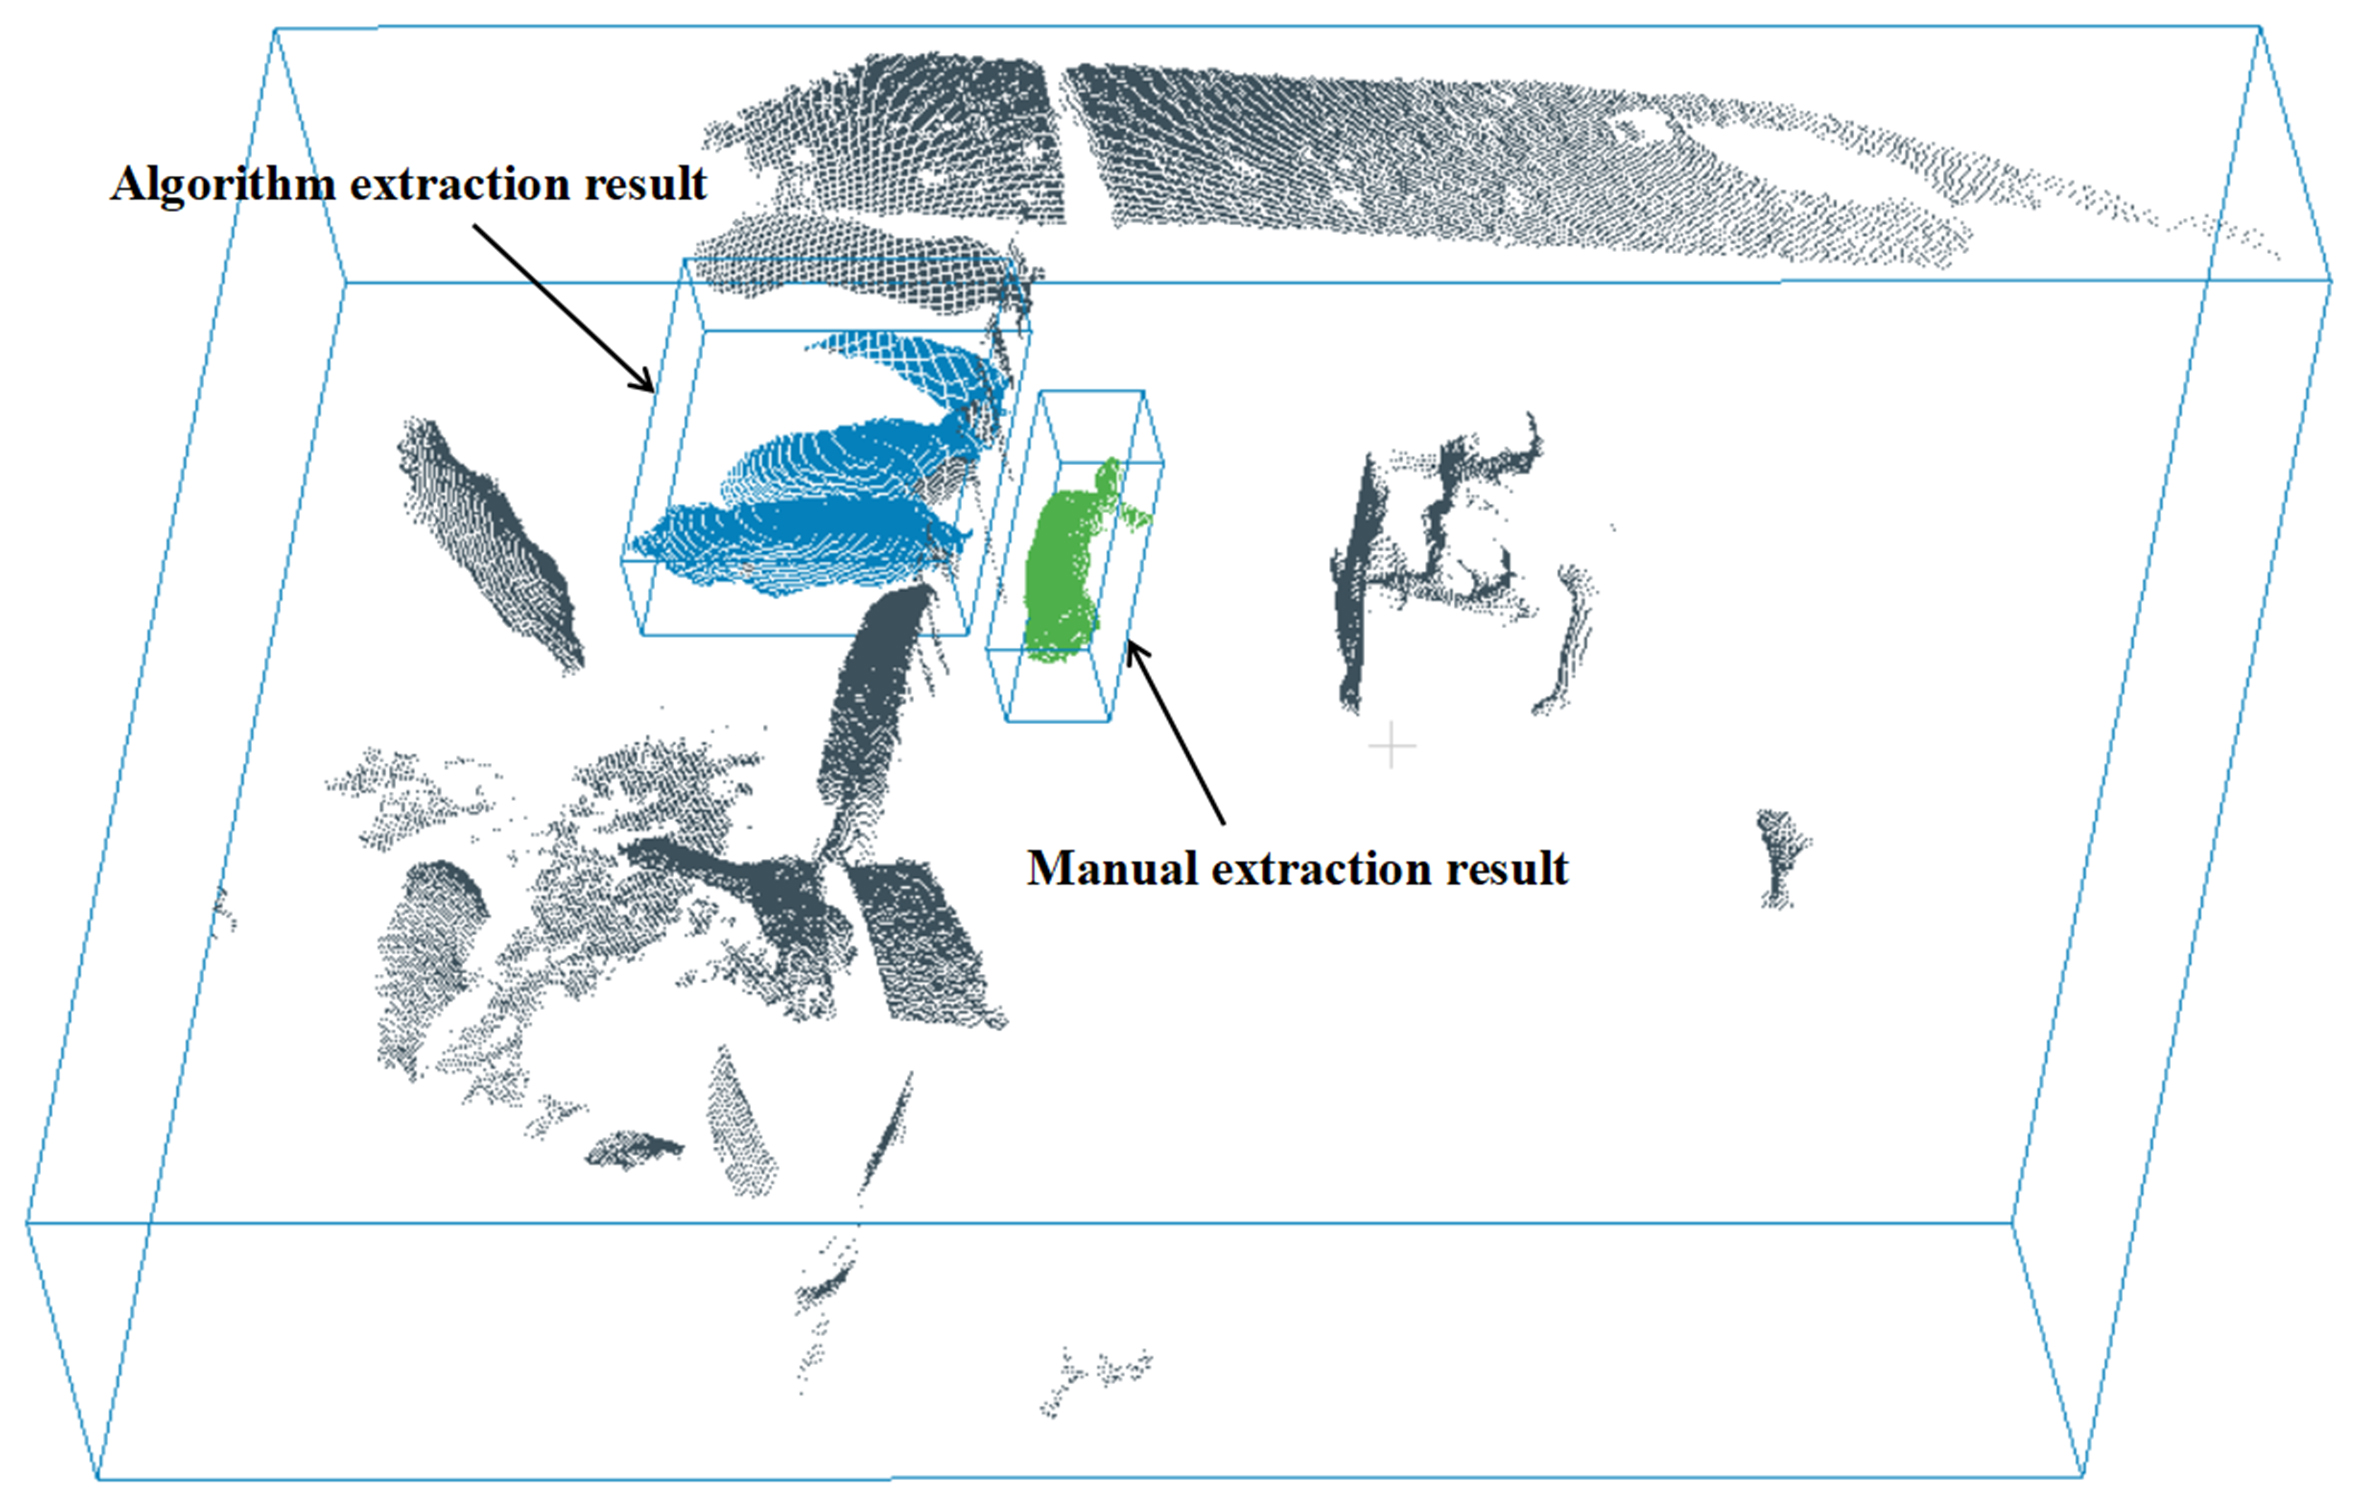
Figure 17. Visualization of algorithm erroneous clustering.
Therefore, in future research, more different scenarios and collection heights will be introduced to further validate its applicability, as well as to distinguish between pig herds and individual pigs through discriminant variance, improved clustering, or designing other geometric methods, the method proposed in this study can also be used as an auxiliary module for point cloud preprocessing.
5. CONCLUSIONS
This study proposes a novel method for target extraction from pig point clouds captured from a top-down perspective. A dynamic algorithm, named DPFFS, was developed to address the challenges of complex environment. The Core module 1, Dynamic Point Counting Peak Statistical Filtering, effectively identifies and removes ground noise points, even when these appear at varying heights. The Core module 2, Dynamic Multi-Dimensional Perceptual Spatial Filtering, accurately extracts pig body point clouds even when they partially blend with background noise. Experimental results demonstrate that the proposed method successfully extracts pig point clouds in complex scenes, achieving an average segmentation accuracy (measured by the IoU) of 0.984, which is highly consistent with manual segmentation results, considering the unmanageable erroneous segmentation caused by the characteristics of the clustering method, the IoU also reached 0.836. When using a voxel size of 10 mm to simplify the point cloud, the algorithm maintained a processing time of less than 1 second per frame. Furthermore, the method shows strong applicability and can be extended to other point cloud extraction tasks involving multiple targets, fixed scenes, or other animals such as cows. However, some limitations remain, such as occasional misclassification of pig target during the clustering process. Overall, this method serves as an effective auxiliary module for point cloud preprocessing and offers valuable support for downstream applications such as pig back key point detection, body length and width measurement, posture angle estimation, and volume calculation.
DECLARATIONS
Authors’contributions
Conceptualization, data curation, software, writing - original draft: Li, M.
Conceptualization, methodology, supervision, funding acquisition: Li, Q.
Resources, writing - review and editing: Sun, C.
Data curation, software: Ji, X.; Xu, Z.
Resources, supervision: Yang, S. X.
Resources, project administration: Guo, H.
Resources, writing - review and editing: Zhou, H.
Resources, project administration, writing - review and editing: Ma, W.
Availability of data and materials
The data supporting the conclusions of this research are available from the corresponding author upon reasonable request.
AI and AI-assisted tools statement
During the preparation of this manuscript, the Doubao AI Model (Version: Web edition) was used solely for generating the pig image in Figure 2A. The tool did not influence the study design, data collection, analysis, interpretation, or the scientific content of the work. All authors take full responsibility for the accuracy, integrity, and final content of the manuscript.
Financial support and sponsorship
This work was supported by the Special Project for Outstanding Scientist Cultivation of Beijing Academy of Agriculture and Forestry Sciences (JKZX202214) and Sichuan Science Technology Program (No2021ZDZX0011).
Conflicts of interest
Yang, S. X. is the Editor-in-Chief of the journal Intelligence & Robotics, but was not involved in any steps of editorial processing, notably including reviewer selection, manuscript handling, and decision making, while the other authors have declared that they have no conflicts of interest.
Ethical approval and consent to participate
All animal experimental procedures in this study were formally reviewed and approved by the Institutional Animal Welfare and Animal Experimental Ethical Inspection Committee of the National Engineering Research Center for Information Technology in Agriculture (NERCITA), China (Approval No. DWFL-2025-2-02). The experimental protocols strictly adhered to the “3Rs” principles (Replacement, Reduction, and Refinement) and national guidelines for animal welfare. Furthermore, explicit permission and informed consent were obtained from the farm owner prior to data collection, and all experimental activities were conducted under their direct cooperation and supervision.
Consent for publication
Not applicable.
Copyright
© The Author(s) 2026.
REFERENCES
1. Hietala, P.; Juga, J. Impact of including growth, carcass and feed efficiency traits in the breeding goal for combined milk and beef production systems. Animal 2017, 11, 564-73.
2. Rzabayev, T. S.; Assanbayev, T. S.; Rzabayev, S.; Bazargaliyev, A.; Rzabayev, K. S. Linebreeding as a system of stock breeding to improve the productive qualities of horses of the Kushum breed. Reprod. Domest. Anim. 2022, 57, 1584-92.
3. Park, M.; Britton, D.; Daley, W.; et al. Artificial intelligence, sensors, robots, and transportation systems drive an innovative future for poultry broiler and breeder management. Anim. Front. 2022, 12, 40-8.
4. Palma-Molina, P.; Hennessy, T.; O’Connor, A. H.; et al. Factors associated with intensity of technology adoption and with the adoption of 4 clusters of precision livestock farming technologies in Irish pasture-based dairy systems. J. Dairy. Sci. 2023, 106, 2498-509.
5. Pethick, D. W.; Hocquette, J. F.; Scollan, N. D.; Dunshea, F. R. Review: Improving the nutritional, sensory and market value of meat products from sheep and cattle. Animal 2021, 15 Suppl 1, 100356.
6. Zulkifli, I. Review of human-animal interactions and their impact on animal productivity and welfare. J. Anim. Sci. Biotechnol. 2013, 4, 25.
7. Zhang, A. L. N.; Wu, B. P.; Jiang, C. X. H.; Xuan, D. C. Z.; Ma, E. Y. H.; Zhang, F. Y. A. Development and validation of a visual image analysis for monitoring the body size of sheep. J. Appl. Anim. Res. 2018, 46, 1004-15.
8. Li, J.; Green-Miller, A. R.; Hu, X.; et al. Barriers to computer vision applications in pig production facilities. Comput. Electron. Agric. 2022, 200, 107227.
9. Taylor, C.; Guy, J.; Bacardit, J. Prediction of growth in grower-finisher pigs using recurrent neural networks. Biosyst. Eng. 2022, 220, 114-34.
10. Guo, Q.; Sun, Y.; Orsini, C.; et al. Enhanced camera-based individual pig detection and tracking for smart pig farms. Comput. Electron. Agric. 2023, 211, 108009.
11. Wang, Y.; Xin, C.; Gao, Y.; et al. Advancing selective breeding in leopard coral grouper (P. leopardus) through development of a high-throughput image-based growth trait. Agric. Commun. 2024, 2, 100042.
12. Yin, L.; Cai, G.; Tian, X.; et al. Three dimensional point cloud reconstruction and body size measurement of pigs based on multi-view depth camera. Trans. Chin. Soc. Agric. Eng. 2019, 35, 201-8.
13. Du, A.; Guo, H.; Lu, J.; et al. Automatic livestock body measurement based on keypoint detection with multiple depth cameras. Comput. Electron. Agric. 2022, 198, 107059.
14. Hao, H.; Jincheng, Y.; Ling, Y.; Gengyuan, C.; Sumin, Z.; Huan, Z. An improved PointNet++ point cloud segmentation model applied to automatic measurement method of pig body size. Comput. Electron. Agricu. 2023, 205, 107560.
15. Kwon, K.; Park, A.; Lee, H.; Mun, D. Deep learning-based weight estimation using a fast-reconstructed mesh model from the point cloud of a pig. Comput. Electron. Agric. 2023, 210, 107903.
16. Luo, X.; Hu, Y.; Gao, Z.; Guo, H.; Su, Y. Automated measurement of livestock body based on pose normalisation using statistical shape model. Biosyst. Eng. 2023, 227, 36-51.
17. Na, M. H.; Cho, W. H.; Kim, S. K.; Na, I. S. The development of a weight prediction system for pigs using raspberry Pi. Agriculture 2023, 13, 2027.
18. Wang, G.; Li, Z.; Weng, G.; Chen, Y. An overview of industrial image segmentation using deep learning models. Intell. Robot. 2025, 5, 143-80.
19. Shuai, S.; Ling, Y.; Shihao, L.; et al. Research on 3D surface reconstruction and body size measurement of pigs based on multi-view RGB-D cameras. Comput. Electron. Agric. 2020, 175, 105543.
20. Lei, K.; Tang, X.; Li, X.; et al. Research and preliminary evaluation of key technologies for 3D reconstruction of pig bodies based on 3D point clouds. Agriculture 2024, 14, 793.
21. Grilli, E.; Menna, F.; Remondino, F. A review of point clouds segmentation and classification algorithms. Int. Arch. Photogramm. Remote. Sens. Spatial. Inf. Sci. 2017, XLII-2/W3, 339-44.
22. Shorten, C.; Khoshgoftaar, T. M. A survey on image data augmentation for deep learning. J. Big. Data. 2019, 6, 197.
23. Zhou, G.; Ye, W.; Li, S.; et al. FGPointKAN++ point cloud segmentation and adaptive key cutting plane recognition for cow body size measurement. Artif. Intell. Agric. 2025, 15, 783-801.
24. Okayama, T.; Kubota, Y.; Toyoda, A.; Kohari, D.; Noguchi, G. Estimating body weight of pigs from posture analysis using a depth camera. Anim. Sci. J. 2021, 92, e13626.
25. Li, G.; Liu, X.; Ma, Y.; Wang, B.; Zheng, L.; Wang, M. Body size measurement and live body weight estimation for pigs based on back surface point clouds. Biosyst. Eng. 2022, 218, 10-22.
26. Liu, Z.; Hua, J.; Xue, H.; Tian, H.; Chen, Y.; Liu, H. Body weight estimation for pigs based on 3D hybrid filter and convolutional neural network. Sensors 2023, 23, 7730.
27. Wang, Y.; Shi, Y.; Chen, Z.; et al. Pig Back Transformer: automatic 3D pig body measurement model. Smart. Agric. 2024, 6, 76-90.
28. Yang, L.; Li, Y.; Li, X.; Meng, Z.; Luo, H. Efficient plane extraction using normal estimation and RANSAC from 3D point cloud. Comput. Stand. Interfaces. 2022, 82, 103608.
Cite This Article
How to Cite
Download Citation
Export Citation File:
Type of Import
Tips on Downloading Citation
Citation Manager File Format
Type of Import
Direct Import: When the Direct Import option is selected (the default state), a dialogue box will give you the option to Save or Open the downloaded citation data. Choosing Open will either launch your citation manager or give you a choice of applications with which to use the metadata. The Save option saves the file locally for later use.
Indirect Import: When the Indirect Import option is selected, the metadata is displayed and may be copied and pasted as needed.
About This Article
Copyright

Data & Comments
Data
0


Comments
Comments must be written in English. Spam, offensive content, impersonation, and private information will not be permitted. If any comment is reported and identified as inappropriate content by OAE staff, the comment will be removed without notice. If you have any queries or need any help, please contact us at [email protected].